More records in run-up to Fed decision
- More milestones for indexes as data points to Fed cut
- Tech leads, bonds rally, gold grinds higher
- This week: Fed meeting, retail sales, quarterly expiration
There wasn’t much bad news last week, but what little there was appeared to be received as good news by the US stock market.
Lingering concerns about whether the Fed would cut rates this week appeared to ease last Thursday as a jump in weekly jobless claims highlighted a softening labor market. Meanwhile, a slightly-warm consumer price index (CPI) wasn’t enough to offset the impression of moderate inflation signaled by Wednesday’s much-cooler producer price index (PPI). The S&P 500 (SPX) set fresh intraday or closing records every day but Monday:
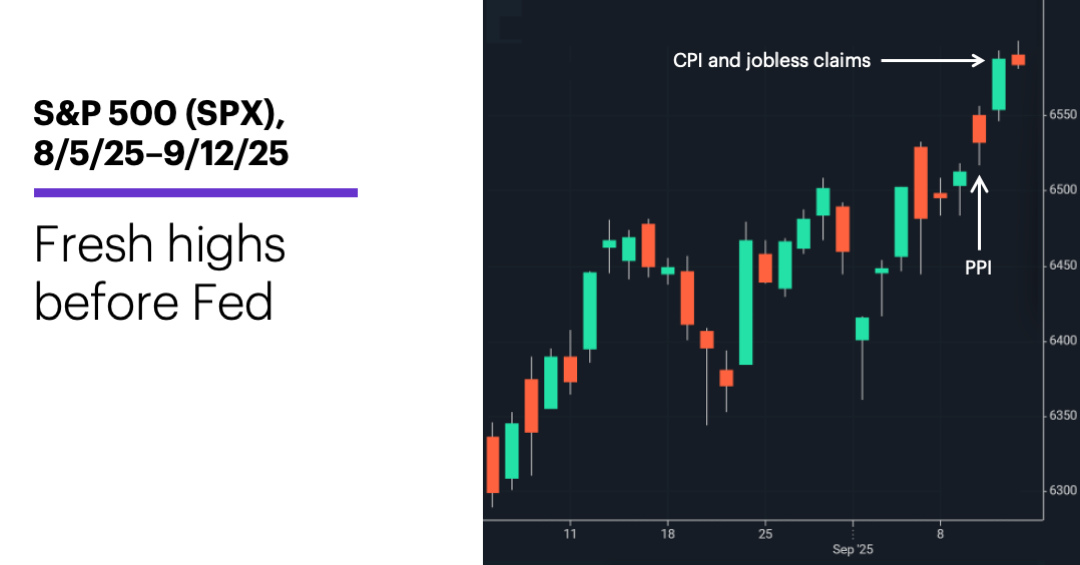
Source: Power E*TRADE. (For illustrative purposes. Not a recommendation. Note: It is not possible to invest in an index.)
The headline: Rally extends as Fed decision approaches.
The fine print: Interest rates are in the spotlight this week, but a different Fed storyline shouldn’t be disregarded. The sharp rally in gold—which is up nearly 40% for the year and roughly 10% since August 19—suggests the risks to Fed independence are real, according to Morgan Stanley Wealth Management.1
The number: 263,000, the number of weekly initial jobless claims reported last Thursday—the highest total since 2021.
The scorecard: The Nasdaq 100 (NDX) tech index led the market last week:
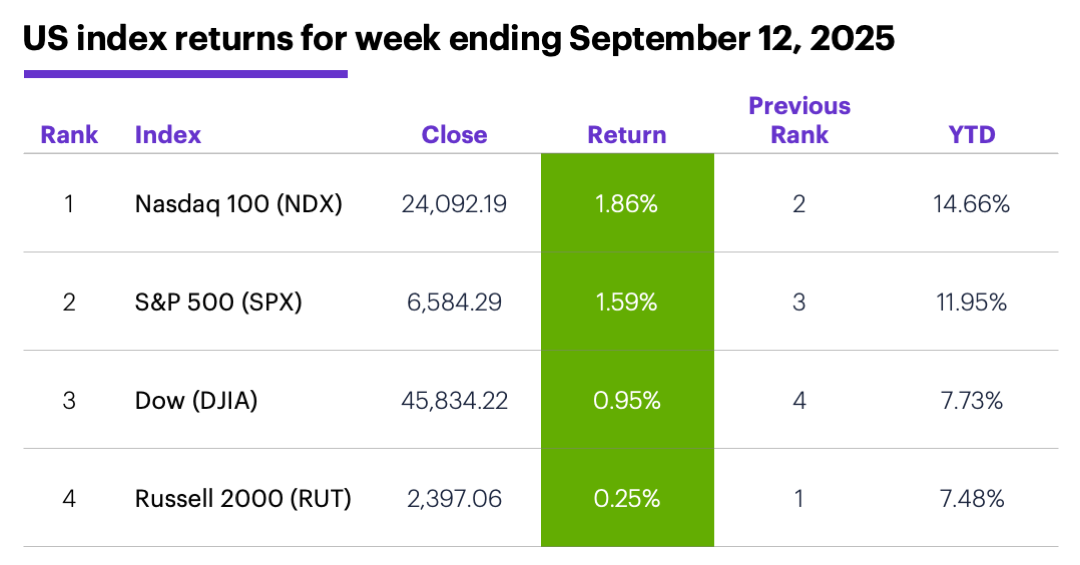
Source (data): Power E*TRADE. (For illustrative purposes. Not a recommendation.)
Sector returns: The strongest S&P 500 sectors last week were tech (+3.1%), utilities (+2.5%), and energy (+1.6%). The weakest sectors were consumer staples (-0.04%), materials (+0.03%), and health care (+0.4%).
Stock moves: Rapport Therapeutics (RAPP) +119% to $31.47 on Monday, Tourmaline Bio (TRML) +58% to $47.64 on Tuesday. On the downside, Summit Therapeutics (SMMT) -25% to $19.45 on Monday, Core & Main (CNM) -25% to $49.70 on Tuesday.
Yields: The 10-year US Treasury yield fell 0.03% to 4.06% last week.
US dollar: The US Dollar Index (DXY) fell 0.22 to 97.55
Futures: December gold (GCZ5) hit more record highs, ending the week up $33.10 at $3,686.40. October WTI crude oil (CLV5) ended a choppy week up $0.82 at $62.69. Biggest rallies: December palladium (PAZ5) +10.7%, September ether (ETHU5) +6.9%. Biggest declines: October butter (CBV5) -10.9%, October VIX (VXV5) -5.8%.
Coming this week
The odds of a 0.25% rate cut on Wednesday stood at 96.5% at the end of last week:
●Monday: Empire State Manufacturing Index
●Tuesday: retail sales, import price index, industrial production and capacity utilization, NAHB Housing Market Index, business inventories
●Wednesday: housing starts and building permits, Fed interest rate decision
●Thursday: Philadelphia Fed Manufacturing Survey, Leading Economic Indicators Index
●Friday: “triple-witching” expiration (stock options, stock index futures, stock index options)
This week’s earnings include:
●Monday: Dave & Buster’s (PLAY), US Gold (USAU)
●Tuesday: Steelcase (SCS)
●Wednesday: Cracker Barrel (CBRL), General Mills (GIS), Lennar (LEN)
●Thursday: Darden Restaurants (DRI), FactSet (FDS), FedEx (FDX)
Check the Active Trader Commentary each morning for an updated list of earnings announcements, IPOs, economic reports, and other market events.
23 weeks in
On Friday, the SPX closed a little less than 30% above its April 4 weekly close of 5,074.08—its strongest 23-week rally since September 2020, when the market was mounting a record-setting rally off its COVID sell-off lows.
For perspective, the SPX’s average 23-week return since 1957 is 3.7%, and the average positive 23-week return is 8.9%. In other words, the market’s recent rally has been “big” by any historical measuring stick, notwithstanding the fact that it followed a nearly 20% sell-off.
While consulting the historical record can often provide useful insights into market behavior, extreme moves like this one make it more difficult to make comparisons. In fact, there have been only nine other 29% (or larger) 23-week rallies over the past 68 years2—far short of a statistically valid sample size. That said, this handful of examples pointed toward a slight bias for short-term market softness, with the SPX closing lower the next two weeks five out of nine times. However, the SPX posted a net gain five of nine times after four weeks.
Longer term is a different story. While Morgan Stanley & Co strategists recently acknowledged the potential for choppy price action during the “weak seasonal window in September-October,” they also argue any consolidation would set up a strong finish to the year (and 2026), in light of their expectations for a “durable and broad earnings recovery.”
Click here to log on to your account or learn more about E*TRADE's trading platforms, or follow the Company on X (Twitter), @ETRADE, for useful trading and investing insights.
1 Morgan Stanley.com. Fed Cred. 9/8/25.
2 Figures reflect S&P 500 (SPX) weekly closing prices, 1956-2025. The instances cited refer to initial, non-consecutive examples—i.e., weeks the SPX closed at least 29% above the close 23 weeks earlier, when the preceding week closed less than 29% above the close 23 weeks earlier. Supporting document available upon request.
3 Morgan Stanley.com. Weekly Warm-up: Payroll Data Supports Our Thesis on Rolling Recession and Recovery. 9/8/25.