Gauging earnings momentum
- SIG surged after Wednesday’s earnings
- Stock in upper portion of nearly five-year range
- Enough momentum to escape consolidation?
A soft day for US stocks on Wednesday didn’t produce many double-digit percentage gainers, but Signet Jewelers (SIG) managed to rally nearly 24% on the back of its latest earnings announcement:
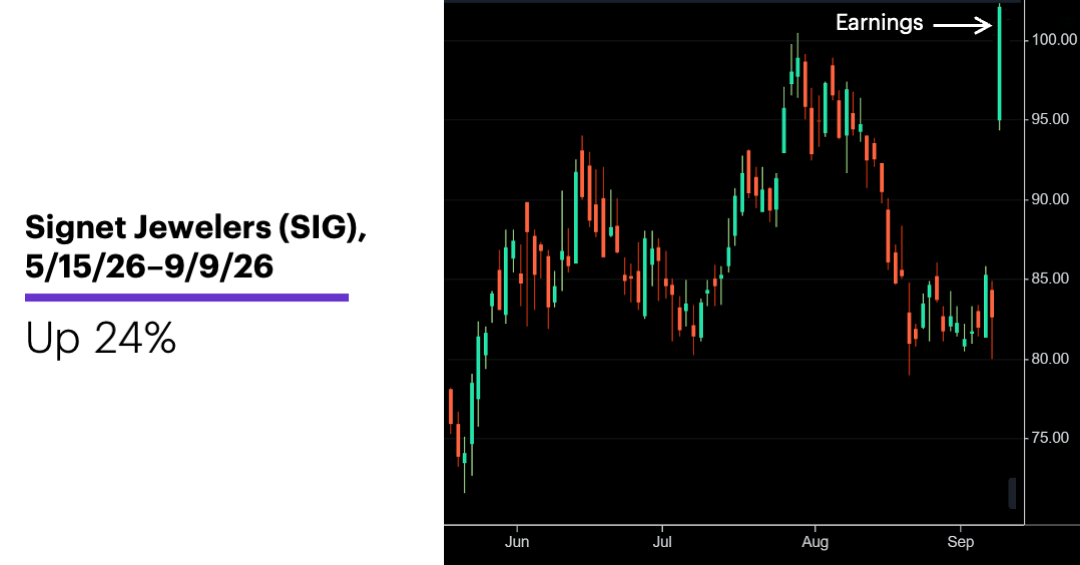
Source: Power E*TRADE. (For illustrative purposes. Not a recommendation.)
While the move propelled the stock to its highest high since December 1, 2025, the long-term chart below shows it didn’t push meaningfully out of the roughly $80-$100 consolidation it’s been in since then, and shares remained well within the approximately $50-$115 range that dates back to late 2021:
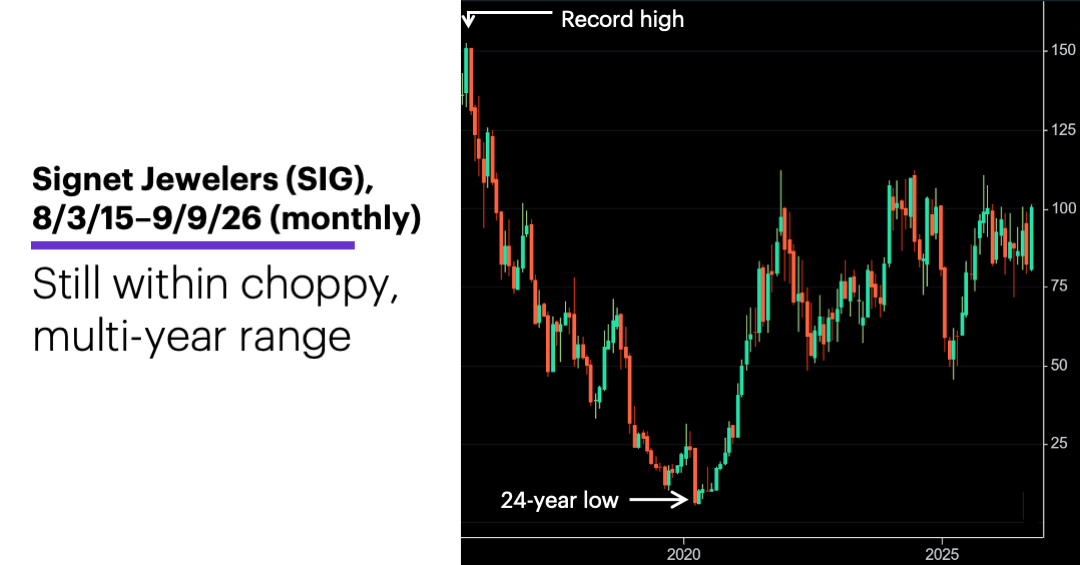
Source: Power E*TRADE Pro. (For illustrative purposes. Not a recommendation.)
Moves like Wednesday’s are far from run of the mill for SIG. The stock has gained 15% or more in a day while also hitting its highest high in at least 20 trading days only 33 other times since 1988. (On Wednesday the stock gained 23.9% while hitting its highest high in at least 190 trading days—something it’s done only four times since 1988.)
Before looking at what SIG did after those 33 other large one-day rallies, it’s helpful to review the stock’s long-term trading history, which has featured some extended bear markets as well as rallies. Since 1988, the stock has ranged from $2.50 (in September 1992) to $152.27 (in August 2015). In June 1988, shares traded mostly in the $80s—not too far below where they are currently. In fact, the stock’s median five-day return since 1988 is 0%—unchanged—while its median 20-day return is 0.6%.1
The following chart shows how SIG performed after the 33 other large up days. The bars represent the median returns for each of the first four five-day periods (day one to day five, day 6 to day 10, etc.), along with the median return for the entire 20 days:
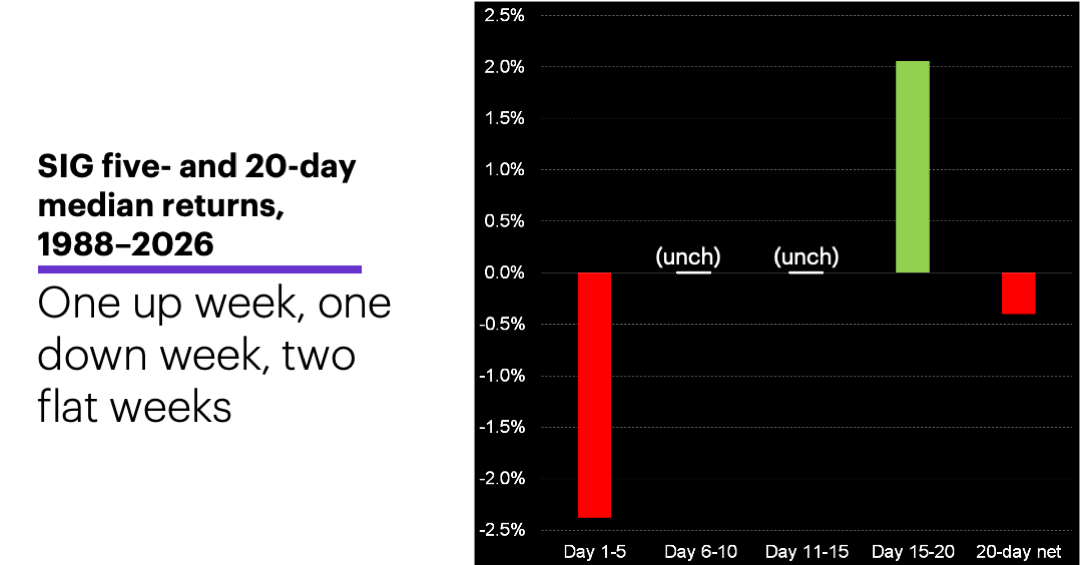
Source: Power E*TRADE Pro. (For illustrative purposes. Not a recommendation.)
The modest (-0.4%) 20-day median decline is the net result of a weak initial five days (-2.4%) after the big up day, followed by two five-day periods with flat median returns and, finally, a +2.1% median return for the final five-day period (day 15-20). In fact, this period was the only one that posted a net gain more often than a loss (19 times out of 33). None of the other five-day periods were positive more than 15 times.
While these short-term performance statistics have nothing to do with the stock’s longer-term prospects, they do highlight a tendency for net weakness in the first month or so after SIG enjoyed a big up day like Wednesday. Whether that tendency will play out this time can’t be known. But when history suggests a certain path for a market, it’s helpful to have an answer to the question, “What’s different this time?” before dismissing its implications.
Market Mover Update: October WTI crude oil futures (CLV6) rallied nearly 4% on Tuesday (topping $96), while global Brent crude oil prices topped $100.
Today’s numbers include (all times ET): weekly jobless claims (8:30 a.m.), Producer Price Index (8:30 a.m.), Existing Home Sales (10 a.m.), EIA Natural Gas Report (10:30 a.m.).
Today’s earnings include: Adobe (ADBE), Designer Brands (DBI), Macy's (M).
Note: The Extended Hours Day session has been updated to begin at 4 a.m. ET, Monday through Friday, for most US-listed securities. Eligible symbols can now be traded 4 a.m. to 8 p.m. ET when selecting "EXT (Day Plus Extended Hours)" in the Duration menu. Learn more.
Click here to log on to your account or learn more about E*TRADE's trading platforms, or follow the Company on X (Twitter), @ETRADE, for useful trading and investing insights.
1 All figures reflect Signet Jewelers (SIG) daily closing prices, 1988-2026. Supporting document available upon request.