New records, new tech bumps
- Stocks mixed despite new highs after Fed rate cut
- Small caps rally, tech struggles
- This week: jobs report, retail sales, quarterly expiration
The stock market got the rate cut it was looking for last week—and posted some new records, too—but still struggled amid another bout of tech-sector weakness.
The market appeared to embrace the Fed’s “hawkish” rate cut last Wednesday—a 0.25% reduction, accompanied by messaging that left future cuts in question—but sell-offs in some high-profile tech names derailed the bullish momentum. The S&P 500 (SPX) closed at a new record high on Thursday, but Friday’s sell-off left the index in the red for the week:
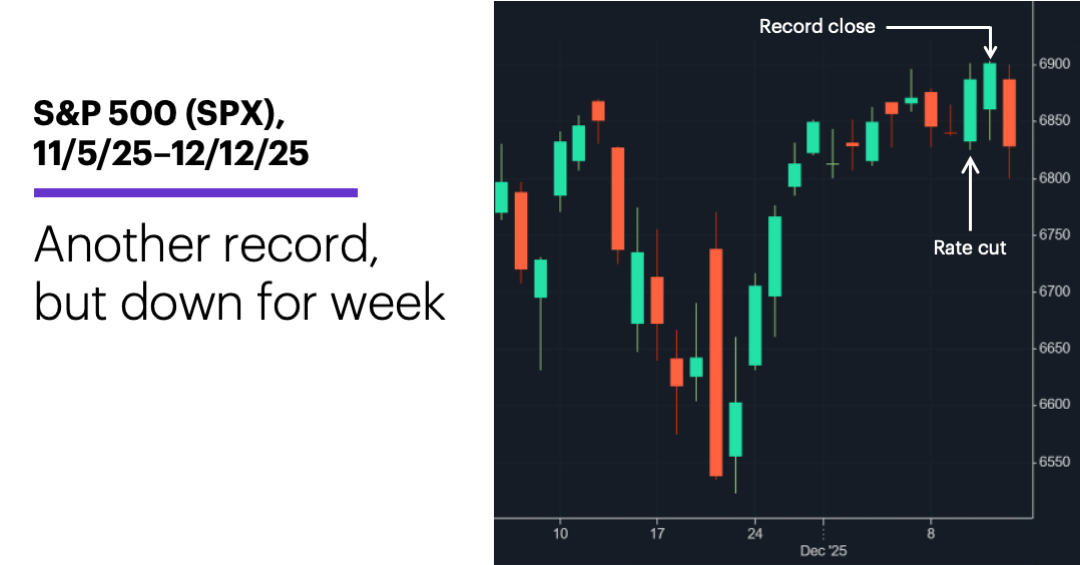
Source: Power E*TRADE. (For illustrative purposes. Not a recommendation. Note: It is not possible to invest in an index.)
The headline: AI volatility reins in bulls.
The fine print: It was no coincidence that the Nasdaq 100 (NDX) and the SPX—the two indexes with the most exposure to megacap AI stocks—were last week’s underperformers. Post-earnings sell-offs by Oracle (ORCL) and Broadcom (AVGO) on Thursday and Friday appeared to refresh concerns about a potentially overextended AI trade, and tech followed its leaders to the downside.
The number: 5, the number of “Magnificent 7” stocks that were underperforming the SPX for the year as of Friday. Alphabet (GOOGL) and NVIDIA (NVDA) were the only two outperforming the index. Runner-up: 24.4%, the odds (on Friday) of another Fed rate cut in January.2
The scorecard: The Russell 2000 (RUT) small-cap index led the market, and it continued to make a run at the SPX for the year’s second-strongest return:
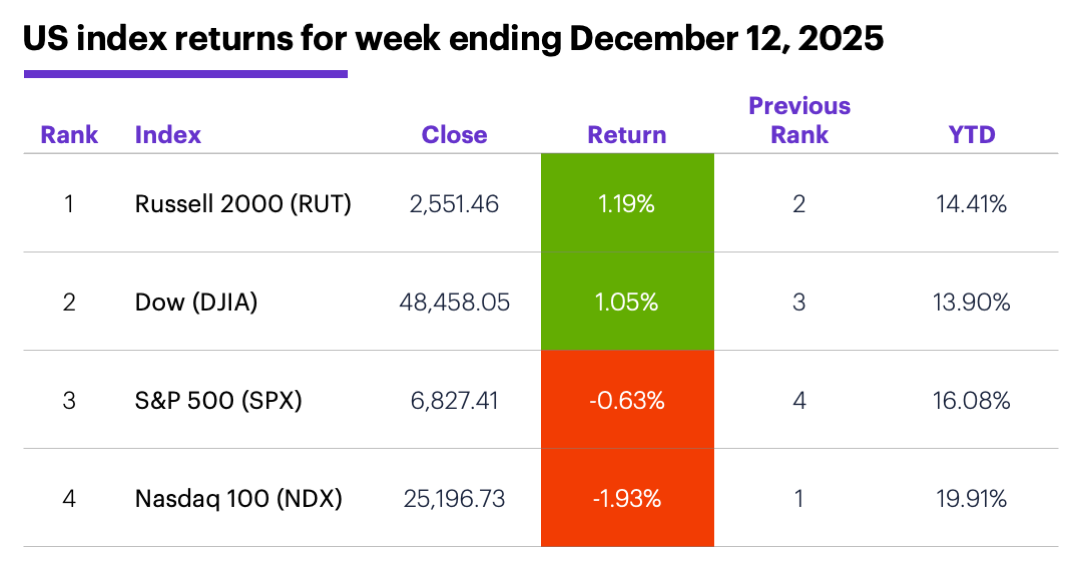
Source (data): Power E*TRADE. (For illustrative purposes. Not a recommendation.)
Sector returns: The strongest S&P 500 sectors last week were materials (+2.4%), financials (+2.3%), and industrials (+1.4%). The weakest sectors were communication services (-3.2%), tech (-2.3%), and utilities (-1.1%).
Stock moves: Structure Therapeutics (GPCR) +102% to $69.98 on Monday, Photronics (PLAB) +45% to $37.35 on Wednesday. Phreesia (PHR) -23% to $15.43 on Tuesday, Lakeland Industries (LAKE) -39% to $9.16 on Wednesday.
Yields and the dollar: The 10-year US Treasury yield climbed 0.05% to 4.19% last week. The US Dollar Index (DXY) fell 0.59 to 98.40.
Futures: February gold (GCG6) hit a seven-week intraday high on Friday and ended the week up $85.30 to $4,328.30. February WTI crude oil (CLG6) closed Friday at a seven-week low, down $2.54 to $57.24 for the week. Biggest rallies: January orange juice (OJF6) +12%, March cocoa (CCH6) +10.2%. Biggest declines: January natural gas (NGF6) -22.2%, March oats (ZOH6) -7.3%.
This week's highlights
Because the government is still playing catchup from the October-November shutdown, traders are getting a busy—and unique--week of economic data, highlighted by the monthly jobs report (on a Tuesday), retail sales (twice), CPI, and the PCE Price Index:
●Monday: Empire State Manufacturing Index, NAHB Housing Market Index
●Tuesday: Employment Report, Retail Sales (October), Housing Starts and Building Permits
●Wednesday: Retail Sales (November)
●Thursday: Consumer Price Index (CPI), Philly Fed Survey, Leading Economic Indicators Index
●Friday: Existing Home Sales, Michigan Consumer Sentiment, PCE Price Index, Personal Income and Spending, "quadruple witching" expiration
This week’s earnings include:
●Monday: Heico (HEI)
●Tuesday: Enerpac Tool (EPAC), Lennar (LEN), Steelcase (SCS), Worthington (WOR)
●Wednesday: Cintas (CTAS), General Mills (GIS), Jabil (JBL), Micron (MU), Paychex (PAYX), Worthington Steel (WS)
●Thursday: Accenture (ACN), Carnival (CCL), Darden Restaurants (DRI), FedEx (FDX), CarMax (KMX), Nike (NKE)
●Friday: Conagra Brands (CAG), Lamb Weston (LW), Winnebago (WGO)
Check the Active Trader Commentary each morning for an updated list of earnings announcements, IPOs, economic reports, and other market events.
Peaking beneath the “sector hood”
Traders and investors often consult sector performance to get a better understanding of sources of market momentum, but delving one level deeper offers some surprising insights into what’s moving in the market.
For example, despite its recent setbacks, tech is the SPX’s second-strongest sector for the year (trailing communication services). What may raise some eyebrows is that electronic equipment is actually its strongest industry group—up 49.2% for year, roughly eight percentage points more than the high-profile semiconductor industry.
In the recently reviving health care sector, big pharma has been all over the news in recent months because of developments on the weight-loss drug front. But as of Friday, biotech was neck and neck with pharma (20.7% vs. 21.3%). Morgan Stanley & Co. recently published its 2026 biotech outlook, highlighting potential tailwinds as policy uncertainty surrounding the industry eases.2
Finally, while materials is only the SPX’s seventh-strongest sector this year, it boasts the runaway industry leader—metals and mining, up 72.5% as of Friday as it rides record-setting rallies in precious metals.
Click here to log on to your account or learn more about E*TRADE's trading platforms, or follow the Company on X (Twitter), @ETRADE, for useful trading and investing insights.
1 CMEGroup.com. FedWatch. 12/12/25.
2 MorganStanley.com. 2026 Outlook: Policy in the rearview, fundamentals in the driver’s seat. 12/11/25.