Tapping into oil volatility history
- Tuesday marked biggest two-day oil rally since 2022
- Fewer than 60 similar moves in past 40 years
- Near-term price declines more common than increases
Given crude oil’s crucial role in the global economy, it’s not an exaggeration to say that the recent market volatility has implications far beyond the screens of energy futures and stock traders.
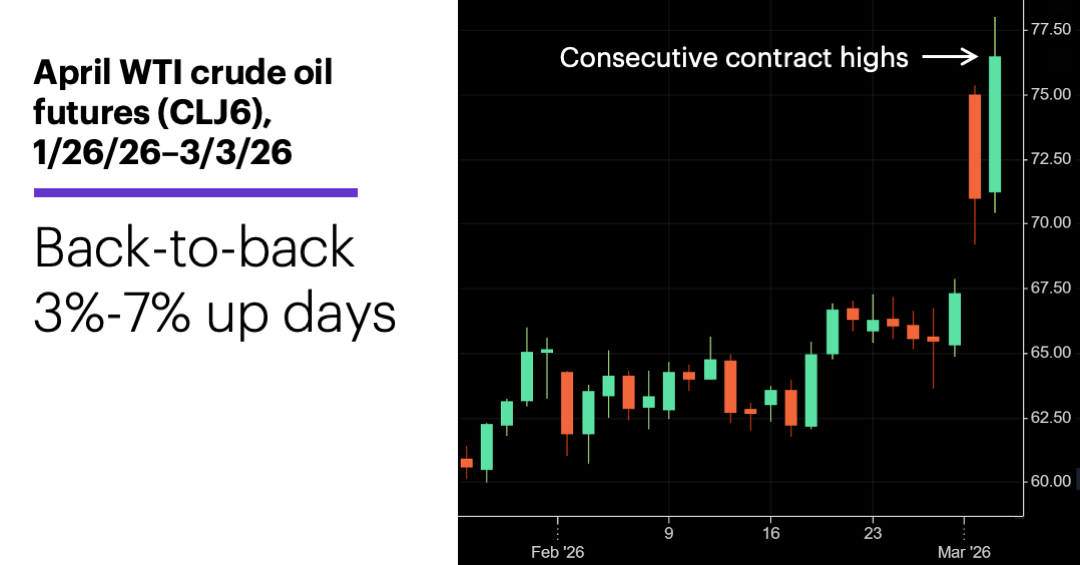
US oil prices started this week by jumping to their highest level since last August, and extended the surge on Tuesday. April WTI crude oil futures (CLJ6) rallied just shy of $78 on Tuesday—more than $10 above where they closed last Friday:
Source: Power E*TRADE. (For illustrative purposes. Not a recommendation.)
Although later in the day prices briefly dropped below $72 (when the White House announced the US Navy would escort ships through the Strait of Hormuz), the market rebounded to close up more than 4%. Following Monday's 6.3% gain, it was the first time since 2022 that oil jumped 3%-7% on consecutive days, and just the 55th time overall since 1986.1
The following chart shows the composite trajectory of crude oil prices after these two-day surges, mapping the average percentage price change from the close of the second 3%-7% up day to the closes of the next 20 trading days (roughly one month). The quick takeaways are that the average return after 20 days was negative, and the the average decline peaked after nine days:

Source: Power E*TRADE. (For illustrative purposes. Not a recommendation.)
Overall, crude closed lower 38 of 55 times on the day after the two-day surges (69% of the time), 34 times after five days (62%), 32 times after 10 days (58%), 31 times after 15 days (56%), and 28 times after 20 days (51%).
Morgan Stanley & Co. energy strategists recently noted that the current situation in the Middle East appeared most aligned with their “Scenario 4,” characterized by a significant Iranian counter-response that “uses maritime leverage in the Gulf without attempting a full closure of the Strait of Hormuz.” Commercial traffic would likely continue, they note, but at a “slower pace.” This scenario implies reduced global crude exports, which the analysts estimate to represent a supply loss of two to three million barrels per day for several weeks, with price action resembling early 2022 (when prices rallied before and after Russia’s invasion of Ukraine), “although likely to last significantly shorter.”2
A final observation: Some traders may have expected oil prices to sell off quickly after Monday’s surge, similar to the way they did in January 1991 after the beginning Operation Desert Storm, the US military offensive launched in response to Iraq’s invasion of Kuwait. Oil prices dropped 33% on January 17, the first day of the initiative.
The key difference between that episode and the current one is that it was Iraq’s August 2, 1990 invasion of Kuwait that triggered uncertainty in the energy market and sent oil prices skyrocketing as much as 73% over the next 10 weeks. Operation Desert Storm was seen as the beginning of the end of that uncertainty. By contrast, last weekend’s US-Israeli strikes on Iran marked the beginning of the current uncertainty cycle, not the end of it.
Market Mover Update: Morgan Stanley & Co. strategists also point out that most geopolitical shocks have also had limited impact on the stock market—although every situation is, of course, unique. Their analysis showed that the S&P 500’s average one-month return after such events was 2%, while its average six-month return was 6%. But they also acknowledged a more bearish scenario in the event oil prices rise “sharply/persistently, thereby posing a risk to the duration of the business cycle.” But their work also suggests oil prices would need to surge at least 75%-100% on a year-over-year basis, which currently translates into prices above $100.3
Today’s numbers include (all times ET): mortgage applications (7 a.m.), ADP Private Employment Report (8:15 a.m.), ISM Services Index (10 a.m.), EIA Petroleum Status Report (10:30 a.m.), Beige Book (2 p.m.).
Today’s earnings include: Abercrombie & Fitch (ANF), Broadcom (AVGO), Burlington Stores (BURL), Cracker Barrel (CBRL), Dycom (DY), Macy's (M), Wix.com (WIX).
Click here to log on to your account or learn more about E*TRADE's trading platforms, or follow the Company on Twitter, @ETRADE, for useful trading and investing insights.
1 Refers to consecutive days the US spot (cash) crude oil price closed up at least 3% but less than 7% (after a day that didn’t close that much higher). Supporting document available upon request.
2 MorganStanley.com. Iran Scenarios—Updated. 3/2/26.
3 MorganStanley.com. Weekly Warm-up: Cutting Through the Narratives. 3/2/26.