Market Dashboard
New every Monday with last week’s recap and notes on the week ahead.
Last update: 12/8/2025
US equities rose as investors anticipated a December rate cut and a dovish Fed chair appointment. Despite these expectations, Treasury yields increased as global markets braced for Bank of Japan rate hikes. Private sector data suggested labor market softening, but weekly jobless claims fell. Consumer sentiment and inflation expectations improved.
US equities grind higher on dovish hopes
- Ahead of the next Federal Reserve rate decision, investors cheered signs that the Trump administration will soon name a new Fed chair who supports lowering interest rates, fueling dovish market sentiment.
- The S&P 500 Index rose 0.3% for the week, closing at 6,870 on Friday. Year-to-date, the S&P 500 has gained 16.8% and is currently just 0.3% below its all-time high.
- The Nasdaq Composite Index rose 0.9% last week.
- The small-cap Russell 2000 Index advanced 0.8%.
- Trading volume was relatively low during this period.
Fed rate cut expected, but yields rise globally
- Market expectations for a December Federal Reserve rate cut rose to 96% Friday afternoon.
- Despite these dovish expectations, US Treasury yields rose over the week. The two-year yield increased 7 basis points to 3.56%, while the 10-year yield rose 13 basis points to 4.14%.
- The rise in Treasury yields was influenced by expectations that the Bank of Japan might announce rate hikes imminently, leading to a broader increase in global yields.
- The Treasury yield curve steepened due to persistent pressures on the long end, with the 30-year yield rising 13 basis points to 4.79% last week.
- Investment-grade corporate bond spreads are nearing historic lows, indicating a “risk-on” sentiment in the market.
US services activity rises, but concerns linger
- November’s Institute for Supply Management (ISM) surveys highlighted business’ ongoing concerns about tariffs, inflation, weak demand, inconsistent pricing, and general uncertainty.
- The ISM index of US service-sector activity rose to 52.6, the highest since February and above forecasts, but businesses expressed caution about weak new orders and low prices paid. Employment in the sector rose to the highest since May, but remained in contraction territory.
- The ISM manufacturing index, meanwhile, fell to 48.2, below analyst expectations, continuing its decline since October. Manufacturers flagged elevated prices, weaker employment, and a contraction in new orders.
Private payrolls fall, jobless claims show resilience
- ADP private payrolls decreased by 32,000 month-over-month in November, down from a 47,000 gain the previous month, missing analyst expectations for a 10,000 gain. The decline was the largest since early 2023, with small businesses contributing most to the drop.
- A measure of job cuts by outplacement firm Challenger, Gray & Christmas reached its highest level since 2020, with significant layoffs in the telecom and tech sectors.
- Despite these challenges, weekly initial jobless claims fell to 191,000, the lowest level since 2022, and continuing jobless claims, at 1.939 million, were below analyst forecasts.
Consumer prices rise slightly in September
- The personal consumption expenditures (PCE) price index rose 0.3% month-over-month and 2.8% year-over-year in September, slightly above analyst estimates, according to delayed government data.
- Core PCE, which excludes volatile food and energy prices, printed in-line with expectations, rising 0.2% month-over-month and 2.8% year-over-year.
- Personal spending and personal income rose 0.3% and 0.4%, respectively.
Consumer outlook improves in December
- The University of Michigan’s consumer sentiment index showed an improved outlook, rising to a forecast-topping 53.3 in a preliminary December reading.
- Year-ahead inflation expectations fell to 4.1%, the lowest level since January.
- Reports also noted a pickup in job market expectations.
CRC# 5043189 12/2025
How can E*TRADE from Morgan Stanley help?
Playing defense
Find opportunities to invest in companies that may have the ability to weather tough economic times.
Hedging with gold
Discover ways to diversify into a precious metal that many investors consider a potential safe haven when the economy slumps.
Futures
Like options, futures let you lock in a price now for an investment you’ll buy in the future. They cost much less than the actual investment, so you can control a large contract with a relatively small amount of capital.
Certificates of Deposit (CD)
Fixed rates. Annual Percentage Yield up to 1,2
Lock in a competitive fixed rate for terms from to .3
Morgan Stanley Private Bank, Member FDIC.
Cross-Asset Performance Table
Returns and prices of the most popular indices and assets as of 12/5/25.
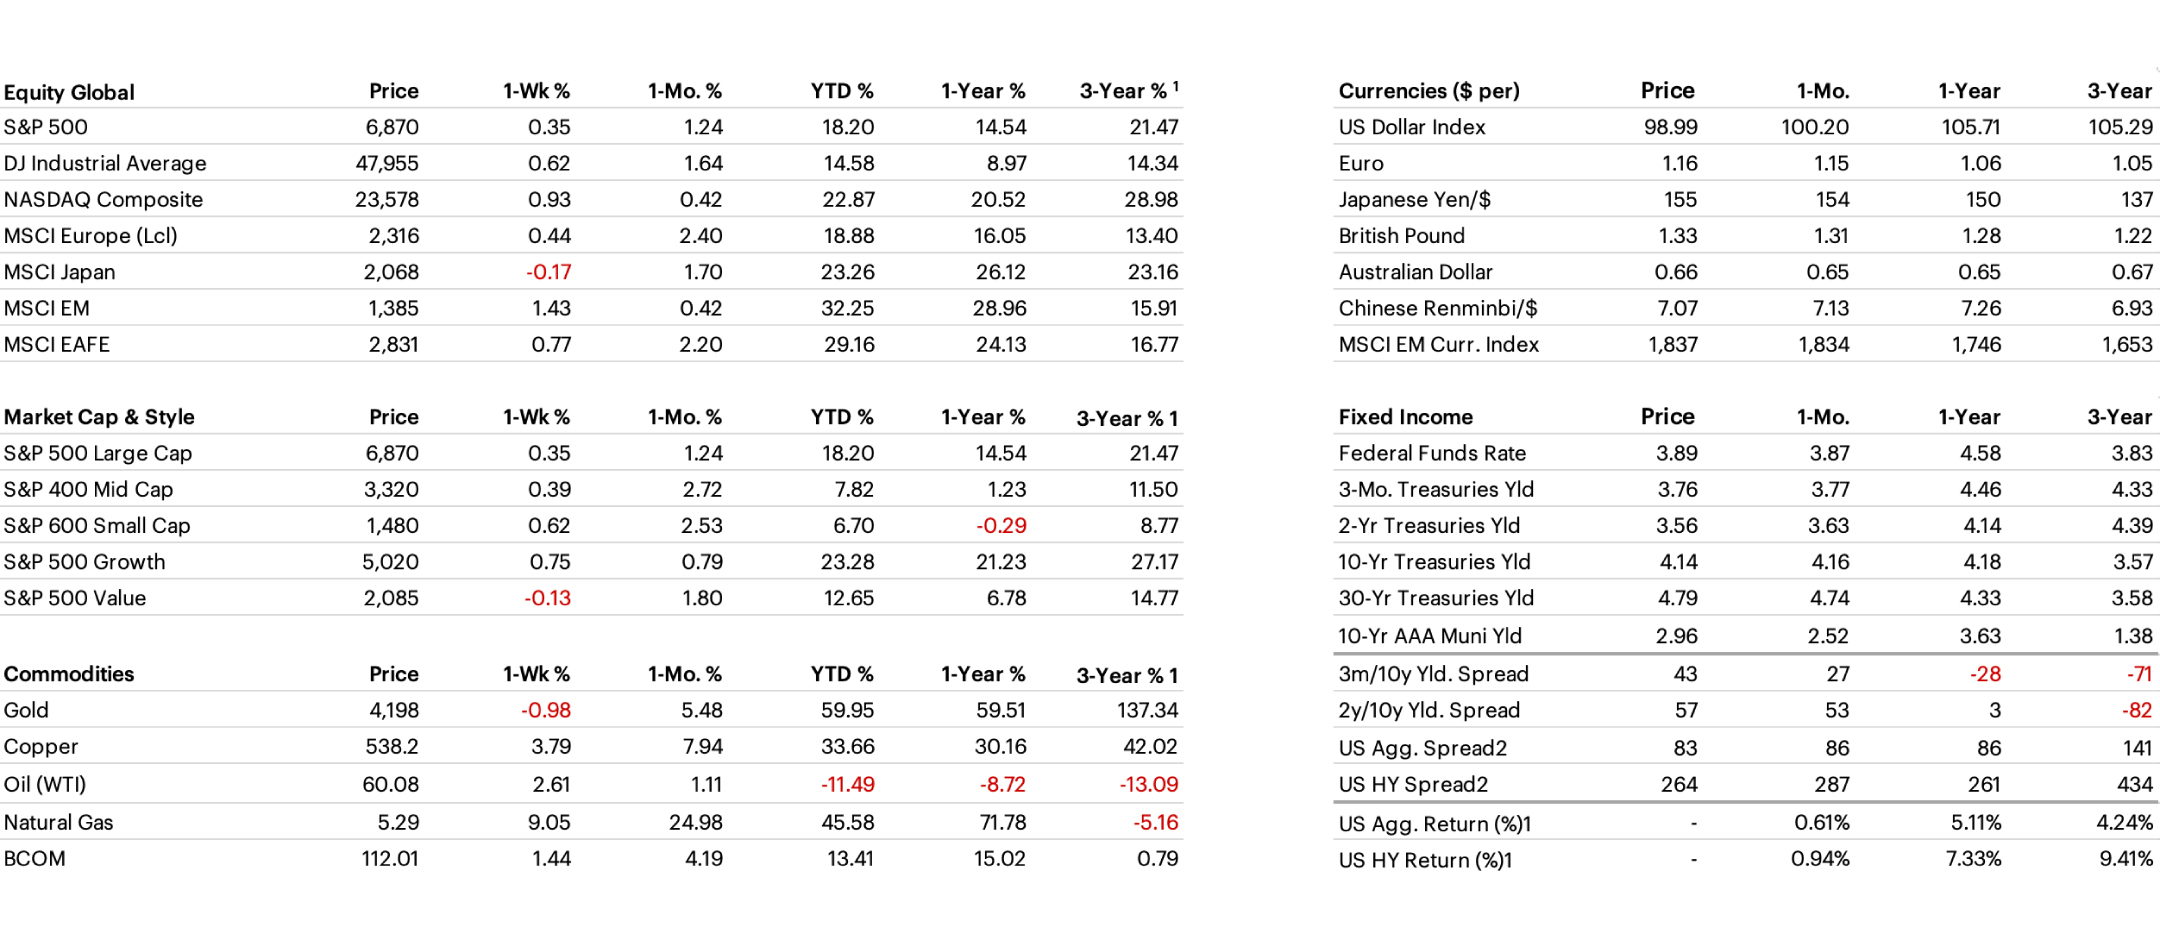
1) Annualized 3-year % return. 2) Option Adjusted Spread (OAS): OAS is a measurement of the spread of a fixed income security rate and the risk-free rate of return, which is adjusted to take into account an embedded option. Equity risk premium is the excess return that an individual stock or the overall stock market provides over a risk-free rate. The risk-free rate represents the interest an investor would expect from an absolutely risk-free investment over a specified period of time. Past performance is not indicative of future results.
S&P 500 Sector Performance
Energy and Information Technology were the strongest-performing S&P 500 sectors last week, while Health Care and Utilities lagged.
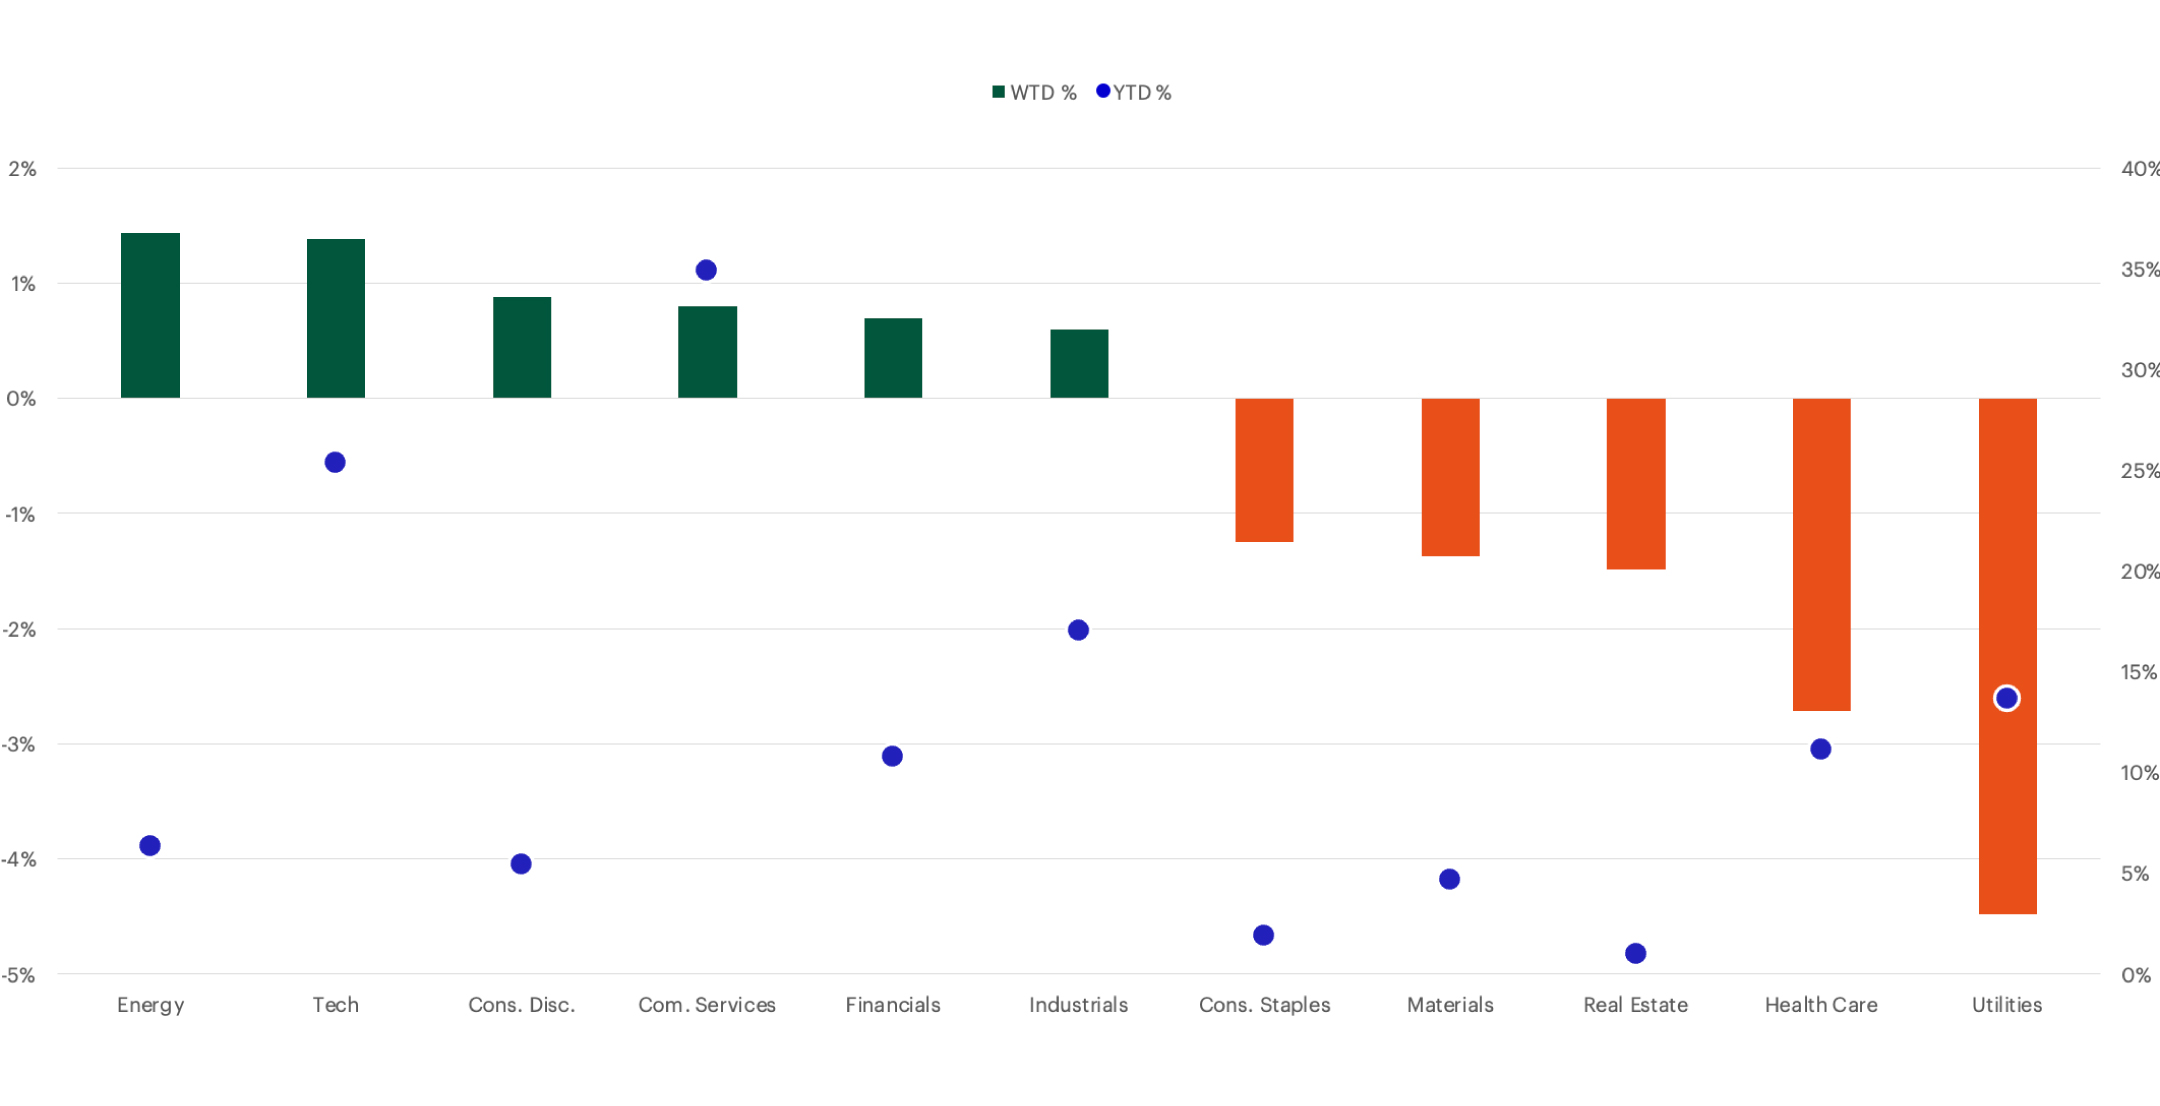
Past performance is not indicative of future results.
Russell US Equity Style Performance
Small-cap stocks outperformed large-cap equities.
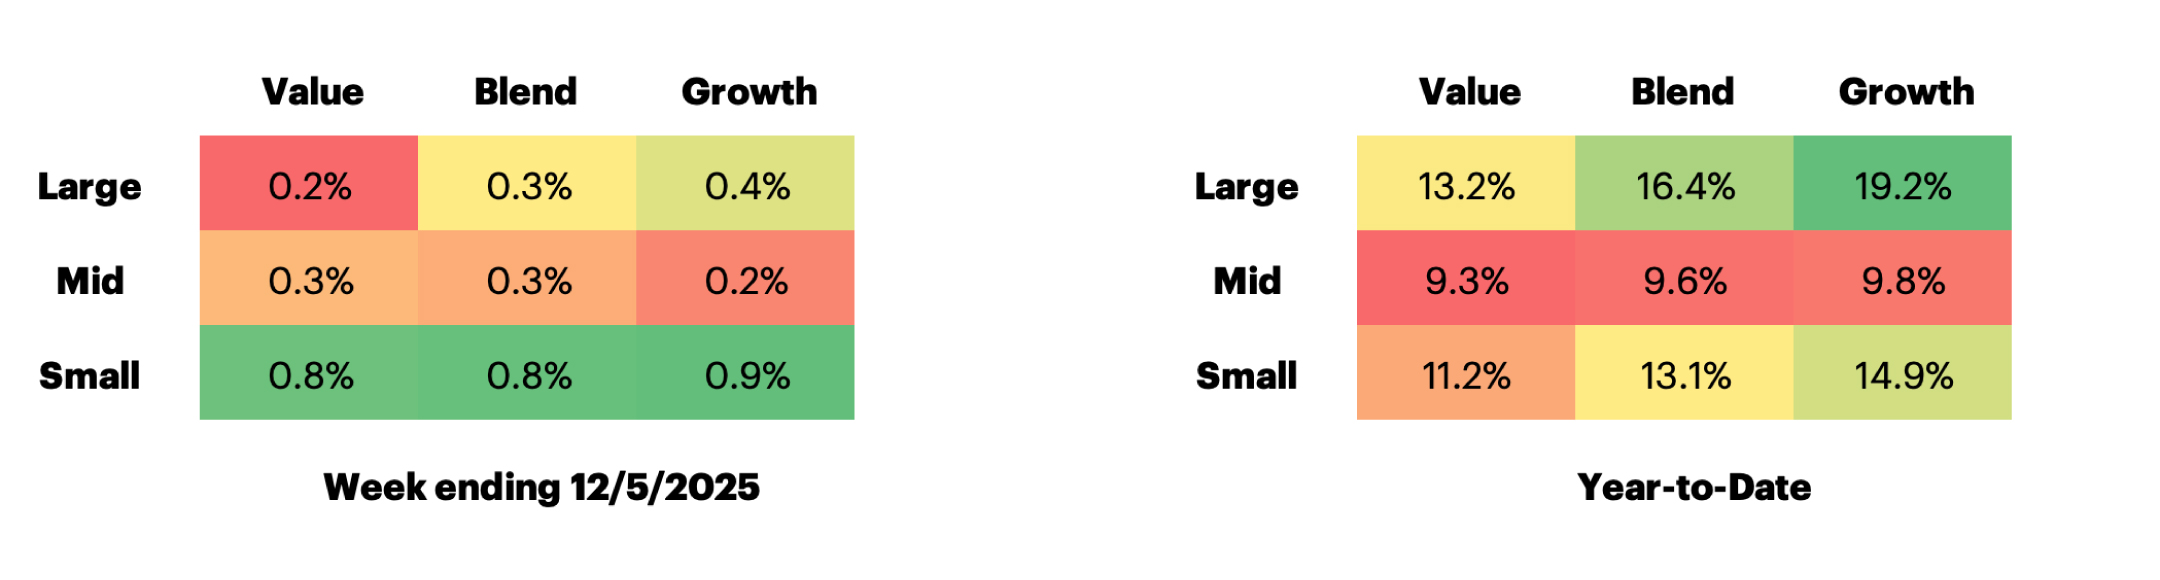
Past performance is not indicative of future results.
US Equity Valuation
S&P 500 Equity Risk Premium
Bonds continue to appear attractive relative to equities.
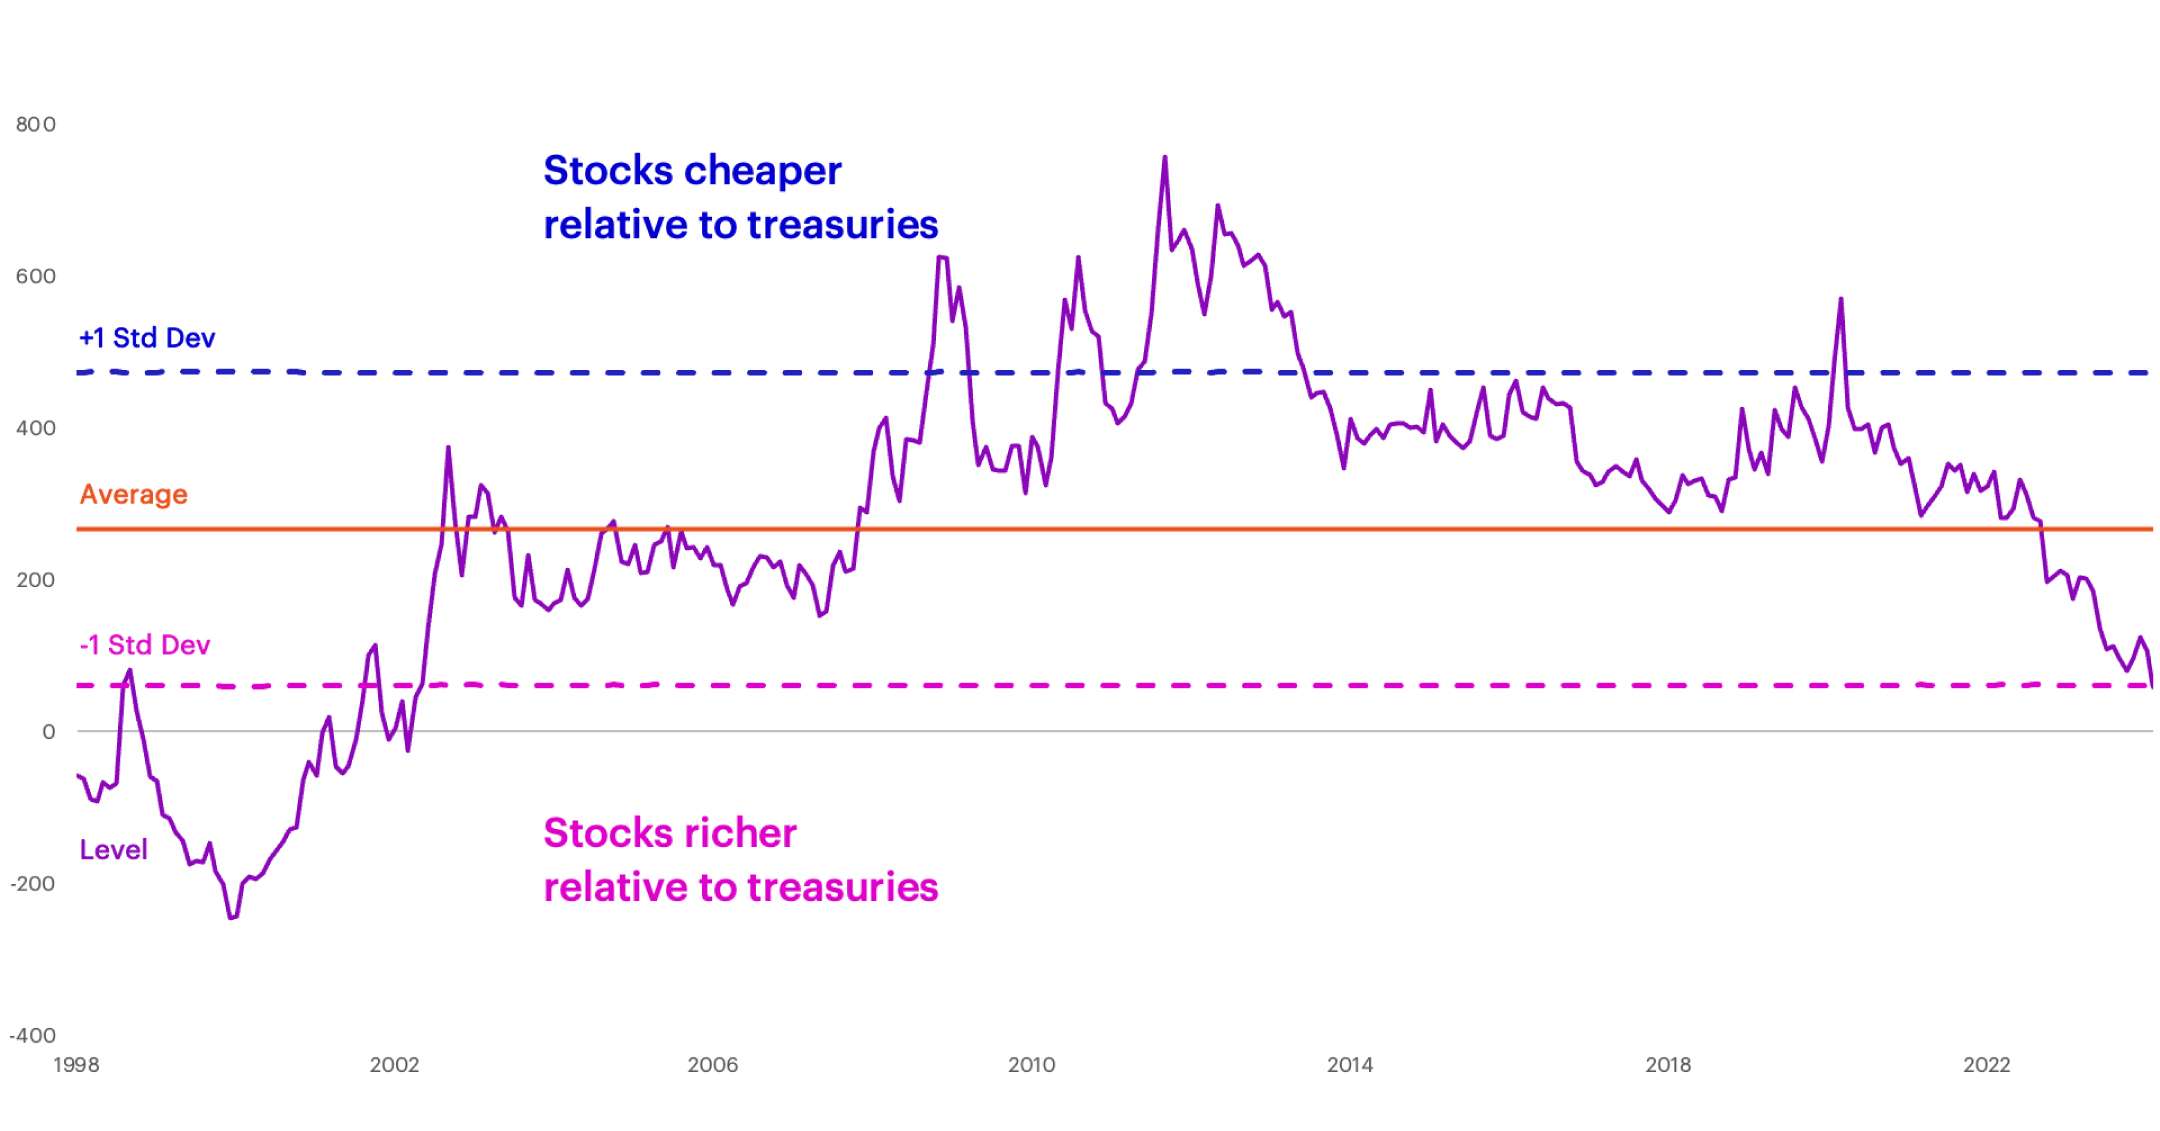
Past performance is not indicative of future results.
P/E Relative to Rest of World
The S&P 500 remains expensive relative to the rest of the world.

Past performance is not indicative of future results.
US Fixed Income Valuation
The two-year US Treasury yield increased 7 bps to 3.56%, while the 10-year yield rose 13 bps to 4.14%.
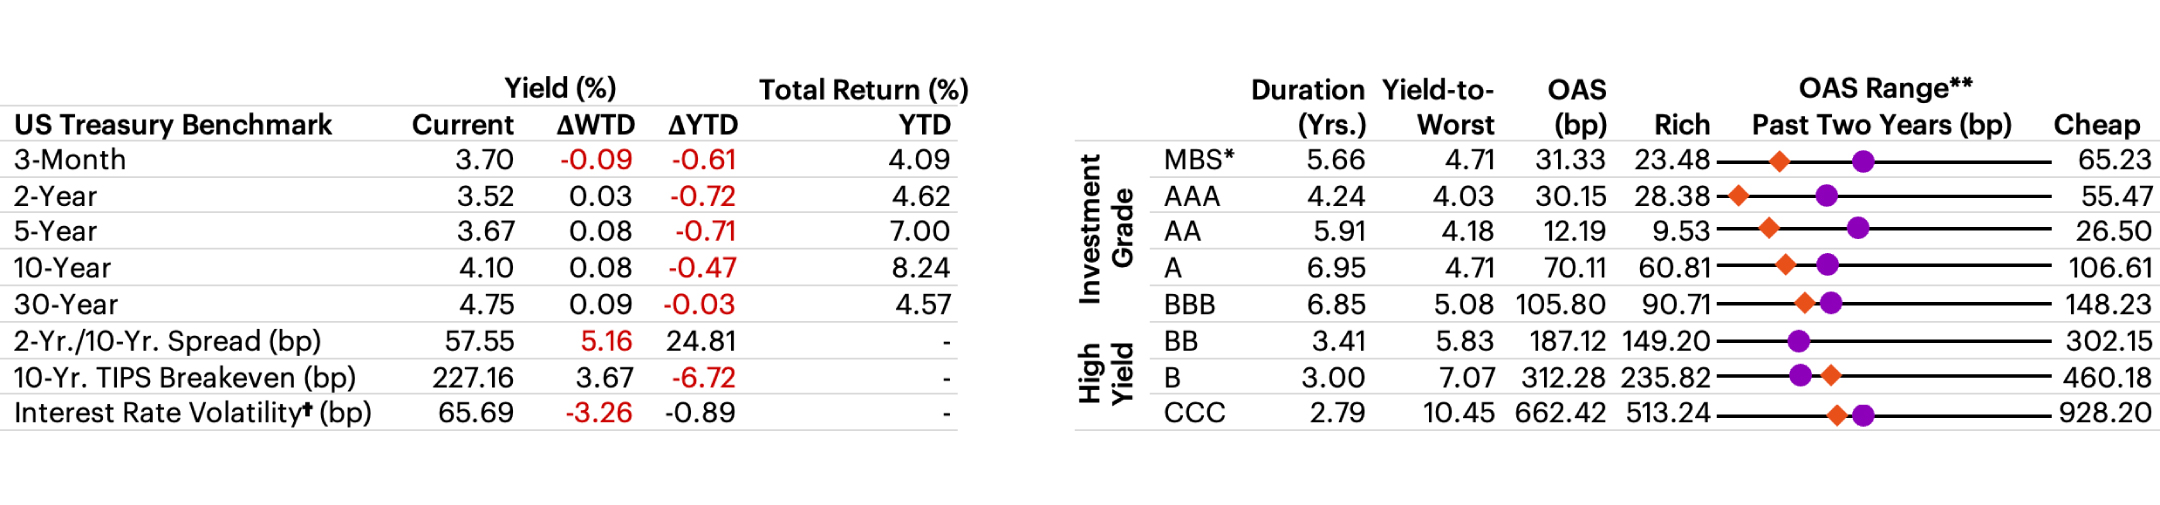
†Interest Rate Volatility as measured by ICE BofAML Option Volatility Estimate Index (MOVE); *Mortgage-backed securities (MBS) are debt obligations that represent claims to the cash flows from pools of mortgage loans, most commonly on residential property. Mortgage loans are purchased from banks, mortgage companies, and other originators and then assembled into pools by a governmental, quasi-governmental, or private entity; **Options Adjusted Spread (OAS): A measurement of the spread of a fixed income security rate and the risk-free rate of return, which is adjusted to take into account an embedded option. Past performance is not indicative of future results.
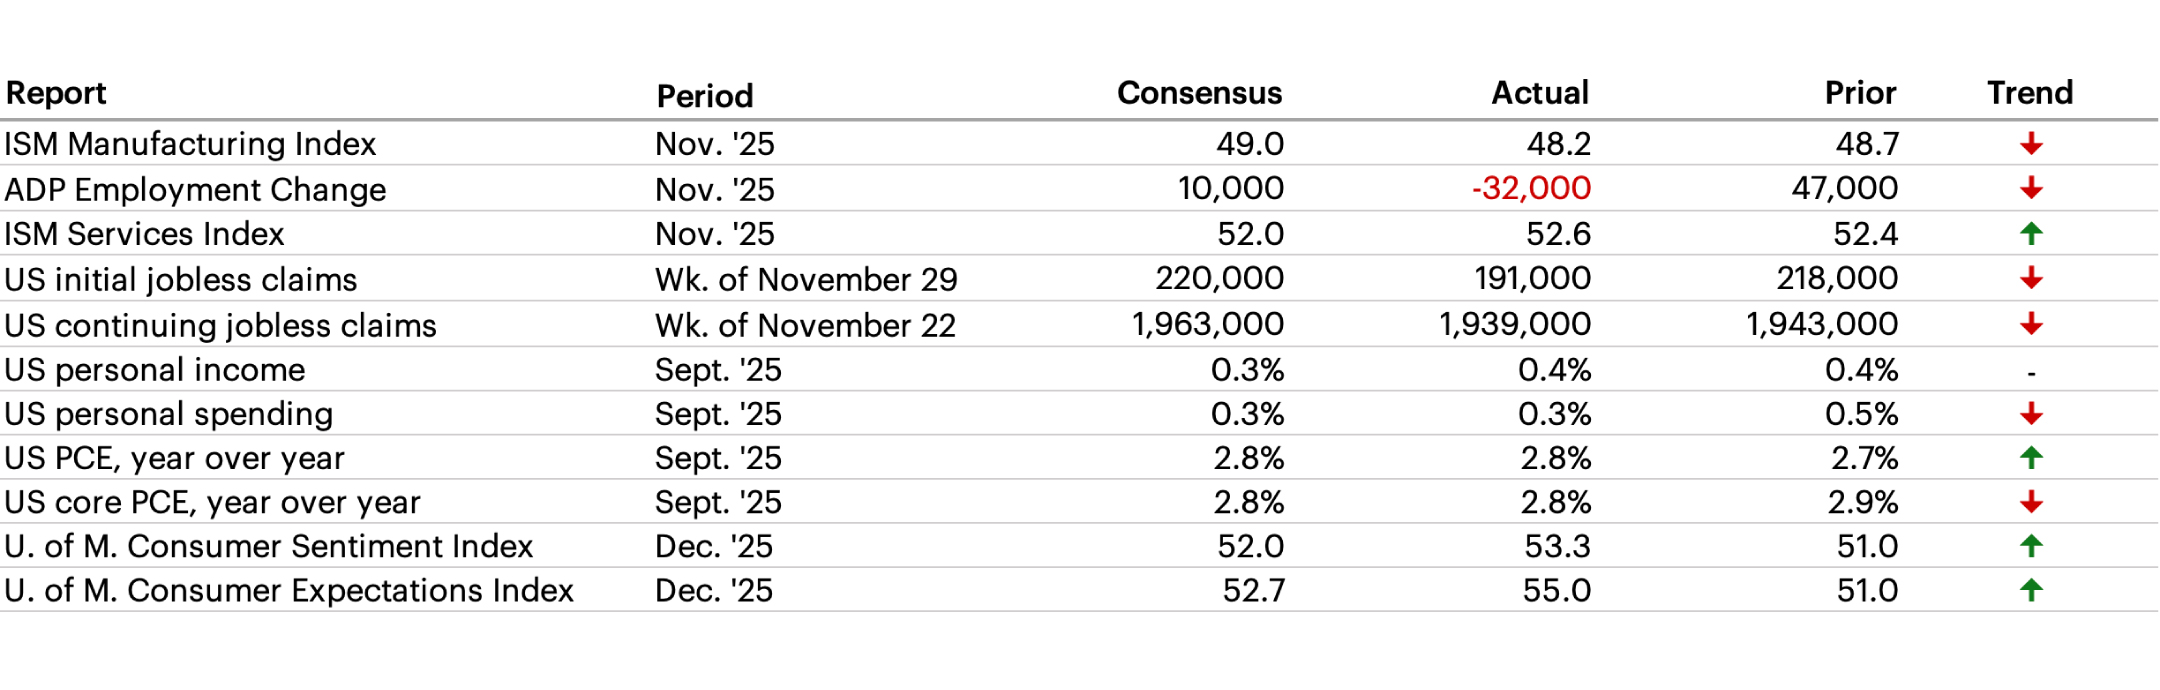
Latest Economic Data
ADP private payrolls fell by 32,000 in November, missing expectations for a 10,000 gain, with small businesses leading the decline. Job cuts hit their highest since 2020, notably in telecom and tech. However, weekly initial jobless claims dropped to 191,000, the lowest since 2022.
The Week Ahead
The Dec. 9-10 FOMC meeting will bring an updated “dot plot” Summary of Economic Projections (SEP). The week ahead will also see the New York Fed’s latest survey of consumer expectations, the National Federation of Independent Business (NFIB) small business optimism survey, the Job Openings and Labor Turnover Survey (JOLTS), and US wholesale inventories data.
- US housing starts at 9:00 AM ET
- US building permits at 9:00 AM ET
- New York Fed One-Year Inflation Expectations Survey at 11:00 AM ET
- NFIB Small Business Optimism Surveys at 6:00 AM ET
- US JOLTS Survey at 10:00 AM ET
- MBA Mortgage Applications at 7:00 AM ET
- US Employment Cost Index at 8:30 AM ET
- Oracle Corporation Reports Earnings
- Adobe Inc. Reports Earnings
- US continuing jobless claims at 8:30 AM ET
- US initial jobless claims at 8:30 AM ET
- US trade balance at 8:30 AM ET
- US wholesale inventories at 10:00 AM ET
- Broadcom Inc. Reports Earnings
Index benchmarks
Cross-Asset Performance
S&P 500: A market capitalization-weighted index of 500 widely held stocks often used as a proxy for the stock market. It measures the movement of the largest issues. Standard and Poor's chooses the member companies for the 500 based on market size, liquidity and industry group representation. Included are the stocks of industrial, financial, utility, and transportation companies. Since mid-1989, this composition has been more flexible and the number of issues in each sector has varied. The returns presented for the S&P 500 are total returns, including the reinvestment of dividends each month.
Dow Jones Industrial Average: Computed by summing the prices of the stocks of 30 companies and then dividing that total by an adjusted value—one which has been adjusted over the years to account for the effects of stock splits on the prices of the 30 companies. Dividends are reinvested to reflect the actual performance of the underlying securities.
NASDAQ Composite: Measures the performance of all issues listed in the NASDAQ Stock Market, except for rights, warrants, units, and convertible debentures. Morningstar reports the NASDAQ Composite as a price return.
MSCI Europe IMI: This index captures large, mid and small cap representation across 16 Developed Markets countries in Europe. With 1,372 constituents, the index covers approximately 99% of the free float-adjusted market capitalization across the Developed Markets countries of Europe.
MSCI Japan IMI: This index is designed to measure the performance of the large, mid and small cap segments of the Japan market. With 1,134 constituents, the index covers approximately 99% of the free float-adjusted market capitalization in Japan.
MSCI EM (Emerging Markets) Index: A free float-adjusted market-capitalization index that is designed to measure equity market performance of emerging markets. The MSCI Emerging Markets Index consists of the following 23 emerging market country indexes: Brazil, Chile, China, Colombia, Czech Republic, Egypt, Greece, Hungary, India, Indonesia, Korea, Malaysia, Mexico, Peru, Philippines, Poland, Qatar, Russia, South Africa, Taiwan, Thailand, Turkey and United Arab Emirates. For more information, visit the MSCI web site.
MSCI EAFE (Europe, Australasia, Far East) Index: A free float-adjusted market-capitalization index that is designed to measure the equity market performance of developed markets, excluding the U.S. and Canada. The MSCI EAFE Index consists of the following 21 developed market country indexes: Australia, Austria, Belgium, Denmark, Finland, France, Germany, Hong Kong, Ireland, Israel, Italy, Japan, the Netherlands, New Zealand, Norway, Portugal, Singapore, Spain, Sweden, Switzerland, and the United Kingdom. For more information, visit the MSCI website.
S&P 400 Index: This index provides investors with a benchmark for mid-sized companies. The index measures the performance of mid-sized companies, reflecting the distinctive risk and return characteristics of this market segment.
S&P 600 Index: This index measures the small-cap segment of the U.S. equity market. The index is designed to track companies that meet specific inclusion criteria to ensure that they are liquid and financially viable.
S&P 500 Growth: This index is a style-concentrated index designed to track the performance of stocks that exhibit the strongest growth characteristics by using a style-attractiveness-weighting scheme.
S&P 500 Value: This index is a style-concentrated index designed to track the performance of stocks that exhibit the strongest value characteristics by using a style-attractiveness-weighting scheme.
Bloomberg Commodity Index: Made up of 22 exchange-traded futures on physical commodities. The index currently represents 20 commodities, which are weighted to account for economic significance and market liquidity.
US Trade-Weighted Dollar Index: A weighted average of the foreign exchange value of the US dollar against a subset of the broad index currencies that circulate widely outside the US.
MSCI Emerging Markets Currency Index: sets the weights of each currency equal to the relevant country weight in the MSCI Emerging Markets Index.
Bloomberg US Aggregate Index: The US Aggregate Index covers the dollar-denominated investment-grade fixed-rate taxable bond market, including Treasuries, government-related and corporate securities, MBS pass-through securities, asset-backed securities, and commercial mortgage-based securities. These major sectors are subdivided into more specific sub-indices that are calculated and published on an ongoing basis. Total return comprises price appreciation/depreciation and income as a percentage of the original investment. This index is rebalanced monthly by market capitalization.
Bloomberg US Corporate High Yield Bond Index: This index is composed of fixed-rate, publicly issued, non-investment grade debt.
S&P Sector Performance
The S&P 500 Consumer Discretionary sector comprises those companies included in the S&P 500 that are classified as members of the consumer discretionary sector.
The S&P 500 Consumer Staples sector comprises those companies included in the S&P 500 that are classified as members of the consumer staples sector.
The S&P 500 Energy sector comprises those companies included in the S&P 500 that are classified as members of the energy sector.
The S&P 500 Financials sector comprises those companies included in the S&P 500 that are classified as members of the financial sector.
The S&P 500 Health Care sector comprises those companies included in the S&P 500 that are classified as members of the health care sector.
The S&P 500 Industrials Sector comprises those companies included in the S&P 500 that are classified as members of the industrials sector.
The S&P 500 Information Technology Sector comprises those companies included in the S&P 500 that are classified as members of the information technology sector.
The S&P 500 Materials Sector comprises those companies included in the S&P 500 that are classified as members of the materials sector.
The S&P 500 Communications Services Sector comprises those companies included in the S&P 500 that are classified as members of the telecommunications services sector.
The S&P 500 Utilities Sector comprises those companies included in the S&P 500 that are classified as members of the utilities sector.
The S&P 500 Real Estate Sector comprises those companies included in the S&P 500 that are classified as members of the real estate sector.
US Equity Style Performance
Weekly and monthly style performance charts use Russell 1000, Russell Mid Cap, and Russell 2000 style indexes to represent large cap, mid cap, and small cap respectively.
Russell 1000: Consists of the 1000 largest companies within the Russell 3000 index. Also known as the Market-Oriented Index, because it represents the group of stocks from which most active money managers choose. The returns we publish for the index are total returns, which include reinvestment of dividends. Frank Russell Company reports its indexes as one-month total returns.
Russell 1000 Growth: Market-capitalization weighted index of those firms in the Russell 1000 with higher price-to-book ratios and higher forecasted growth values. The Russell 1000 includes the largest 1000 firms in the Russell 3000, which represents approximately 98% of the investable US equity market.
Russell 1000 Value: Market-capitalization weighted index of those firms in the Russell 1000 with lower price-to-book ratios and lower forecasted growth values. The Russell 1000 includes the largest 1000 firms in the Russell 3000, which represents approximately 98% of the investable US equity market.
Russell 2000: Consists of the smallest 2000 companies in the Russell 3000 Index, representing approximately 7% of the Russell 3000 total market capitalization. The returns we publish for the index are total returns, which include reinvestment of dividends.
Russell 2000 Growth: Market-weighted total return index that measures the performance of companies within the Russell 2000 Index having higher price-to-book ratios and higher forecasted growth values. The Russell 2000 Index includes the 2000 firms from the Russell 3000 Index with the smallest market capitalizations. The Russell 3000 Index represents 98% of the of the investable US equity market.
Russell 2000 Value: Market-weighted total return index that measures the performance of companies within the Russell 2000 Index having lower price-to-book ratios and lower forecasted growth values. The Russell 2000 Index includes the 2000 firms from the Russell 3000 Index with the smallest market capitalizations. The Russell 3000 Index represents 98% of the of the investable US equity market.
Russell Midcap: Measures the performance of the 800 smallest companies in the Russell 1000 Index, which represent approximately 25% of the total market capitalization of the Russell 1000 Index. As of the latest reconstitution, the average market capitalization was approximately $4.0 billion; the median market capitalization was approximately $2.9 billion. The largest company in the index had an approximate market capitalization of $12 billion.
Russell Midcap Growth: Market-weighted total return index that measures the performance of companies within the Russell Midcap Index having higher price-to-book ratios and higher forecasted growth values. The Russell Midcap Index includes firms 201 through 1000, based on market capitalization, from the Russell 3000 Index. The Russell 3000 Index represents 98% of the of the investable U.S. equity market.
Russell Midcap Value: Market-weighted total return index that measures the performance of companies within the Russell Midcap Index having lower price-to-book ratios and lower forecasted growth values. The Russell Midcap Index includes firms 201 through 1000, based on market capitalization, from the Russell 3000 Index. The Russell 3000 Index represents 98% of the of the investable U.S. equity market.
P/E Relative to Rest of World
TOPIX: This free-floated-adjusted index tracks all domestic companies of the exchange’s First Section.
US Fixed Income Valuation
ICE BofAML Option Volatility Estimate Index (MOVE): A yield curve-weighted index of the normalized implied volatility on one-month treasury option.
An investment cannot be made directly in a market index.