Market Dashboard
New every Monday with last week’s recap and notes on the week ahead.
Last update: 07/13/2026
Stocks rose as investors looked past renewed U.S.-Iran hostilities. Bonds weakened as Treasury yields rose on inflation concerns and a more cautious Federal Reserve tone. Oil and gasoline prices rose, gold fell, bitcoin climbed, and the U.S. dollar was flat. Economic data showed services activity still expanding and inflation expectations firming.
Stocks advance despite geopolitical risk
- U.S. equities advanced over the week as investors largely looked past renewed hostilities between the U.S. and Iran and regained confidence in stocks that have recently driven market gains.
- The S&P 500 Index rose 1.2% over the week to 7,575, just below its June 2 peak of 7,610.
- The Nasdaq Composite Index gained 1.7%.
- The small-cap Russell 2000 Index retreated 0.6%.
Oil and bitcoin rise as gold falls
- Oil prices edged higher as geopolitical uncertainty increased. Brent crude oil ended the week near $76 per barrel, while gasoline rose to $3.90 per gallon.
- Gold fell to $4,100 per ounce.
- Bitcoin rose near $64,000.
- The U.S. dollar was unchanged over the week.
Treasury yields rise on inflation concerns
- U.S. Treasury yields moved higher as investors focused on sticky inflation, stronger-than-expected economic growth and a more cautious Federal Reserve policy backdrop.
- The two-year Treasury yield increased 7 basis points to 4.21% over the week, while the 10-year Treasury yield rose 9 basis points to 4.57%.
- Higher yields can make borrowing more expensive and may pressure stock valuations.
Federal Reserve minutes signal caution
- Minutes from the June 17–18 Federal Open Market Committee meeting showed a more cautious policy tone.
- Federal Reserve officials remained divided on whether rates should end 2026 above or below current levels.
- Officials also disagreed on whether current supply shocks would fade or create more lasting inflation pressure.
- As of Friday afternoon, federal funds futures pointed to the equivalent of 1.5 rate hikes of 25 basis points each by December 2026.
Services activity slows but keeps expanding
- June’s Institute for Supply Management Services Index showed U.S. services activity continuing to grow, matching analyst expectations at 54.0, though it slipped modestly from the prior month. (A reading above 50 signals expansion.)
- New Orders remained in expansion territory but slowed slightly from May.
- Employment returned to expansion for the first time in four months.
- Pricing pressure showed signs of easing, with the Prices Paid component falling below 70 for the first time since February.
Inflation expectations rise among consumers
- June’s Federal Reserve Bank of New York Survey of Consumer Expectations showed somewhat firmer inflation expectations.
- Median year-ahead inflation expectations rose to 3.7%, the highest level since September 2023. Three-year inflation expectations increased to 3.3%. Five-year inflation expectations were unchanged at 3.0%.
- Labor market views improved, with respondents seeing a lower chance of higher unemployment and personal job loss over the next year.
- Respondents also became more confident about finding a new job if they became unemployed.
CRC# 5741824 (07/2026)
How can E*TRADE from Morgan Stanley help?
Undervalued large firms
Consider putting your money in large companies whose stocks may be underpriced based on the principles of value investing.
Hedging with gold
Discover ways to diversify into a precious metal that many investors consider a potential safe haven when the economy slumps.
Futures
Like options, futures let you lock in a price now for an investment you’ll buy in the future. They cost much less than the actual investment, so you can control a large contract with a relatively small amount of capital.
Certificates of Deposit (CD)
Lock in a competitive fixed rate up to Annual Percentage Yield1,2 with a Bank CD account
Available terms from to . Plus, no minimums or monthly account fees3
Morgan Stanley Private Bank, Member FDIC.
Cross-Asset Performance Table
Returns and prices of the most popular indices and assets as of 07/10/26.
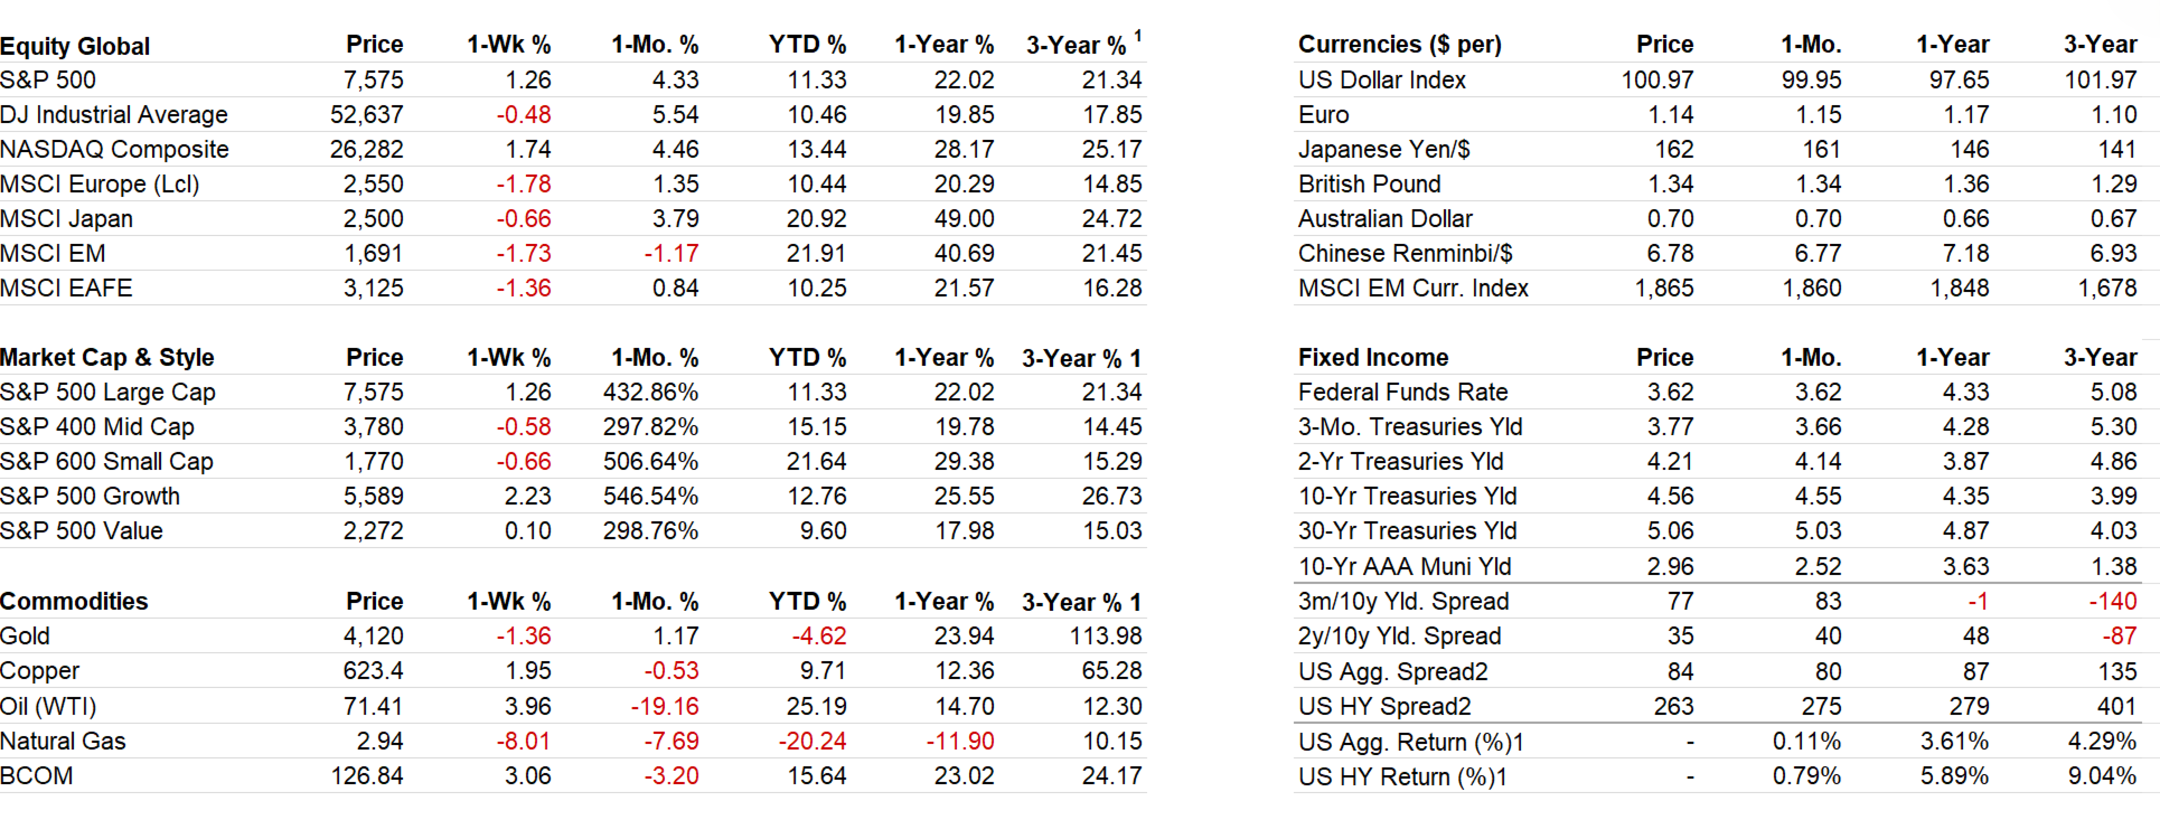
1) Annualized 3-year % return. 2) Option Adjusted Spread (OAS): OAS is a measurement of the spread of a fixed income security rate and the risk-free rate of return, which is adjusted to take into account an embedded option. Equity risk premium is the excess return that an individual stock or the overall stock market provides over a risk-free rate. The risk-free rate represents the interest an investor would expect from an absolutely risk-free investment over a specified period of time. Past performance is not indicative of future results.
S&P 500 Sector Performance
Information Technology and Energy were the strongest S&P 500 sectors last week, while Materials and Health Care lagged.
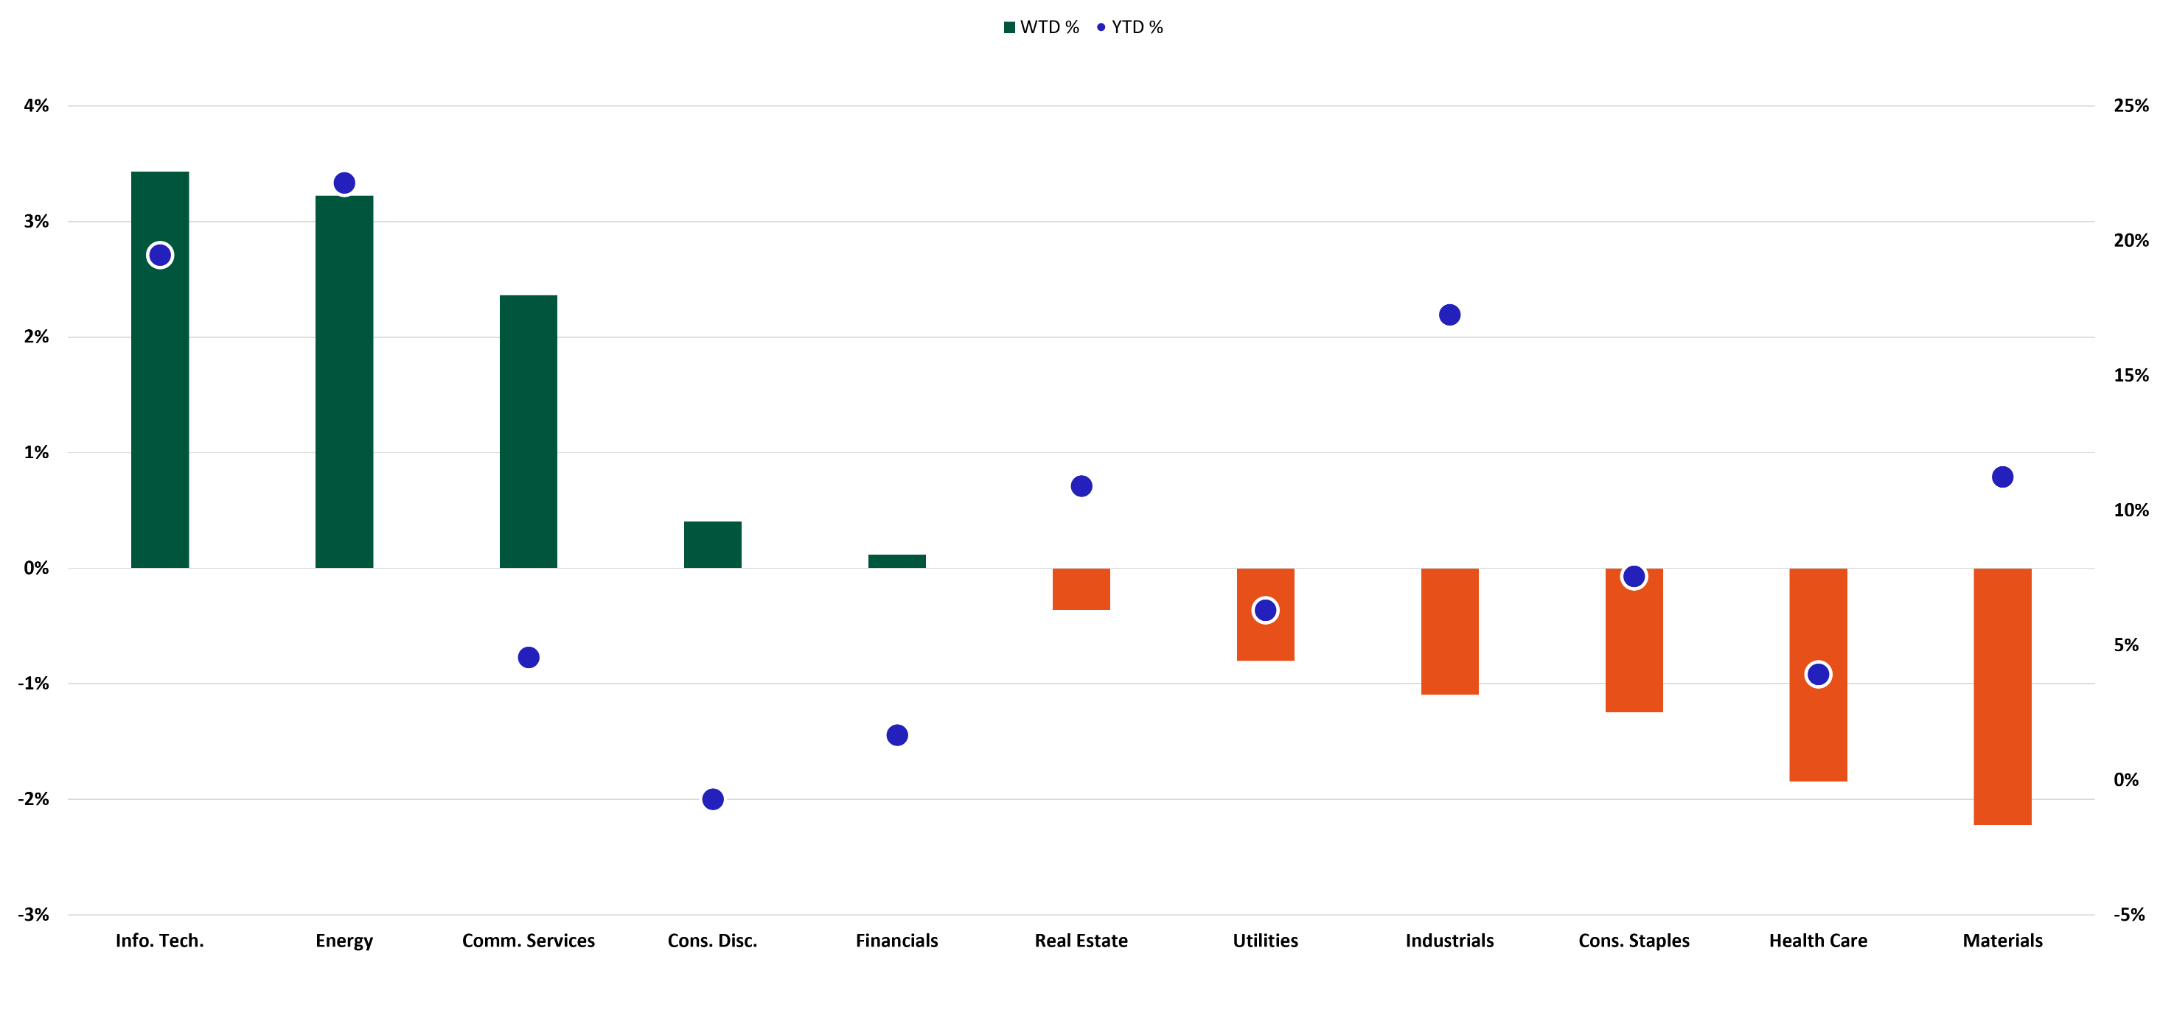
Past performance is not indicative of future results.
Russell U.S. Equity Style Performance
Large-cap stocks outperformed small-cap equities.
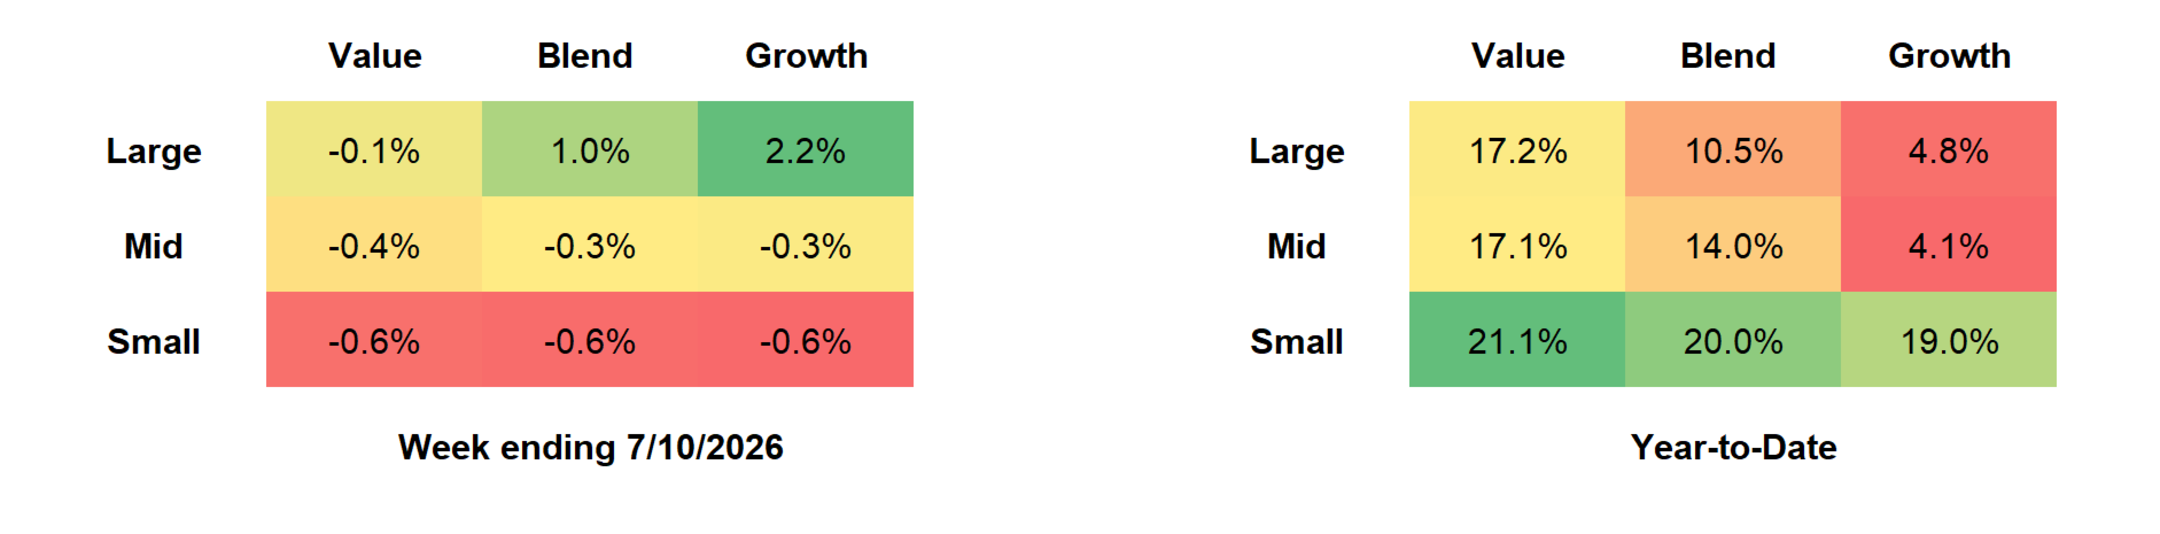
Past performance is not indicative of future results.
U.S. Equity Valuation
S&P 500 Equity Risk Premium
Bonds continue to appear attractive relative to equities.
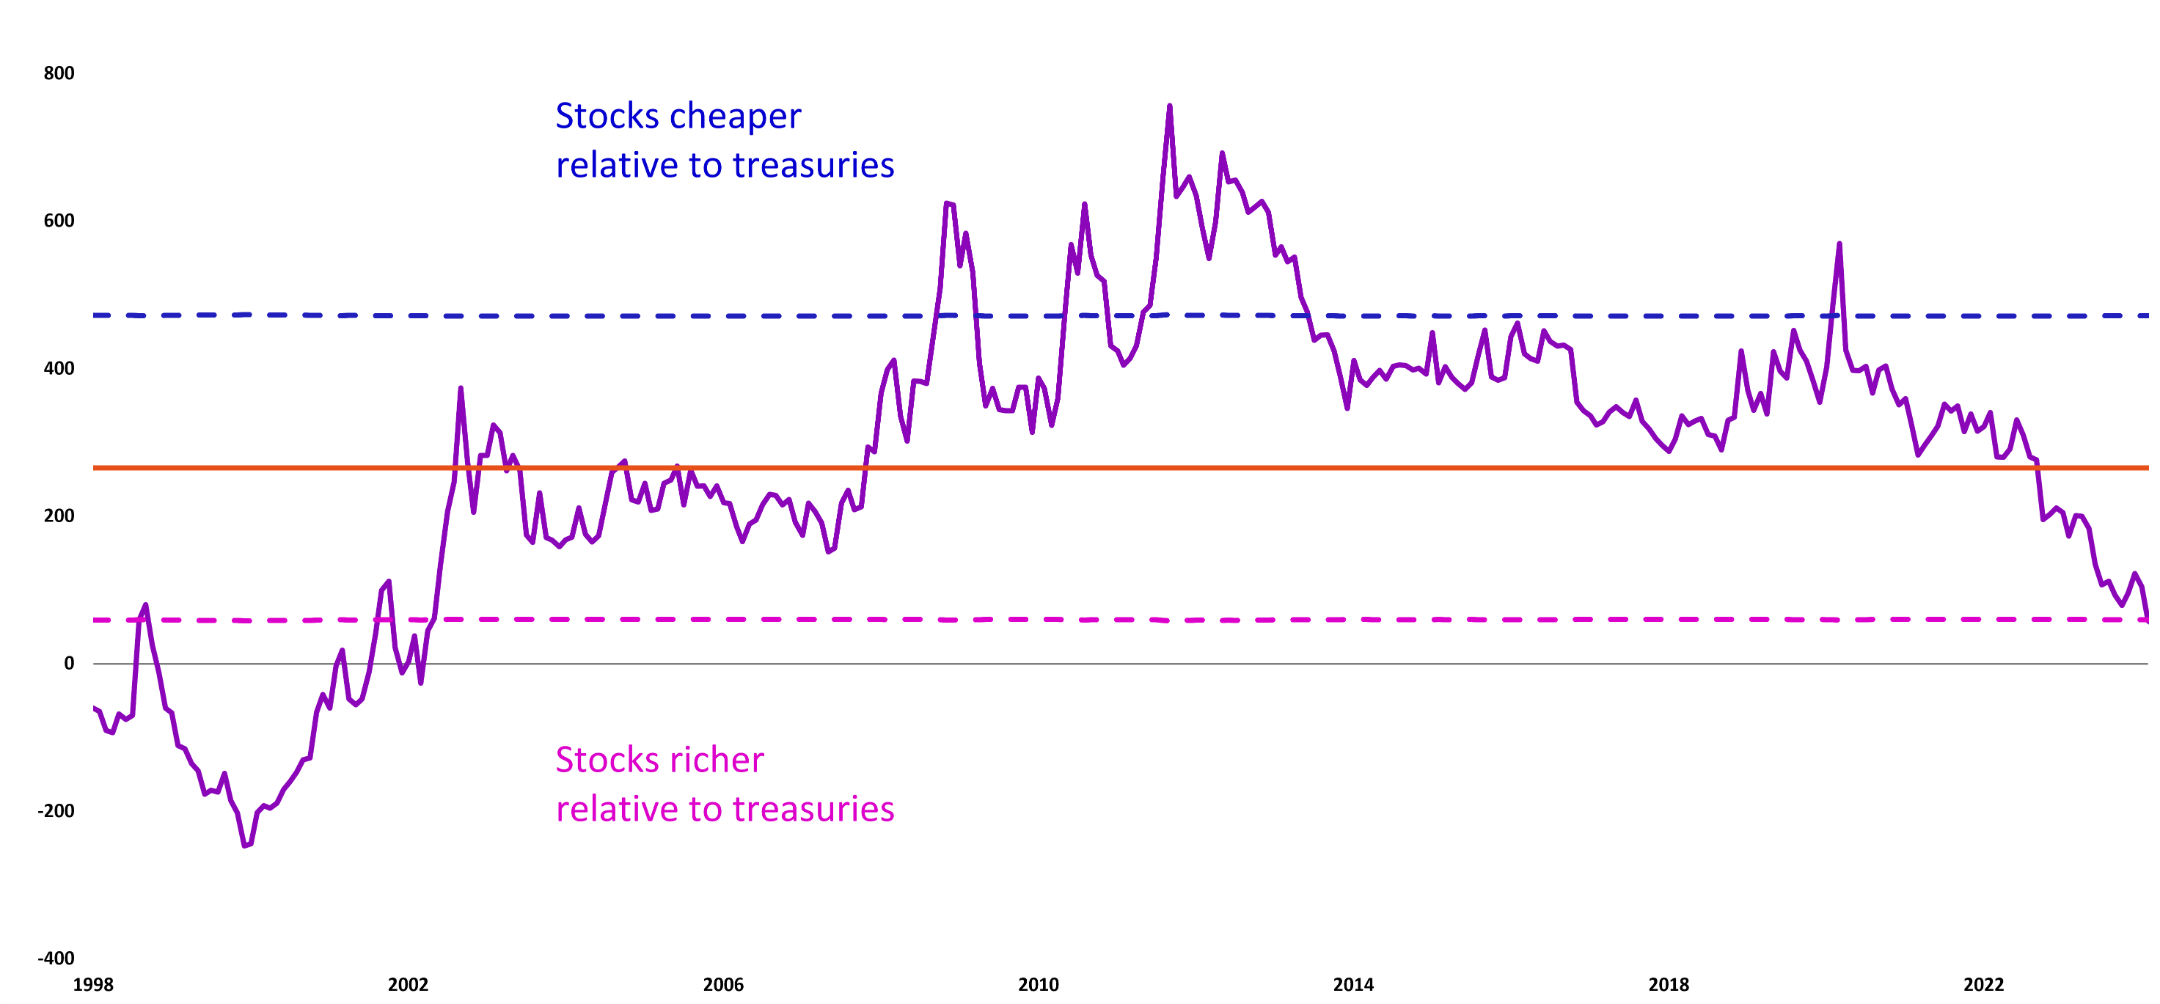
Past performance is not indicative of future results.
P/E Relative to Rest of World
The S&P 500 remains expensive relative to the rest of the world.
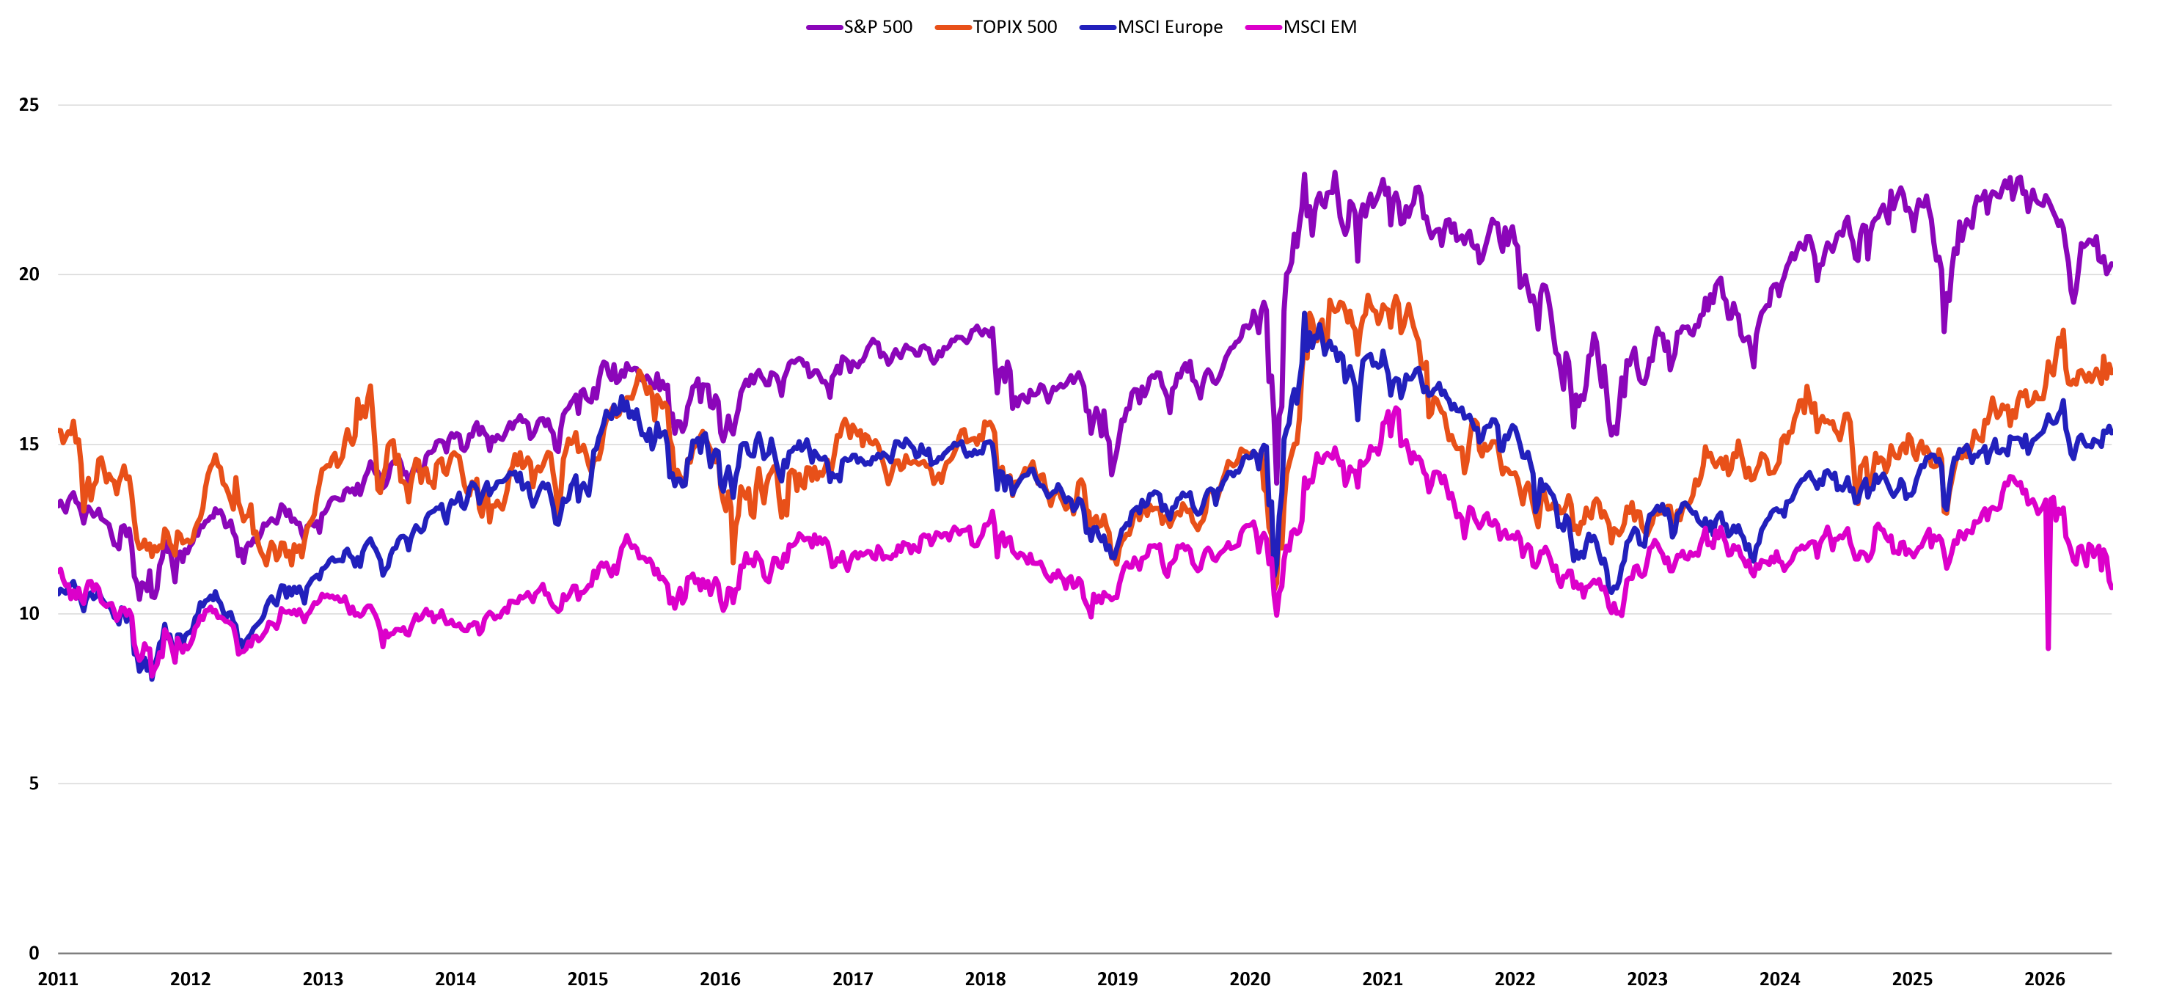
Past performance is not indicative of future results.
U.S. Fixed Income Valuation
The two-year Treasury yield rose 5 basis points to 4.14% over the week, while the 10-year Treasury yield rose 11 basis points to 4.48%.
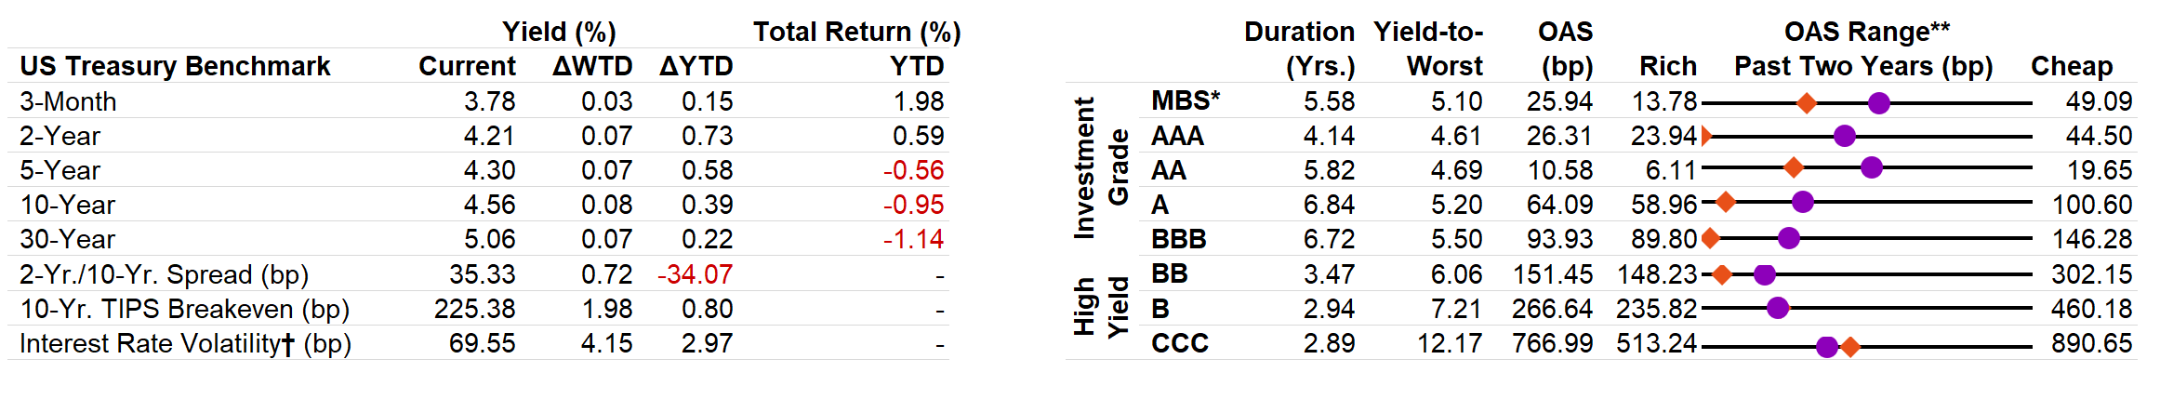
†Interest Rate Volatility as measured by ICE BofAML Option Volatility Estimate Index (MOVE); *Mortgage-backed securities (MBS) are debt obligations that represent claims to the cash flows from pools of mortgage loans, most commonly on residential property. Mortgage loans are purchased from banks, mortgage companies, and other originators and then assembled into pools by a governmental, quasi-governmental, or private entity; **Options Adjusted Spread (OAS): A measurement of the spread of a fixed income security rate and the risk-free rate of return, which is adjusted to take into account an embedded option. Past performance is not indicative of future results.
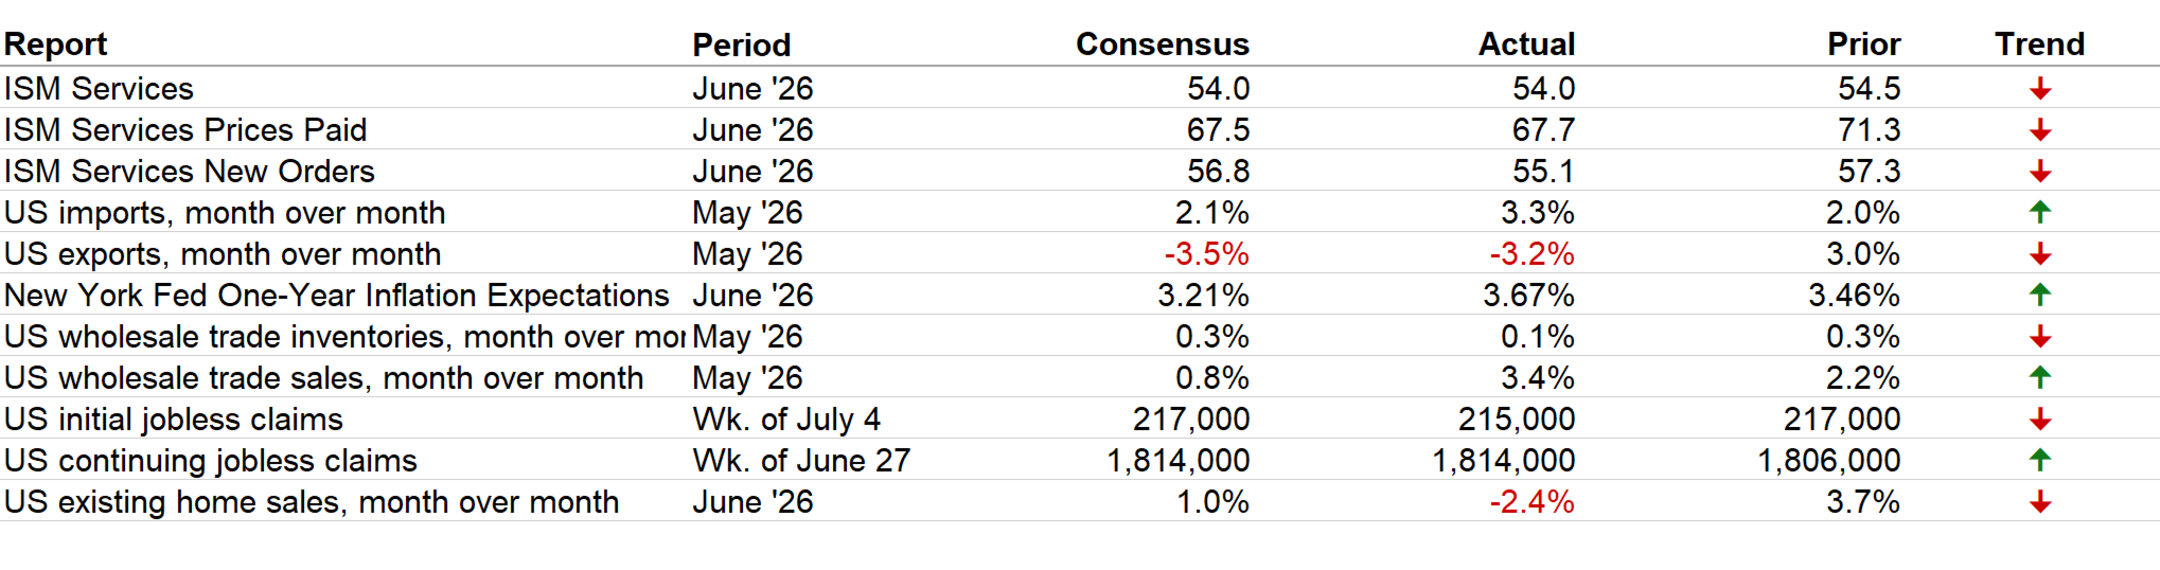
Latest Economic Data
June’s Institute for Supply Management Services Index showed U.S. services activity continuing to grow, matching analyst expectations at 54.0, though it slipped modestly from the prior month. (A reading above 50 signals expansion.) New Orders remained in expansion territory but slowed slightly from May. Employment returned to expansion for the first time in four months. Pricing pressure showed signs of easing, with the Prices Paid component falling below 70 for the first time since February.
The Week Ahead
Second-quarter 2026 earnings season begins this week, with Financials in focus. The week also includes the National Federation of Independent Business Small Business Optimism Surveys for June; U.S. real average hourly earnings for June; the Consumer Price Index and Producer Price Index for June; the National Association of Home Builders Housing Market Index for July; and several regional Fed surveys.
- NFIB Small Business Optimism Index at 6:00 AM ET
- U.S. real average hourly earnings at 8:30 AM ET
- U.S. CPI at 8:30 AM ET
- U.S. Core CPI at 8:30 AM ET
- J P Morgan Chase & Co Reports Earnings
- Bank of America Corporation Reports Earnings
- Goldman Sachs Group, Inc. (The) Reports Earnings
- Citigroup Inc. Reports Earnings
- U.S. PPI at 8:30 AM ET
- Johnson & Johnson Reports Earnings
- Morgan Stanley Reports Earnings
- BlackRock, Inc. Reports Earnings
- New York Fed Services Business Activity at 8:30 AM ET
- Philadelphia Fed Business Outlook Survey at 8:30 AM ET
- U.S. retail sales at 8:30 AM ET
- U.S. initial jobless claims at 8:30 AM ET
- U.S. business inventories at 10:00 AM ET
- U.S. pending home sales at 10:00 AM ET
- Taiwan Semiconductor Manufacturing Company Ltd. Reports Earnings
Index benchmarks
Cross-Asset Performance
S&P 500: A market capitalization-weighted index of 500 widely held stocks often used as a proxy for the stock market. It measures the movement of the largest issues. Standard and Poor's chooses the member companies for the 500 based on market size, liquidity and industry group representation. Included are the stocks of industrial, financial, utility, and transportation companies. Since mid-1989, this composition has been more flexible and the number of issues in each sector has varied. The returns presented for the S&P 500 are total returns, including the reinvestment of dividends each month.
Dow Jones Industrial Average: Computed by summing the prices of the stocks of 30 companies and then dividing that total by an adjusted value—one which has been adjusted over the years to account for the effects of stock splits on the prices of the 30 companies. Dividends are reinvested to reflect the actual performance of the underlying securities.
NASDAQ Composite: Measures the performance of all issues listed in the NASDAQ Stock Market, except for rights, warrants, units, and convertible debentures. Morningstar reports the NASDAQ Composite as a price return.
MSCI Europe IMI: This index captures large, mid and small cap representation across 16 Developed Markets countries in Europe. With 1,372 constituents, the index covers approximately 99% of the free float-adjusted market capitalization across the Developed Markets countries of Europe.
MSCI Japan IMI: This index is designed to measure the performance of the large, mid and small cap segments of the Japan market. With 1,134 constituents, the index covers approximately 99% of the free float-adjusted market capitalization in Japan.
MSCI EM (Emerging Markets) Index: A free float-adjusted market-capitalization index that is designed to measure equity market performance of emerging markets. The MSCI Emerging Markets Index consists of the following 23 emerging market country indexes: Brazil, Chile, China, Colombia, Czech Republic, Egypt, Greece, Hungary, India, Indonesia, Korea, Malaysia, Mexico, Peru, Philippines, Poland, Qatar, Russia, South Africa, Taiwan, Thailand, Turkey and United Arab Emirates. For more information, visit the MSCI web site.
MSCI EAFE (Europe, Australasia, Far East) Index: A free float-adjusted market-capitalization index that is designed to measure the equity market performance of developed markets, excluding the U.S. and Canada. The MSCI EAFE Index consists of the following 21 developed market country indexes: Australia, Austria, Belgium, Denmark, Finland, France, Germany, Hong Kong, Ireland, Israel, Italy, Japan, the Netherlands, New Zealand, Norway, Portugal, Singapore, Spain, Sweden, Switzerland, and the United Kingdom. For more information, visit the MSCI website.
S&P 400 Index: This index provides investors with a benchmark for mid-sized companies. The index measures the performance of mid-sized companies, reflecting the distinctive risk and return characteristics of this market segment.
S&P 600 Index: This index measures the small-cap segment of the U.S. equity market. The index is designed to track companies that meet specific inclusion criteria to ensure that they are liquid and financially viable.
S&P 500 Growth: This index is a style-concentrated index designed to track the performance of stocks that exhibit the strongest growth characteristics by using a style-attractiveness-weighting scheme.
S&P 500 Value: This index is a style-concentrated index designed to track the performance of stocks that exhibit the strongest value characteristics by using a style-attractiveness-weighting scheme.
Bloomberg Commodity Index: Made up of 22 exchange-traded futures on physical commodities. The index currently represents 20 commodities, which are weighted to account for economic significance and market liquidity.
US Trade-Weighted Dollar Index: A weighted average of the foreign exchange value of the US dollar against a subset of the broad index currencies that circulate widely outside the US.
MSCI Emerging Markets Currency Index: sets the weights of each currency equal to the relevant country weight in the MSCI Emerging Markets Index.
Bloomberg US Aggregate Index: The US Aggregate Index covers the dollar-denominated investment-grade fixed-rate taxable bond market, including Treasuries, government-related and corporate securities, MBS pass-through securities, asset-backed securities, and commercial mortgage-based securities. These major sectors are subdivided into more specific sub-indices that are calculated and published on an ongoing basis. Total return comprises price appreciation/depreciation and income as a percentage of the original investment. This index is rebalanced monthly by market capitalization.
Bloomberg US Corporate High Yield Bond Index: This index is composed of fixed-rate, publicly issued, non-investment grade debt.
S&P Sector Performance
The S&P 500 Consumer Discretionary sector comprises those companies included in the S&P 500 that are classified as members of the consumer discretionary sector.
The S&P 500 Consumer Staples sector comprises those companies included in the S&P 500 that are classified as members of the consumer staples sector.
The S&P 500 Energy sector comprises those companies included in the S&P 500 that are classified as members of the energy sector.
The S&P 500 Financials sector comprises those companies included in the S&P 500 that are classified as members of the financial sector.
The S&P 500 Health Care sector comprises those companies included in the S&P 500 that are classified as members of the health care sector.
The S&P 500 Industrials Sector comprises those companies included in the S&P 500 that are classified as members of the industrials sector.
The S&P 500 Information Technology Sector comprises those companies included in the S&P 500 that are classified as members of the information technology sector.
The S&P 500 Materials Sector comprises those companies included in the S&P 500 that are classified as members of the materials sector.
The S&P 500 Communications Services Sector comprises those companies included in the S&P 500 that are classified as members of the telecommunications services sector.
The S&P 500 Utilities Sector comprises those companies included in the S&P 500 that are classified as members of the utilities sector.
The S&P 500 Real Estate Sector comprises those companies included in the S&P 500 that are classified as members of the real estate sector.
US Equity Style Performance
Weekly and monthly style performance charts use Russell 1000, Russell Mid Cap, and Russell 2000 style indexes to represent large cap, mid cap, and small cap respectively.
Russell 1000: Consists of the 1000 largest companies within the Russell 3000 index. Also known as the Market-Oriented Index, because it represents the group of stocks from which most active money managers choose. The returns we publish for the index are total returns, which include reinvestment of dividends. Frank Russell Company reports its indexes as one-month total returns.
Russell 1000 Growth: Market-capitalization weighted index of those firms in the Russell 1000 with higher price-to-book ratios and higher forecasted growth values. The Russell 1000 includes the largest 1000 firms in the Russell 3000, which represents approximately 98% of the investable US equity market.
Russell 1000 Value: Market-capitalization weighted index of those firms in the Russell 1000 with lower price-to-book ratios and lower forecasted growth values. The Russell 1000 includes the largest 1000 firms in the Russell 3000, which represents approximately 98% of the investable US equity market.
Russell 2000: Consists of the smallest 2000 companies in the Russell 3000 Index, representing approximately 7% of the Russell 3000 total market capitalization. The returns we publish for the index are total returns, which include reinvestment of dividends.
Russell 2000 Growth: Market-weighted total return index that measures the performance of companies within the Russell 2000 Index having higher price-to-book ratios and higher forecasted growth values. The Russell 2000 Index includes the 2000 firms from the Russell 3000 Index with the smallest market capitalizations. The Russell 3000 Index represents 98% of the of the investable US equity market.
Russell 2000 Value: Market-weighted total return index that measures the performance of companies within the Russell 2000 Index having lower price-to-book ratios and lower forecasted growth values. The Russell 2000 Index includes the 2000 firms from the Russell 3000 Index with the smallest market capitalizations. The Russell 3000 Index represents 98% of the of the investable US equity market.
Russell Midcap: Measures the performance of the 800 smallest companies in the Russell 1000 Index, which represent approximately 25% of the total market capitalization of the Russell 1000 Index. As of the latest reconstitution, the average market capitalization was approximately $4.0 billion; the median market capitalization was approximately $2.9 billion. The largest company in the index had an approximate market capitalization of $12 billion.
Russell Midcap Growth: Market-weighted total return index that measures the performance of companies within the Russell Midcap Index having higher price-to-book ratios and higher forecasted growth values. The Russell Midcap Index includes firms 201 through 1000, based on market capitalization, from the Russell 3000 Index. The Russell 3000 Index represents 98% of the of the investable U.S. equity market.
Russell Midcap Value: Market-weighted total return index that measures the performance of companies within the Russell Midcap Index having lower price-to-book ratios and lower forecasted growth values. The Russell Midcap Index includes firms 201 through 1000, based on market capitalization, from the Russell 3000 Index. The Russell 3000 Index represents 98% of the of the investable U.S. equity market.
P/E Relative to Rest of World
TOPIX: This free-floated-adjusted index tracks all domestic companies of the exchange’s First Section.
US Fixed Income Valuation
ICE BofAML Option Volatility Estimate Index (MOVE): A yield curve-weighted index of the normalized implied volatility on one-month treasury option.
An investment cannot be made directly in a market index.