Markets adjust to tariff era
E*TRADE from Morgan Stanley
The US stock market is coming off its first three-month losing streak since 2023, as on-again, off-again tariffs, criticism of Federal Reserve Chairman Jerome Powell for not cutting interest rates, and stagflation concerns pushed volatility to its highest levels since March 2020.
While most investors are likely happy to close the books on April, US stocks enter May not too far below where they were at the end of March, before the Trump administration reshuffled the global economic deck by announcing sweeping tariffs.
The market landscape certainly looked much different on April 30 than it did on April 7. Although the S&P 500 (SPX) twice dipped into “bear-market” territory (20% below its February record high) last month, it never closed below that threshold. And despite continued choppiness, the index ended the month less than 2% below its April 2 pre-tariff close:
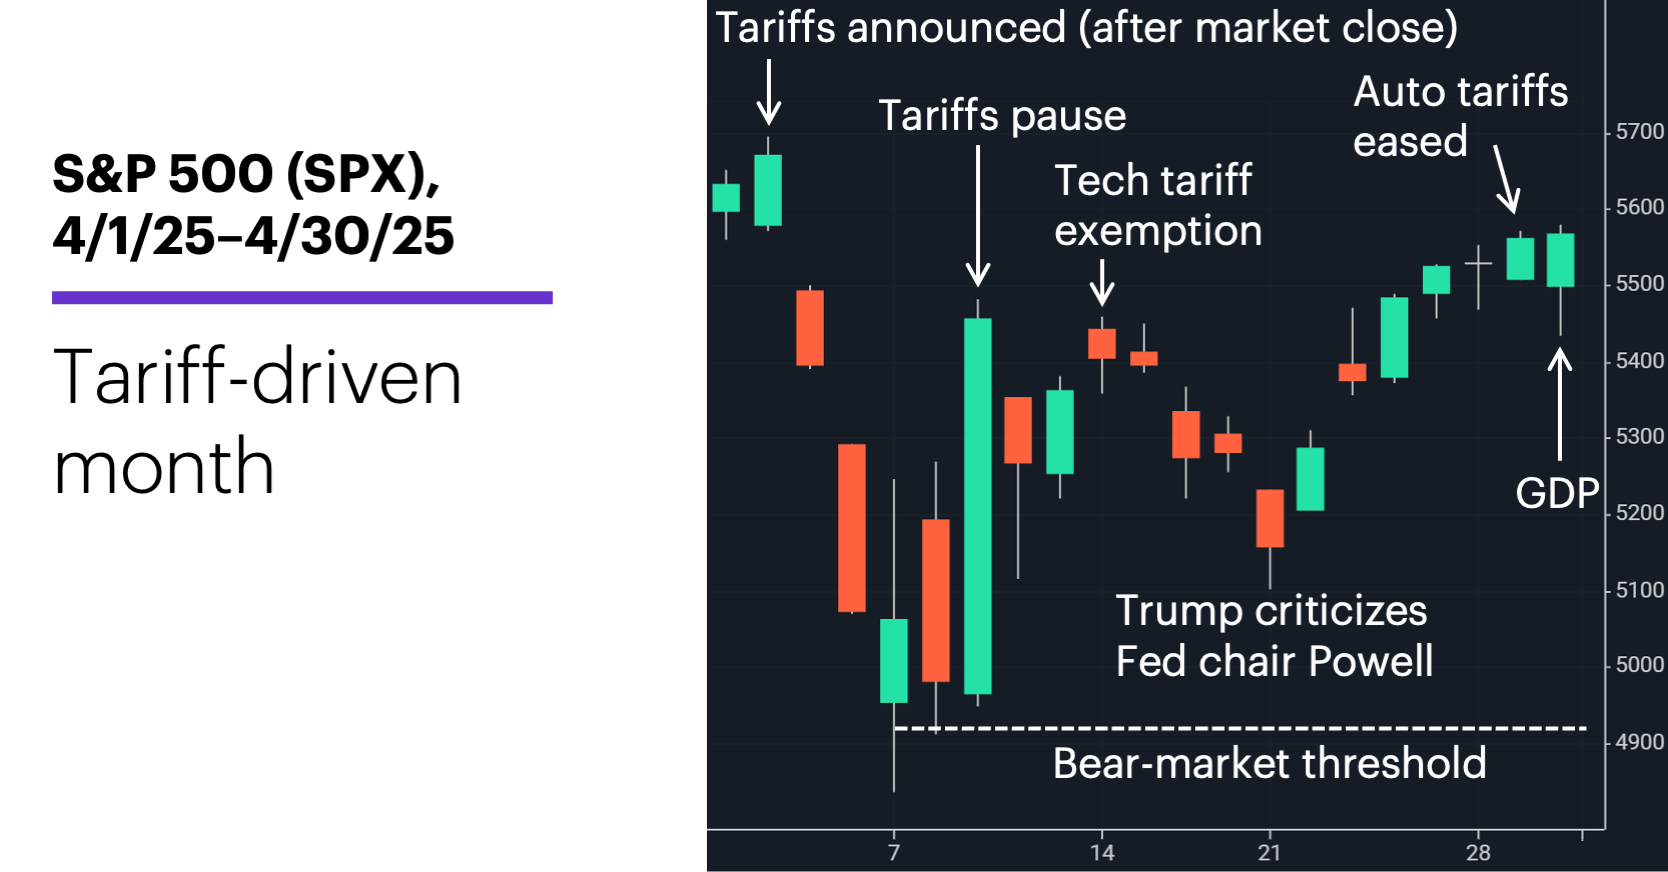
Source: Power E*TRADE. (For illustrative purposes. Not a recommendation. It is not possible to invest directly in an index.)
Volatility worked both ways last month. The S&P 500 logged its third-biggest up day of the past 68 years when the White House announced a 90-day reciprocal tariff pause (except for China) on April 9. However, Morgan Stanley’s Global Investment Committee (GIC) wasn’t ready to declare the “coast was clear,” noting that the pause didn’t meaningfully alter the tariff picture initially unveiled on April 2, which they expected to weigh on economic growth, corporate margins, and consumer behavior.1
Tech and communication services were the strongest sectors in April, while energy and health care were the weakest. (Energy was dragged lower by the biggest monthly drop in crude oil prices since 2021.) The tech-heavy Nasdaq Composite managed to post a small gain for the month. But overall, US stocks lost additional ground to international equities last month, with developed markets climbing a robust 3.7% and emerging markets gaining 1.3%.
It was an extremely choppy month for fixed income. The benchmark 10-year Treasury yield may have ended April just five basis points (0.05%) lower at 4.16%, but it swung from a six-month low to a two-month high before landing there. Also, Treasuries sold off sharply on April 7 (the day the SPX hit its lowest low of the tariff sell-off), highlighting a breakdown in the market’s “safe-haven” function. Meanwhile, the US dollar continued to weaken, falling more than it has in any month since November 2022.
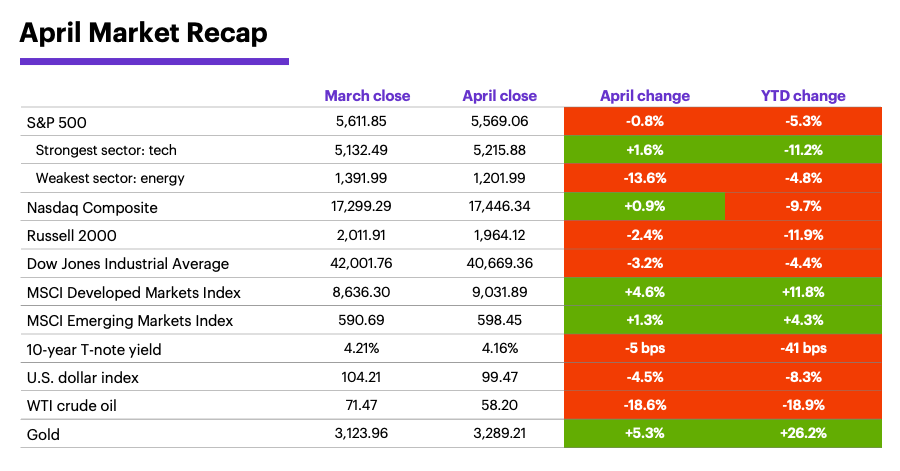
Data source: Power E*TRADE and FactSet. (For illustrative purposes. Not a recommendation. It is not possible to invest directly in an index.) Note: crude oil, gold, and U.S. Dollar Index data reflect spot-market prices. BPS (basis point) = 0.01%. MSCI Index of Developed Markets and MSCI Emerging Markets Index represent “total-return” performance (index change including dividend reinvestment).
In fact, bond-market stress—not the stock-market sell-off—appeared to trigger the tariff pause. According to Morgan Stanley Wealth Management, the Trump administration may have been most concerned about the possibility of “trade-war dynamics spilling into capital flows,” prompting weaker foreign demand for US debt and heightened currency volatility.2 As the analysts note, that the White House “blinked” on long-term bond yields exposed the US Achilles’ heel—our debt and deficits.
While the administration scaled back some tariffs and adopted a friendlier tone toward China later in April, the GIC isn’t convinced that resolving tariff uncertainty will be enough to produce a new bull market. As they note, market dynamics suggest continued investor anxiety, and economic conditions imply potentially slowing growth and higher inflation. (On April 30, Q1 GDP came in weaker than expected, but the PCE Price Index showed inflation eased in March.) They also believe that individual “tariff deal” announcements will likely disappoint in the absence of a comprehensive rollback. For stocks, they argue, that points to a “trader’s market” rather than an investor’s market.3
That sentiment echoes Morgan Stanley & Co.’s belief that US stocks may continue to trade in a range. While acknowledging the possibility of a brief overshoot of the top of their 5,000–5,500 range for the S&P 500, the strategists think a sustained breakout likely depends on still-elusive developments: a successful tariff deal with China, a more dovish Fed, longer-term interest rates below 4% (without recessionary data), and a rebound in earnings revisions. With range trading likely to continue, the strategists believe quality and large-cap relative outperformance should continue (see their guidelines for screening stocks).4
The model suggests the market for humanoid robots will grow materially larger than the global auto industry.
Insight of the month: AI robot market takes shape. The future may be closer than we think. Morgan Stanley & Co. researchers estimate that by 2050, there could be one billion AI-driven “humanoid” robots representing a $5 trillion global marketplace. Their proprietary model projects the market for humanoid robots will grow materially larger than the global auto industry. Their recent report updates the year-to-date performance of the “Humanoid 100” stocks.
Historical perspective on months like April. Before last month, the S&P 500 fell to a 14-month (or longer) low but rallied to close in the upper third of the month’s range only six other times since 1985. The index had a positive return the next month in four of the six cases.
May market patterns. May has been a positive month for the S&P 500 in 43 of the past 68 years, but has been more bullish in the past 34, gaining ground 25 times since 1991.6
Key dates: Employment Report (5/2), Fed interest rate decision (5/7), CPI (5/13), PPI (5/15), retail sales (5/15), Q1 GDP, second estimate (5/29), PCE Price Index (5/30).
1,2 MorganStanley.com. Risks Linger Despite Pause on Tariffs. 4/15/25.
3 MorganStanley.com. The GIC Weekly: Tell 'Em What They Need to Hear. 4/28/25.
4 MorganStanley.com. Weekly Warm-up: Testing Both Ends of Our Range. 4/28/25.
5 MorganStanley.com. A $5 Trillion Global Market. 4/28/25.
6 Figures reflect S&P 500 (SPX) monthly closing prices, 1957–2024. Supporting document available upon request.
Because of their narrow focus, sector investments tend to be more volatile than investments that diversify across many sectors and companies. Technology stocks may be especially volatile. Risks applicable to companies in the energy and natural resources sectors include commodity pricing risk, supply and demand risk, depletion risk and exploration risk. Health care sector stocks are subject to government regulation, as well as government approval of products and services, which can significantly impact price and availability, and which can also be significantly affected by rapid obsolescence and patent expirations.
Yields are subject to change with economic conditions. Yield is only one factor that should be considered when making an investment decision.