Tech helps lift market past yield surge
- Stocks gain even as 10-year yield tops 5.2%
- Tech leads, small caps retreat, oil dips
- This week: jobs report, Fed inflation, final GDP
Last week the US stock market weathered another surge in long-term interest rates to snap a two-week losing streak, as oil prices eased and the tech sector regained some of its former momentum.
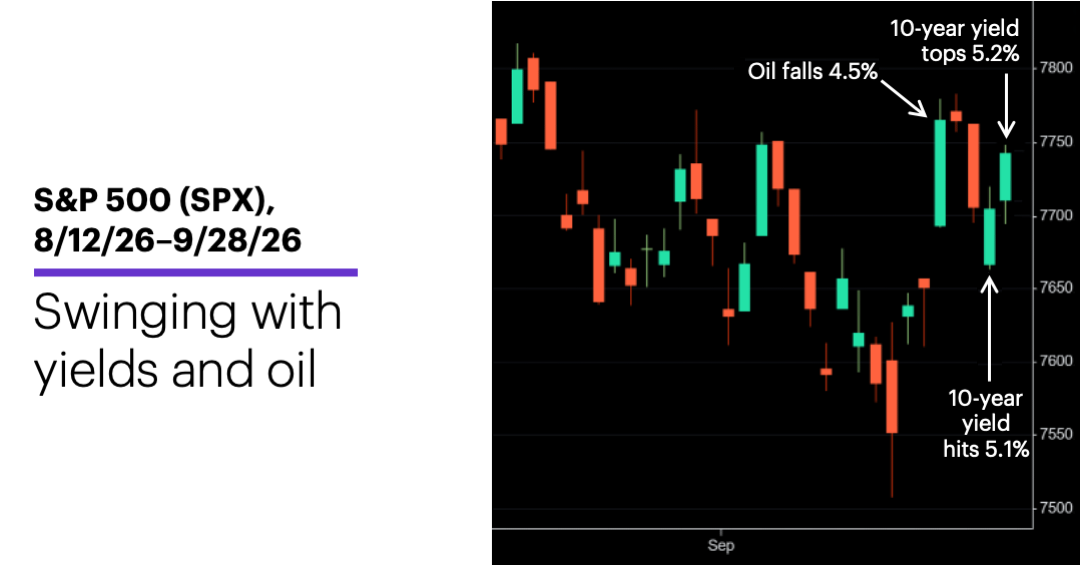
The S&P 500 (SPX) jumped to its highest level in more than a month last Monday as US oil prices tumbled more than 4%, but pulled back sharply midweek as the 10-year US Treasury yield hit 5.1% and oil turned higher. But the index followed through on Thursday’s intraday reversal with a solid rally on Friday, even though the 10-year yield climbed to fresh highs:
Source: Power E*TRADE. (For illustrative purposes. Not a recommendation. Note: It is not possible to invest in an index.)
The headline: SPX gets back into plus column for the month.
The fine print: The Nasdaq Composite (COMP) and Nasdaq 100 (NDX) both hit all-time highs last week as tech continued its multi-week rebound. Last week was the NDX’s fourth-straight week as the strongest major US index and its fourth positive week of the past five. Strong rallies in electronic components and semiconductors made tech the strongest SPX sector.
The move: The US 10-year Treasury yield jumped 15 basis points (0.15%) to 5.10% last Wednesday. It was the benchmark yield’s biggest one-day gain since April 2024. Morgan Stanley & Co. analysts expect the 10-year yield to be at 4.8% at end of 2026 and 4.7% at end of 2027. Their bull and bear cases for the end of 2027 are 3.8% and 5.25%, respectively.1
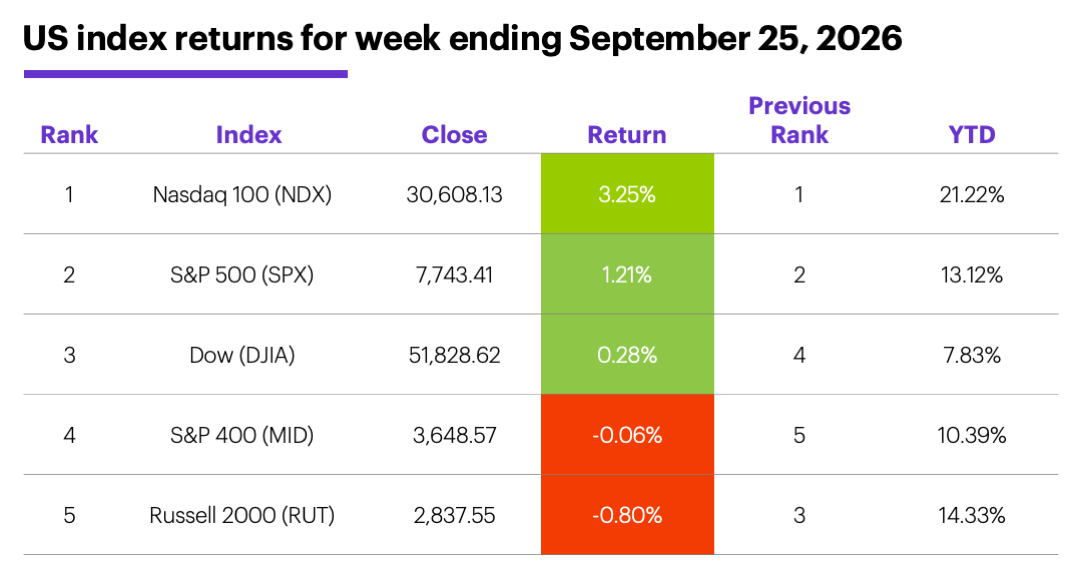
The scorecard: The two indexes with the most tech exposure—the NDX and the SPX—were the best performers last week:
Source (data): Power E*TRADE. (For illustrative purposes. Not a recommendation.)
S&P 500 sector returns: The strongest S&P 500 sectors last week were tech (+3%), communication services (+2.1%), and health care (+1.7%). The weakest sectors were utilities (-3.3%), energy (-3%), and financials (-1.6%).
S&P 500 stock movers: Last week’s biggest gains were Moderna (MRNA) +29% to $198.88, Everpure (P) +21% to $126, and Datadog (DDOG) +17% to $268.13. The biggest losses were Gen Digital (GEN) -25% to $21.62, MGM Resorts (MGM) -14% to $32.58, and Paychex (PAYX) -13% to $101.37.
Yields and the dollar: The 10-year US Treasury yield climbed 15 basis points (0.16%) to 5.16% last week (and topped 5.2% intraday on Friday). The US Dollar Index (DXY) rallied 0.75 to 100.97.
Commodity futures: November WTI crude oil (CLX6) ended a choppy week down $2.67 to $92.41. December gold (GCZ6) fell $103.70 to $4,321.20, its fourth down week of the past five. Biggest gains: November orange juice (OJX6) +7.2%, November rice (ZRX6) +6%. Biggest declines: October lean beef trim (BFTV6) -15%, November heating oil (HOX6) -7.9%.
Crypto: Bitcoin +3.9% to $84,034.92 last week, Ether +3% to $2,690.48.
Coming this week
The economic calendar revolves around the labor market, culminating in Friday’s jobs report, but it also includes Fed inflation (PCE Price Index) and the final Q2 GDP reading:
●Tuesday: S&P Case-Shiller Home Price Index, FHFA House Price Index, Job Openings and Labor Turnover Survey (JOLTS), consumer confidence
●Wednesday: ADP Private Employment, GDP (Q2 final), PCE Price Index, Personal Income and Spending, Chicago PMI
●Thursday: job cuts, S&P Global Manufacturing PMI, ISM Manufacturing Index, construction spending
●Friday: Employment Report, Factory Orders, vehicle sales
This week’s earnings include:
●Monday: IDT (IDT), Vail Resorts (MTN)
●Tuesday: AAR (AIR), Carnival (CCL), CarMax (KMX)
●Wednesday: Conagra (CAG), Cal-Maine Foods (CALM), FactSet Research (FDS), Jabil (JBL), Micron (MU), Progress Software (PRGS)
●Thursday: Accenture (ACN), McCormick & Company (MKC), Nike (NKE)
Small-cap shift
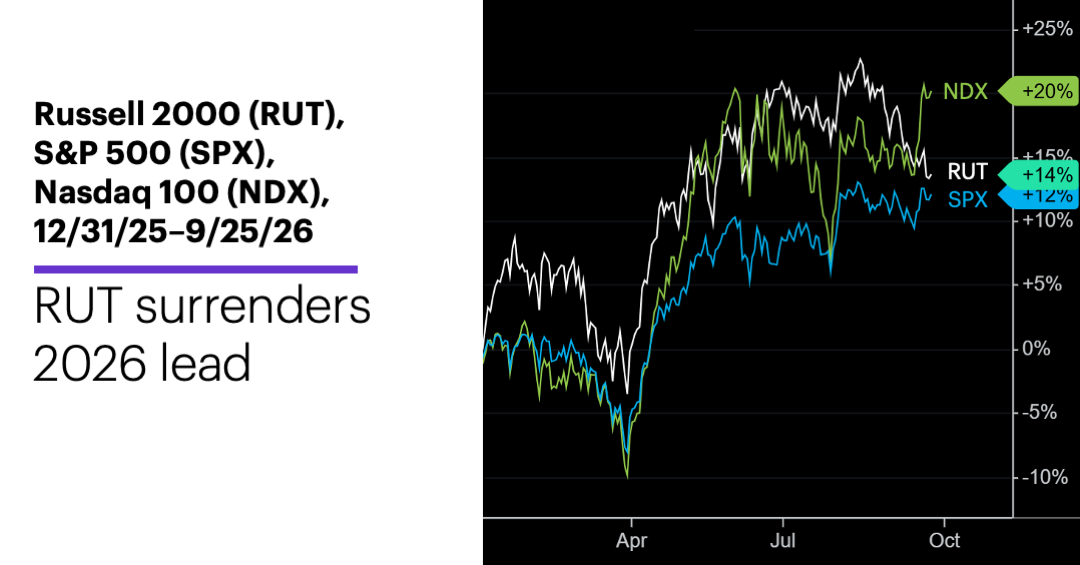
After leading the US market for most of the year, the Russell 2000 (RUT) small cap index finds itself in an unfamiliar position—playing catch-up.
As recently as July 24, the RUT led the NDX tech index by seven percentage points for the year and the SPX by nearly 10. Four weeks before that, the RUT had led the SPX by nearly 14 percentage points. The RUT has had a larger year-to-date return than the SPX at the end of every week this year, and at the end of 30 of 38 weeks vs. the NDX.
But on Friday, the RUT was trailing the NDX for a second week in a row, and was less than two percentage points ahead of the SPX:
Source: Power E*TRADE Pro. (For illustrative purposes. Not a recommendation. Note: It is not possible to invest directly in an index.)
The small-cap index is down 7.5% from its August all-time high, and if not for a slight (0.1%) gain for the week that ended September 4, last week would have been its sixth down week in a row.
Putting the RUT’s recent retreat in a larger historical context—that is, a six-week decline of 7% or more from a four-week (or longer) high to a four-week (or longer) close—shows the small-cap index tended to rebound in the near term after such moves, although it didn’t necessarily get off to a strong start: The index closed higher the next week in 19 of 37 cases (51.4% of the time), but was higher after two weeks in 22 cases (67.6% of the time).2
Click here to log on to your account or learn more about E*TRADE's trading platforms, or follow the Company on X (Twitter), @ETRADE, for useful trading and investing insights.
1 MorganStanley.com. New US Treasury Yield Forecasts After New Fed Call. 9/24/26.
2 All figures reflect Russell 2000 (RUT) weekly closing prices, 1987-2026. Supporting document available upon request.