Cue the Fed
- Stocks fall amid soaring yields and $100-plus oil
- Markets anticipate possible rate hike
- This week: Fed rate announcement, retail sales
Considering the number of obstacles it faced, the US stock market’s modest decline last week may have highlighted its underlying resilience.
Last Thursday the S&P 500 (SPX) closed at its lowest level in nearly six weeks as US crude oil prices jumped above $100, long-term Treasury yields pressured multi-year highs, and the Producer Price Index (PPI) showed higher inflation at the wholesale level. But stocks rebounded on Friday as oil pulled back amid reports of diplomatic overtures to reopen the Strait of Hormuz, while the Consumer Price Index (CPI) presented a more moderate inflation picture:
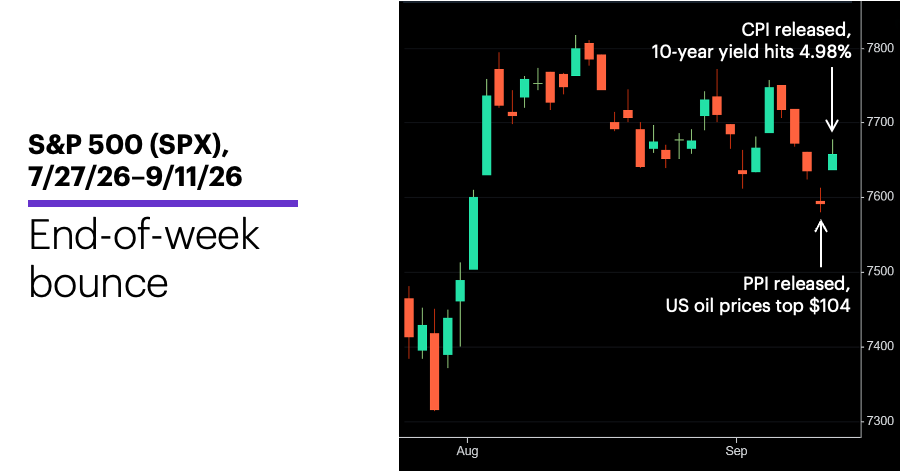
Source: Power E*TRADE. (For illustrative purposes. Not a recommendation. Note: It is not possible to invest in an index.)
The headline: Stocks lose ground, but pare losses on Friday.
The fine print: While the in-line (but still above-target) CPI appeared to at least partially offset the hot PPI reading, the market-based odds that the Fed will hike interest rates this week jumped to 86.5% on Friday.1 The stock market’s solid bounce that day could be partially interpreted as an indication that traders may not be overly concerned about higher rates (if the Fed does, in fact, hike).
The number: $100. Both US WTI crude oil and global Brent crude oil prices soared to triple-digit levels last week, and both ended the week above $100 despite pulling back on Friday. (Prices climbed again on Sunday in the wake of Saudi Arabia’s closure of a key oil pipeline that suffered a drone attack last Thursday.)
The scorecard: All the major indexes fell last week, but the Nasdaq 100 (NDX) surrendered the least ground:
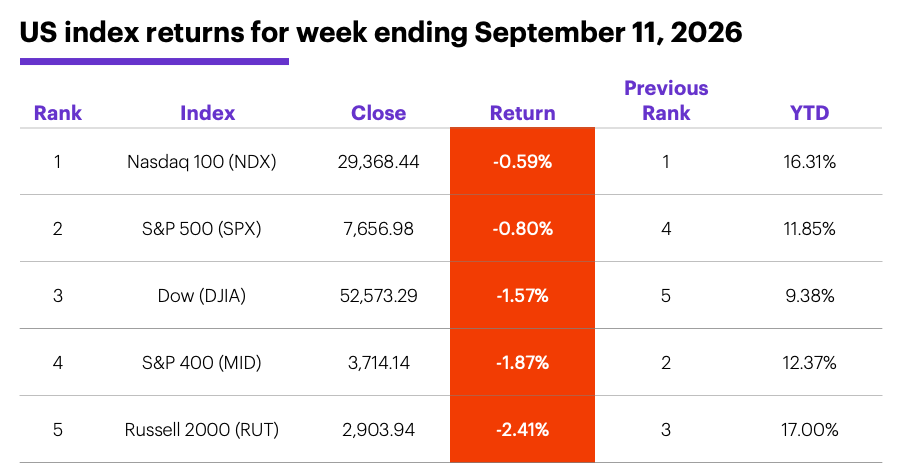
Source (data): Power E*TRADE. (For illustrative purposes. Not a recommendation.)
S&P 500 sector returns: The strongest sectors last week were energy (+1.6%), communication services (+1.3%), and tech (-0.1%). The weakest sectors were health care (-3.6%), materials (-2.6%), and industrials (-1.9%).
S&P 500 stock movers: Last week’s biggest gains were Skyworks Solutions (SWKS) +24% to $88.38, Coherent (COHR) +15% to $304.5, and Corning (GLW) +14% to $166.22. The biggest losses were Cooper Companies (COO) -24% to $53.59, Lululemon (LULU) -19% to $98.61, and Casey's General Stores (CASY) -19% to $615.54.
Yields and the dollar: The benchmark 10-year US Treasury yield jumped 0.19% to a nearly three-year high of 4.97% last week (the 30-year yield tagged a 19-year high of 5.35%). The US Dollar Index (DXY) slipped 0.06 to 99.12.
Commodity futures: Despite pulling back more than 2% on Friday, October WTI crude oil (CLV6) ended the week up $8.57 at $100.05. December gold (GCZ6) fell $67.70 to $4,408.90 last week.
Crypto: Bitcoin fell $2,498.17 (3.1%) to $77,173.80, Ethereum rallied $58.65 (2.4%) to $2,514.73.
Coming this week
It’s all about the Fed this week:
●Tuesday: Empire State Manufacturing Index
●Wednesday: Retail Sales, Import and Export Prices, Business Inventories, NAHB Housing Market Index, Fed interest rate decision
●Thursday: Housing Starts and Building Permits, Philadelphia Fed Manufacturing Index, Pending Home Sales
●Friday: Industrial Production and Capacity Utilization, Leading Economic Indicators
This week’s earnings include:
●Monday: Cracker Barrel Old Country Store (CBRL), Dave & Buster's Entertainment (PLAY)
●Tuesday: Trip.com (TCOM)
●Wednesday: Lennar (LEN)
Friday pivot analysis
Last Thursday marked the SPX’s lowest close in more than a month, but the index took some bullish momentum into the weekend by snapping a four-day losing streak on Friday, ending the day up 0.86%.
While the likelihood of that momentum following through this week will depend on the Fed announcement, geopolitics, and oil prices, among other factors, history shows the SPX was more likely to post a net gain than a loss in the five trading days after days like Friday (a 0.8%-or-larger up day that interrupts a four-day pullback to a 20-day-or-longer low close).2 While the index has a positive return in 56.7% of all five-day periods since 1957, it was positive in 64% of the five-day periods that followed days like Friday.
As is often the case, though, the details offer potentially important food for thought. While the SPX’s median five-day return after the pullback/pivot pattern was 0.8%—more than twice as large as the index’s benchmark five-day median return of 0.3%—the average five-day return was 0.23%.
A median is less impacted by “outliers”—that is, unusually large values in a data set—than an average. The fact that the average post-pattern return was so much smaller than the median return suggests there were occasionally large down moves after the pullback/pivot pattern.
Finally, if we consider a subset of the pattern examples—where the bounce day’s return was at least 0.75% but less than 1%--the five-day median net return was 0.9% (similar to the original), while the average five-day return was 0.6%
Click here to log on to your account or learn more about E*TRADE's trading platforms, or follow the Company on X (Twitter), @ETRADE, for useful trading and investing insights.
1 CMEGroup. FedWatch Tool. 9/11/26.
2 All figures reflect S&P 500 (SPX) daily closing prices, 1957-2025. There were 114 examples of the original pullback/pivot pattern, and 31 examples of the subset pattern. Supporting document available upon request.