October stock market history
- 61% of Octobers positive for stocks since 1957
- Past 35 years have been more bullish
- Typical October volatility above average, not extreme
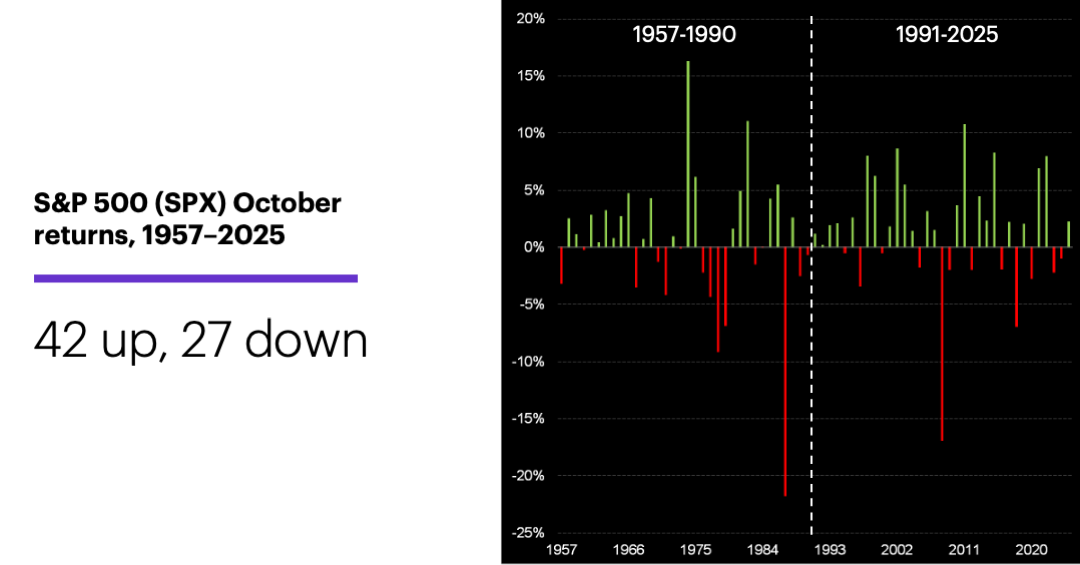
Despite hosting some of the stock market’s highest-profile sell-offs over the years, October has actually been a solidly positive month for US stocks since 1957, and even more so in recent decades.
Between 1957 and 1990, October was an up month for the S&P 500 (SPX) in 19 of 34 years (56%). In the 35 years since 1991, it was up 23 times (66%):
Source: Power E*TRADE. (For illustrative purposes. Not a recommendation.)
Despite that net positivity, October’s reputation for volatility is not entirely undeserved, even if it’s sometimes overestimated. Even during the more bullish 1991-2025 window, October had the largest average SPX intramonth drawdown (the percentage move from the previous month’s close to the lowest low of the current month). It also had the highest average “true range,” which measures the month’s maximum move, up or down, from the previous month’s close.
However, while many traders and investors think of “volatility” exclusively in terms of falling prices, it actually refers to the magnitude of price movement—up or down. In other words, while October has a history of larger-than-average intramonth price swings, some of those swings have been to the upside.
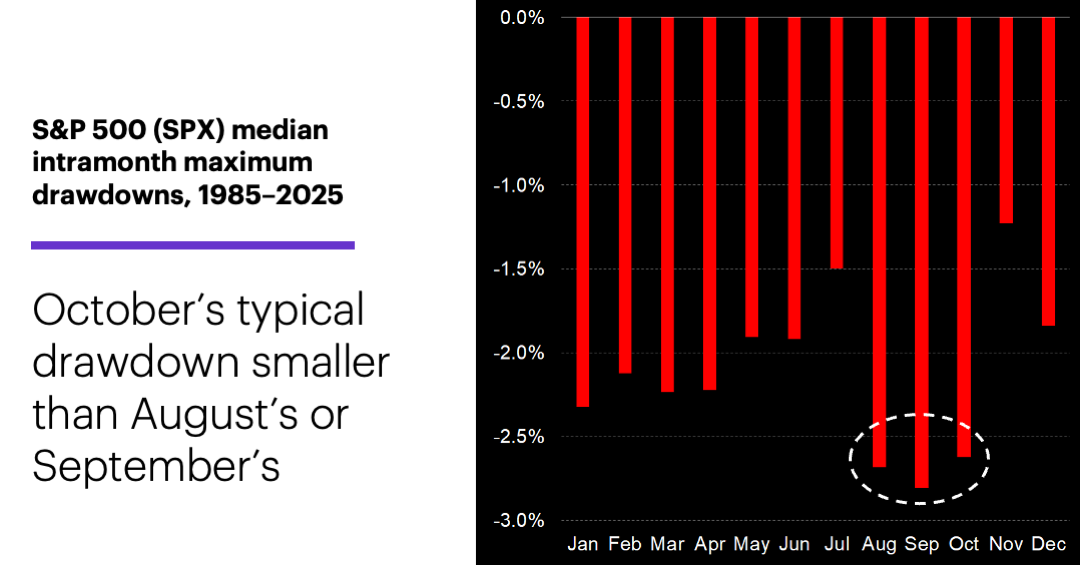
Also, even October’s large average intramonth drawdown deserves closer scrutiny. It’s true that since 1985 October has the largest average intramonth drawdown of all months, but that’s primarily because of the 33% intramonth sell-off that occurred in the “crash” year of 1987. The chart below of the SPX’s median intramonth drawdown for each month of the year—which, unlike the average drawdown, isn’t as influenced by statistical outliers like October 1987—shows that October’s typical intramonth loss was smaller than either August’s or September’s:
Source: Power E*TRADE Pro. (For illustrative purposes. Not a recommendation.)
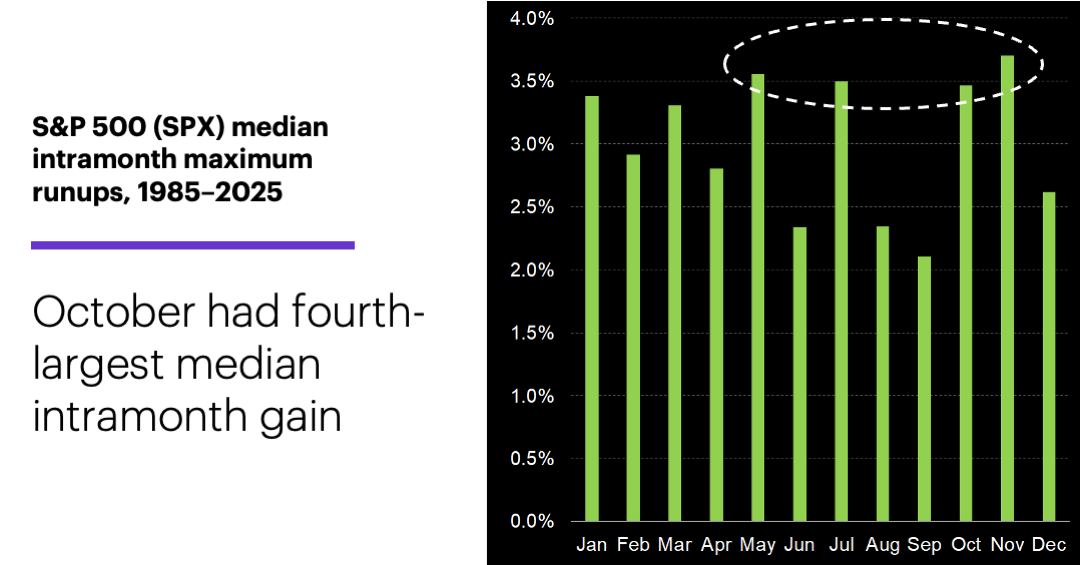
And at the other end of the volatility spectrum, October had the fourth-largest median intramonth gain (the percentage move from the previous month’s close to the current month’s highest high):
Source (data): Power E*TRADE. (For illustrative purposes. Not a recommendation. Note: It is not possible to invest directly in an index.)
Whether this October turns out to be more or less volatile than average will likely depend on the interaction of the market’s prevailing catalysts—for example, yields, energy prices and geopolitics, upcoming earnings—and the nature of any unexpected developments, good or bad. But the fact that a handful of well-known sell-offs occurred in October doesn’t negate the month’s long-term positive track record.
Today’s numbers include (all times ET): Challenger Job-Cut Report (5:30 a.m.), Weekly Jobless Claims (8:30 a.m.), ISM Manufacturing Index (10 a.m.), Construction Spending (10 a.m.), EIA Natural Gas Report (10:30 a.m.).
Today’s earnings include: Accenture (ACN), McCormick & Company (MKC), Nike (NKE).
Click here to log on to your account or learn more about E*TRADE's trading platforms, or follow the Company on X (Twitter), @ETRADE, for useful trading and investing insights.