Stocks bend, but don’t break
- AI volatility and surging oil challenge stocks
- Small caps bounce, Treasury yields fall, gold tumbles
- This week: Fed rate decision, GDP, “big” earnings
US stocks head into a key stretch of earnings and economic data having weathered another choppy week of trading in which the market stumbled, but avoided falling on its face.
Two familiar catalysts drove much of the volatility—AI and oil prices. Concerns that future profits and earnings may not justify the amount of money some companies are spending on AI interrupted a tech sector rebound, while soaring oil prices kept inflation worries front of mind.
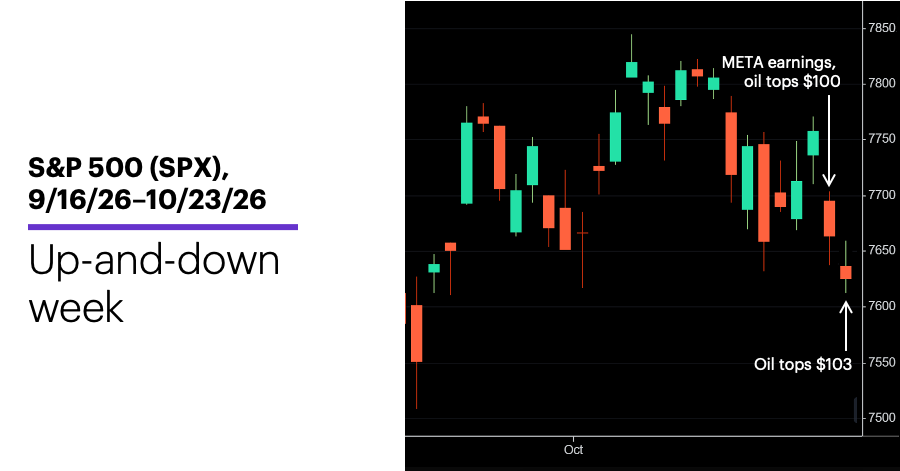
Led by tech, the S&P 500 (SPX) rallied the first three days of last week, but pulled back sharply Thursday as AI stocks retreated and US oil futures climbed above $100 intraday. A temporary bounce in tech shares on Friday looked like it might give the SPX a shot at an up day—and, possibly, week—but oil’s continued push (above $103) appeared to undermine bullish enthusiasm as the day wore on:
Source: Power E*TRADE. (For illustrative purposes. Not a recommendation. Note: It is not possible to invest in an index.)
The headline: Stock indexes mixed amid AI and oil volatility.
The fine print: Meta (META) wasn’t last Thursday’s biggest decliner, but its high profile gave it an outsized influence on sentiment. Despite topping its headline earnings numbers, the stock dropped 7% as the company raised its full-year capex estimate to $135-$140 billion, and reported Q3 cash flow was negative by more than $2 billion. The declines in META and fellow hyperscaler Alphabet (GOOGL) were a big reason communication services was the weakest SPX sector last week.
The number: 9, the number of days (including today) remaining until the November 3 midterm elections. Morgan Stanley & Co. strategists believe conditions favor the Democrats gaining control of the House of Representatives, but they also note “midterms typically don't produce outsized market over- or under-performance over the next three to six months.”1
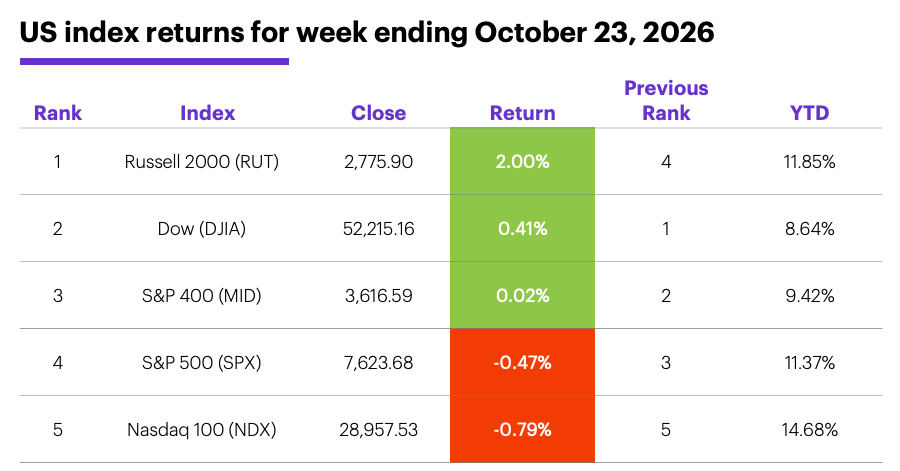
The scorecard: The indexes with the least exposure to the “AI trade” performed best last week:
Source (data): Power E*TRADE. (For illustrative purposes. Not a recommendation.)
S&P 500 sector returns: The strongest S&P 500 sectors last week were energy (+1.7%), health care (+1.4%), and utilities (+0.8%). The weakest sectors were communication services (-5.9%), industrials (-1.6%), and tech (-0.2%).
S&P 500 stock movers: Last week’s biggest gains were Hasbro (HAS) +19% to $117.44, Charles River Laboratories (CRL) +15% to $345.37. The biggest losses were Comfort Systems (FIX) -19% to $1,160.86, Howmet Aerospace (HWM) -16% to $185.91. Other moves: Silence Therapeutics (SLN) +126% to $19.58 on Monday, Braze (BRZE) +51% to $45.57 on Tuesday, TTM Technologies (TTMI) -28% to $73.89 on Thursday.
Yields and the dollar: The benchmark 10-year US Treasury yield fell 11 basis points (0.11%) to 4.97% last week, mostly because of a “flight-to-safety” move during Thursday’s stock sell-off. The US Dollar Index (DXY) dipped 0.03 to 101.81.
Commodity futures: WTI crude oil futures (CLZ6) climbed $4.25 to a new contract high of $103.27 last week. Spot gold ended the week below $4,000, while December gold futures (GCZ6) fell $173.20 to $4,007.90. Biggest gains: December Brent crude oil (BZ6) +6.2%, December WTI crude oil (CLZ6) +4.3%. Biggest declines: December natural gas (NGZ6) -9.9%, November ethanol (ZKX6) -9.3%.
Crypto: Bitcoin -0.5% to $81,074.19 last week, Ether -1.5% to $2,384.08.
Coming this week
An interest rate announcement headlines this week’s packed economic calendar (the odds that the Fed will leave rates unchanged have been hovering around 90%), which also includes the first estimate of Q3 GDP, Fed inflation (PCE Price Index), and housing prices:
●Monday: Chicago Fed National Activity Index
●Tuesday: Durable Goods Orders, S&P Case-Shiller Home Price Index, FHFA House Price Index, Consumer Confidence, New Home Sales, Fed meeting starts
●Wednesday: Goods Trade Balance (advance), Retail and Wholesale Inventories, Fed interest rate decision
●Thursday: Q3 GDP (initial estimate), PCE Price Index, Personal Income and Spending
●Friday: Employment Cost Index, Chicago PMI
This week’s earnings theme is “big”—big tech (more Mag-7), big pharma, big oil, and big consumer names. Here’s a sample:
●Monday: Electronic Arts (EA), Logitech (LOGI), Public Storage (PSA), Rambus (RMBS), Southern Copper (SCCO), Verizon (VZ), Whirlpool (WHR)
●Tuesday: Boeing (BA), Enphase (ENPH), Coca Cola (KO), Novartis (NVS), NXP Semiconductors (NXPI), PayPal (PYPL), United Parcel Service (UPS), Visa (V)
●Wednesday: Carvana (CVNA), Ford (F), GE Vernova (GEV), Alphabet (GOOGL), Honeywell Aerospace (HONA), Microsoft (MSFT), Motorola (MSI), O'Reilly Automotive (ORLY), Phillips 66 (PSX), Reddit (RDDT), Silicon Motion Technology (SIMO)
●Thursday: Amazon (AMZN), Baxter (BAX), Bristol Myers Squibb (BMY), Anheuser-Busch InBev (BUD), Caterpillar (CAT), Coinbase (COIN), Hershey (HSY), Intel (INTC), Eli Lilly (LLY), Mastercard (MA), Merck (MRK), Roblox (RBLX), Sandisk (SNDK), ExxonMobil (XOM)
●Friday: AbbVie (ABBV), AstraZeneca (AZN), BP (BP), Colgate-Palmolive (CL), Chevron (CVX), General Dynamics (GD), Regeneron (REGN)
High(er) VIX a good thing?
As the SPX was getting ready to post its lowest close in more than 10 weeks last Friday, some traders may have been hoping the Cboe Volatility Index (VIX) would close lower than it had the previous week—the idea being that a weekly decline in the market’s go-to “anxiety” index (while the stock market was declining) could signal sentiment shift and potential rebound.
That off-the-cuff logic may have been sound, but the statistics tell a different story. Since 1990, the VIX has closed lower the same week the SPX closed at a new 10-week (or longer) low only nine times, and the next week it was more likely to close lower than higher.2 In fact, the SPX was more likely to close lower the week following any new 10-week low.
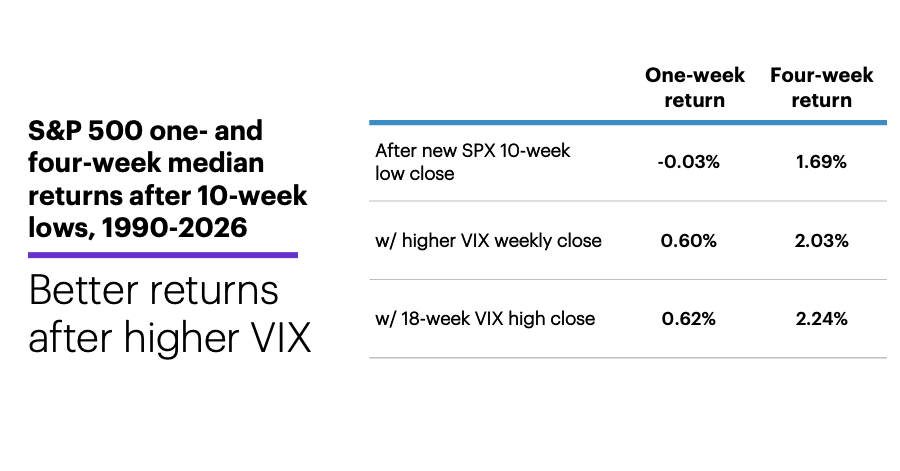
In the near-term, the following table suggests that, based on the historical record, bulls should probably have wished for exactly what they got—a higher VIX weekly close. The following table shows the SPX’s median one- and four-week returns after all new SPX 10-week (or-longer) weekly low closes, plus those that were accompanied by 1) a higher VIX weekly close, and 2) an 18-week (or longer) high VIX weekly close:
Source (data): Power E*TRADE Pro. (For illustrative purposes. Not a recommendation. Note: It is not possible to invest in an index.)
In other words, the SPX’s typical return was higher both one and four weeks after the SPX closed at a 10-week-or-longer low when the VIX closed higher that week, and was slightly higher when the VIX close was the highest in at least 18 weeks.
Click here to log on to your account or learn more about E*TRADE's trading platforms, or follow the Company on X (Twitter), @ETRADE, for useful trading and investing insights.
1 MorganStanley.com. Midterm FAQs: Two Weeks Out. 10/20/26.
2 All figures reflect S&P 500 (SPX) weekly prices, 1990-2026. A “new SPX 10-week low close” refers to a weekly close that is lower than the 10 previous weekly closes, following a week that did not set a 10-week low close. Supporting document available upon request.