July market patterns
- Recent July strength an exception to historical rule
- Positive month for S&P 500 10 years in a row
- Gains tended to cluster early in the month
On a longer-term basis, July’s stock market performance hasn’t been exceptional. July has been a positive month for the S&P 500 (SPX) in 38 of the past 68 years, with a median return of 1.14%—the fourth- and fifth-lowest figures, respectively, among all months.1
Recent history has been a very different story. In fact, last year July posted its 10th-straight positive SPX return—the longest run of any month since 1957 except for May’s 13 positive returns from 1985-1997:

Source (data): Power E*TRADE. (For illustrative purposes. Not a recommendation. Note: It is not possible to invest directly in an index.)
This streak is the primary reason for July’s above-average net performance over the most recent 34 years. Since 1991, July has the third-highest median return (1.8%), and is tied for third place in terms of how often it was an up month (22 of 34 years, or 65%). By contrast, from 1991-2014, July was last in both metrics.
Turning to intramonth behavior, the following chart shows July’s average returns for each trading day of the month since 1991. Most of the stronger days tended to occur in the first half of the month (i.e., through trading day 9):
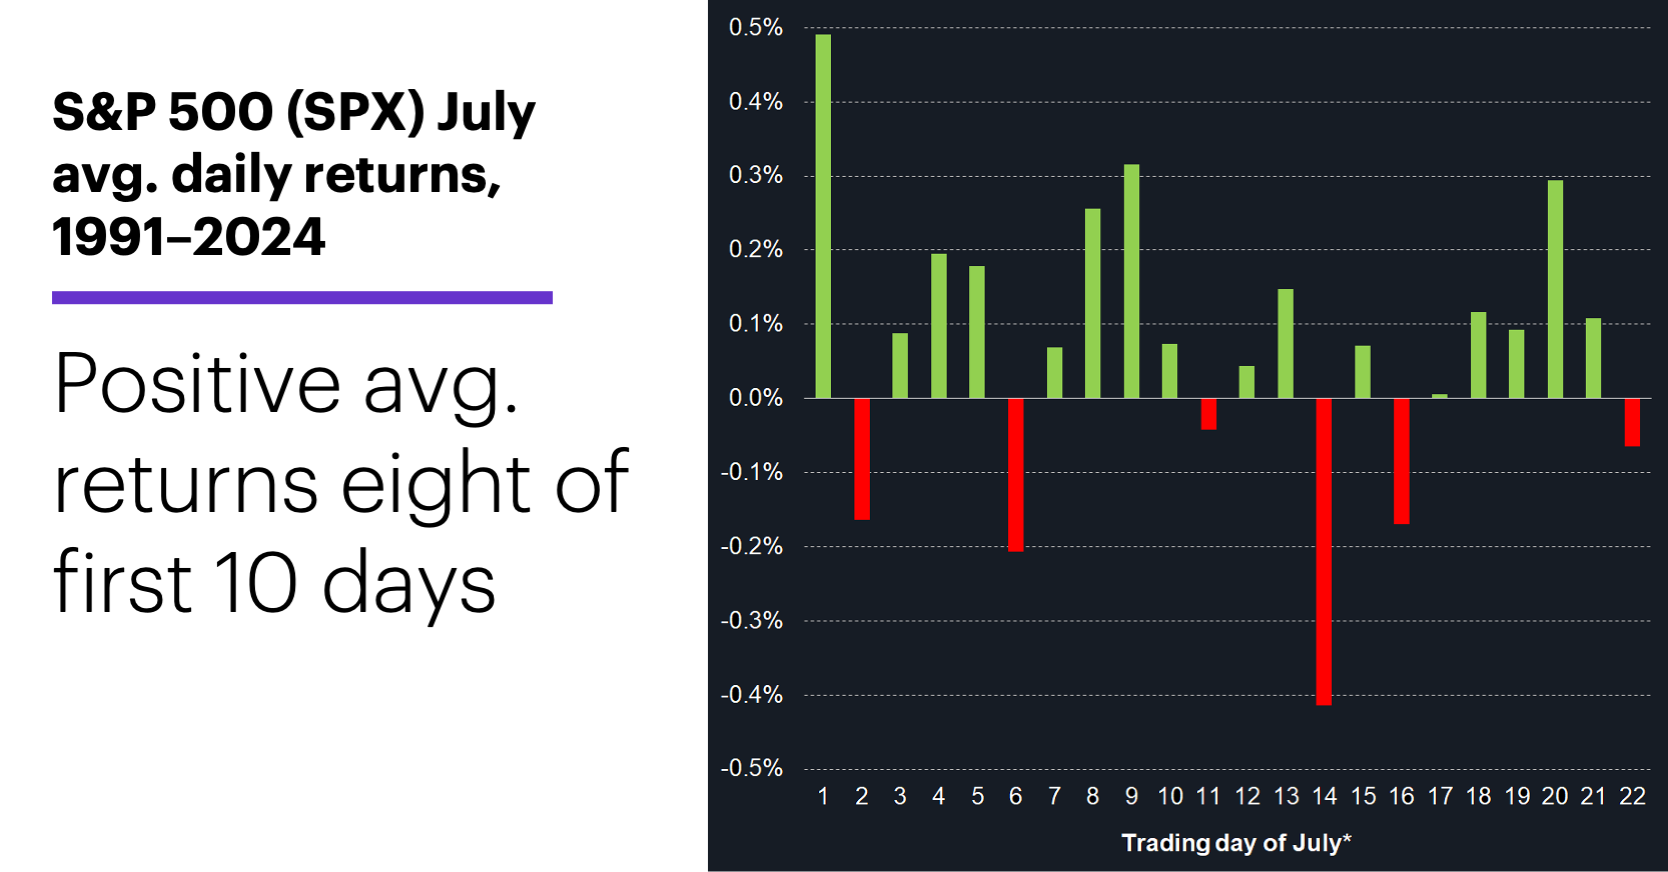
Source (data): Power E*TRADE. (For illustrative purposes. Not a recommendation. Note: It is not possible to invest directly in an index. * Depending on the year, day 21 and 22 may represent the first or second trading day of August rather than the final trading day of July.)
Similarly, up days were more frequent in the early part of the month. The chart below shows only one day in the first nine trading days closed down more often than up (day 2). Two minor, but interesting, details: The first trading day of July not only had the largest average positive return, it was also the day that closed higher most often (30 of 34 years). Similarly, day 14 had the largest average loss, and it also closed higher least often (11 of 34 years):
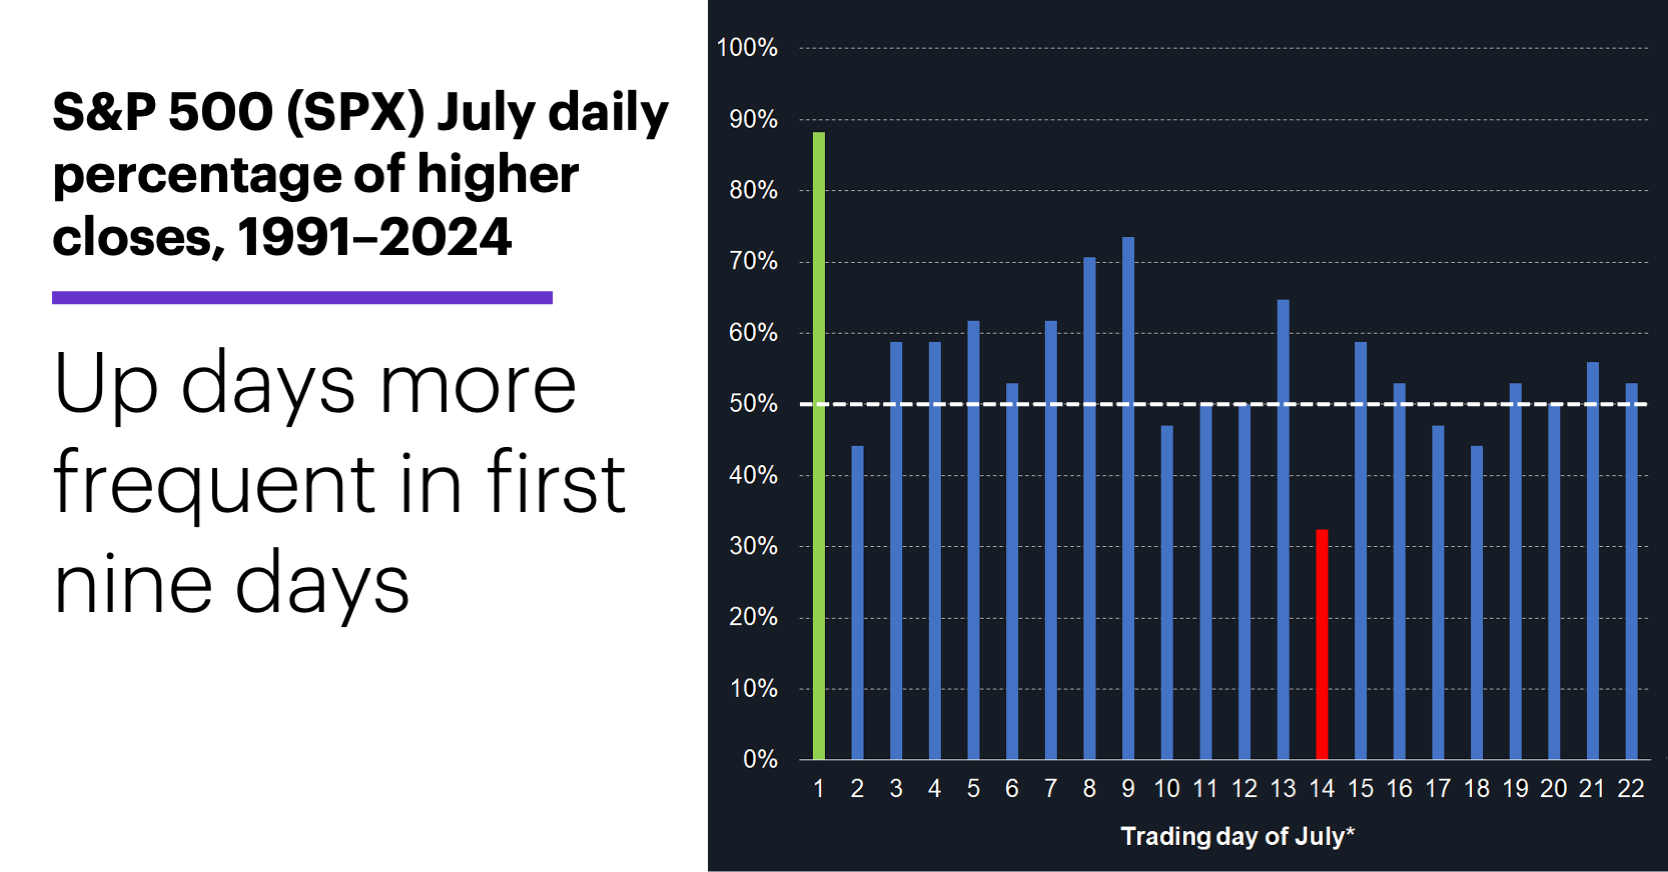
Source: Power E*TRADE. (For illustrative purposes. Not a recommendation.)
It’s also worth noting that day 14 was a down day more often than not during July’s most bullish period—13 of the past 20 years, and six of the past 10.
Today’s numbers include (all times ET): job cuts (7:30 a.m.), ADP private employment (8:15 a.m.), EIA Petroleum Status Report (10:30 a.m.).
Click here to log on to your account or learn more about E*TRADE's trading platforms, or follow the Company on Twitter, @ETRADE, for useful trading and investing insights.
1 All figures reflect S&P 500 (SPX) monthly and daily closing prices, 1957–2024. Supporting document available upon request. Note: Depending on the year, in charts 2 and 3 day 21 and 22 may represent the first or second trading day of August rather than the final trading day of July.