Market Dashboard
New every Monday with last week’s recap and notes on the week ahead.
Last update: 10/20/2025
US stocks rebounded after a rocky start, buoyed by optimism about US-China relations and dovish signals from Federal Reserve Chair Jerome Powell. Gold continued its historic rally, surpassing $4,200 per troy ounce while the US dollar weakened. Credit markets showed signs of stress as investors pulled billions from high-yield bonds. Manufacturing surveys painted a mixed picture, while small business optimism dipped amid ongoing supply chain and inflation pressures.
US stocks rebound after volatile week
- Markets bounced back after a volatile start to the week as investors felt more confident about US-China relations and the Federal Reserve hinted at lowering interest rates.
- The S&P 500 rose 1.7% for the week, slightly below its all-time high.
- The Nasdaq rose 2.1%, while the Russell 2000 increased 2.4%.
- Despite the gains, investors are still skittish. The CBOE Volatility Index (VIX), also known as the fear index, declined after hitting a high of 28 earlier in the week, but continued to hover at elevated levels of 20.
Gold shines as dollar weakens
- Gold had its largest weekly gain since 2020, surpassing $4,200 per troy ounce, a new all-time high.
- Correlation with the US dollar and cryptocurrencies is declining. The US dollar showed its greatest weekly loss since August.
- The total market value of cryptocurrencies declined by $600 billion as investors favored traditional gold over digital alternatives.
Credit markets show some warning signs
- A sell-off in regional bank stocks raised concerns about the health of the credit market.
- High-yield bond funds saw $3 billion in outflows during the week, while the cost of insuring against corporate defaults rose, signaling growing concern about borrowers’ ability to repay debts.
- The yield curve steepened modestly with the two-year US Treasury yield dropping 4 basis points to 3.46%, its lowest level since September 2022, while the 10-year yield declined by around 3 basis points to 4%.
- Private credit indexes such as the Cliffwater BDC Index and MS Private Credit Proxy Index both show losses for the year.
Powell signals Fed ready to ease
- Federal Reserve Chair Jerome Powell acknowledged labor market weakness and hinted at ending quantitative tightening during his speech at the National Association for Business Economics, lifting risk assets.
- Fed funds futures now price in a greater than 100% probability of 25 basis point rate cuts at both the October and December FOMC meetings.
Manufacturing outlook mixed
- October Manufacturing surveys showed mixed results. The New York Fed’s Empire Manufacturing Survey rebounded to 10.7, nearly reversing September’s 21-point drop, while the Philadelphia Fed Manufacturing Survey dropped 26 points to -12.8, its lowest reading since April.
- In the Philadelphia survey, price pressures persisted with no firms reporting price decreases. However, manufacturers remained optimistic about future orders and shipments.
Small business confidence slips
- The NFIB Small Business Optimism Index fell to 98.8 in October, the first decline in small-business sentiment since the passage of the One Big Beautiful Bill Act (OBBBA) in July.
- Supply chain issues affected 64% of businesses, while 14% cited inflation as their top challenge.
- Despite the dip, hiring plans reached its highest level since January, with 16% of business owners intending to create new jobs within three months.
Homebuilder sentiment jumps on lower rates
- Homebuilder confidence posted its largest increase since 2024, with the NAHB Index rising 5 points to 37 as mortgage rates declined.
- MBA mortgage applications increased to -4.7% from -12.7% in the prior week.
CRC# 4912876 10/2025
How can E*TRADE from Morgan Stanley help?
Playing defense
Find opportunities to invest in companies that may have the ability to weather tough economic times.
Hedging with gold
Discover ways to diversify into a precious metal that many investors consider a potential safe haven when the economy slumps.
Futures
Like options, futures let you lock in a price now for an investment you’ll buy in the future. They cost much less than the actual investment, so you can control a large contract with a relatively small amount of capital.
Certificates of Deposit (CD)
Fixed rates. Annual Percentage Yield up to 1,2
Lock in a competitive fixed rate for terms from to .3
Morgan Stanley Private Bank, Member FDIC.
Cross-Asset Performance Table
Returns and prices of the most popular indices and assets as of 10/17/25.
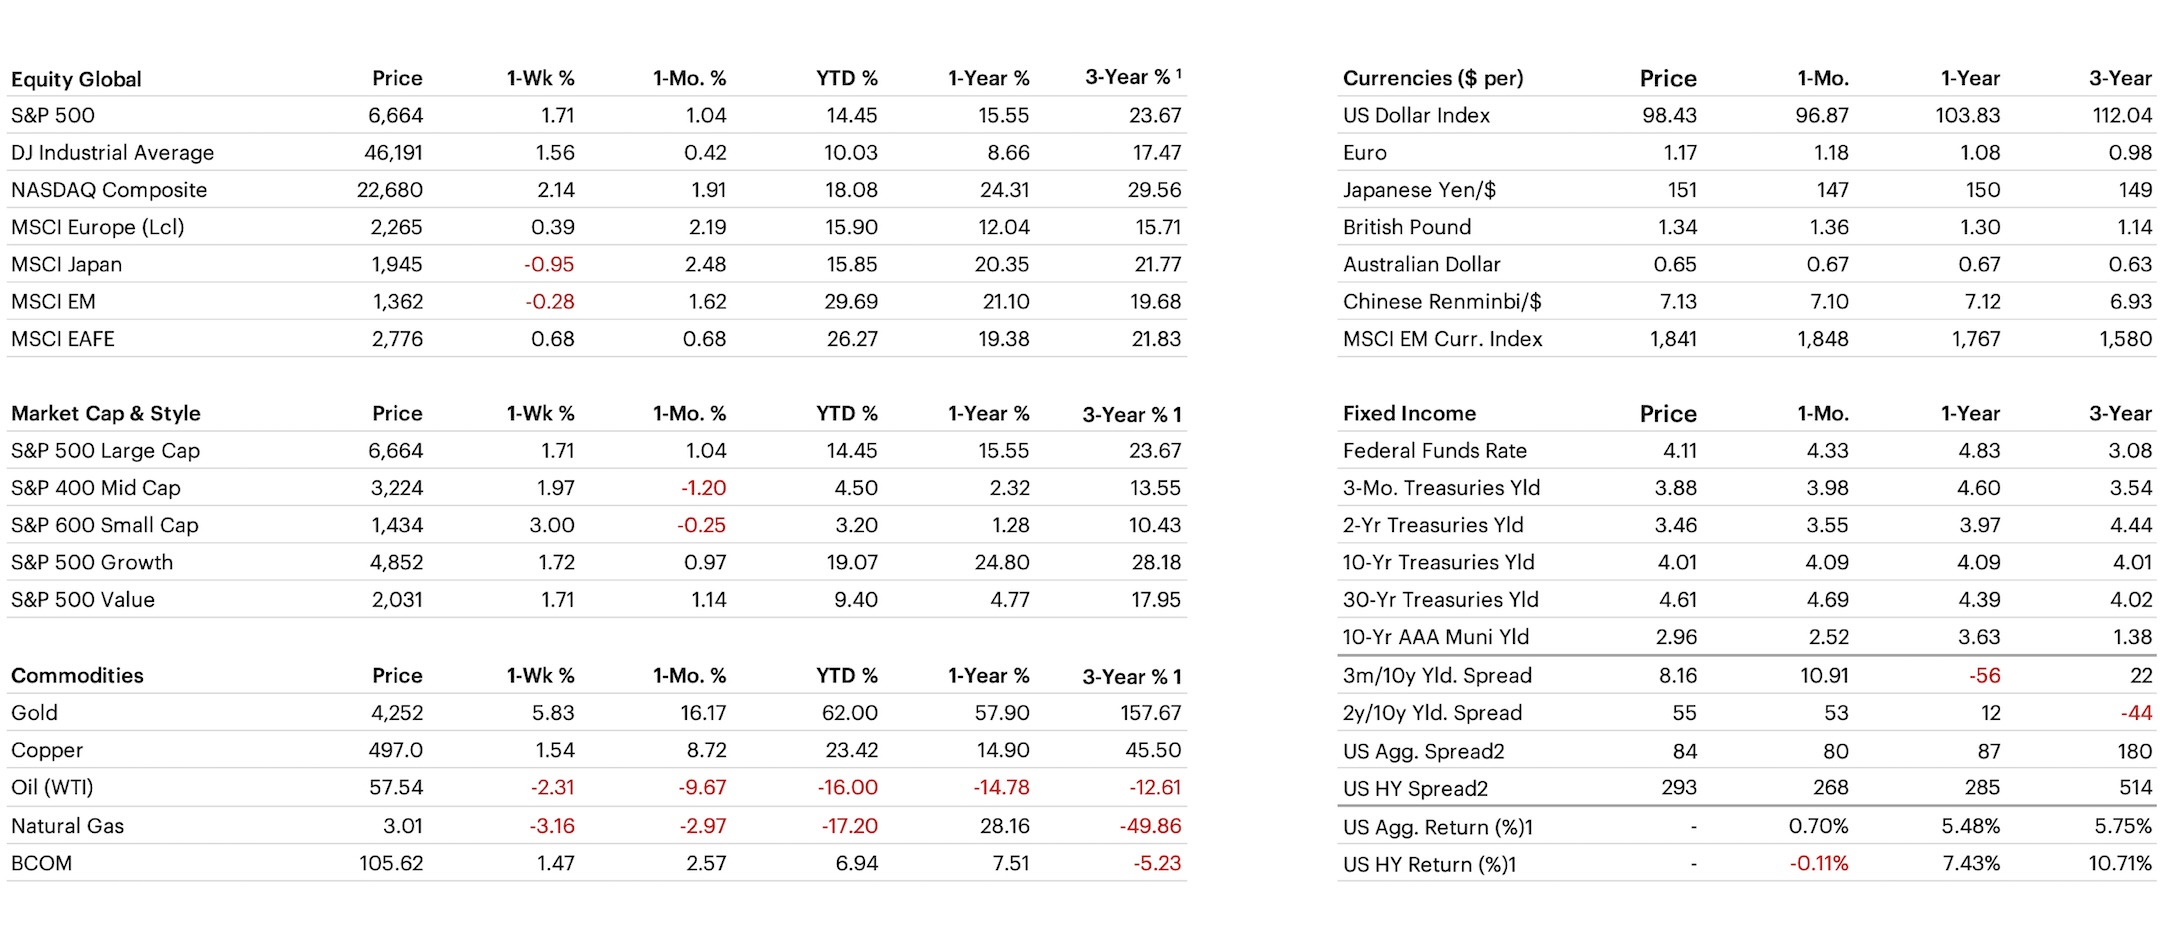
1) Annualized 3-year % return. 2) Option Adjusted Spread (OAS): OAS is a measurement of the spread of a fixed income security rate and the risk-free rate of return, which is adjusted to take into account an embedded option. Equity risk premium is the excess return that an individual stock or the overall stock market provides over a risk-free rate. The risk-free rate represents the interest an investor would expect from an absolutely risk-free investment over a specified period of time. Past performance is not indicative of future results.
S&P 500 Sector Performance
Communication Services and Real Estate were the strongest S&P 500 sectors last week, while Health Care and Financials lagged.
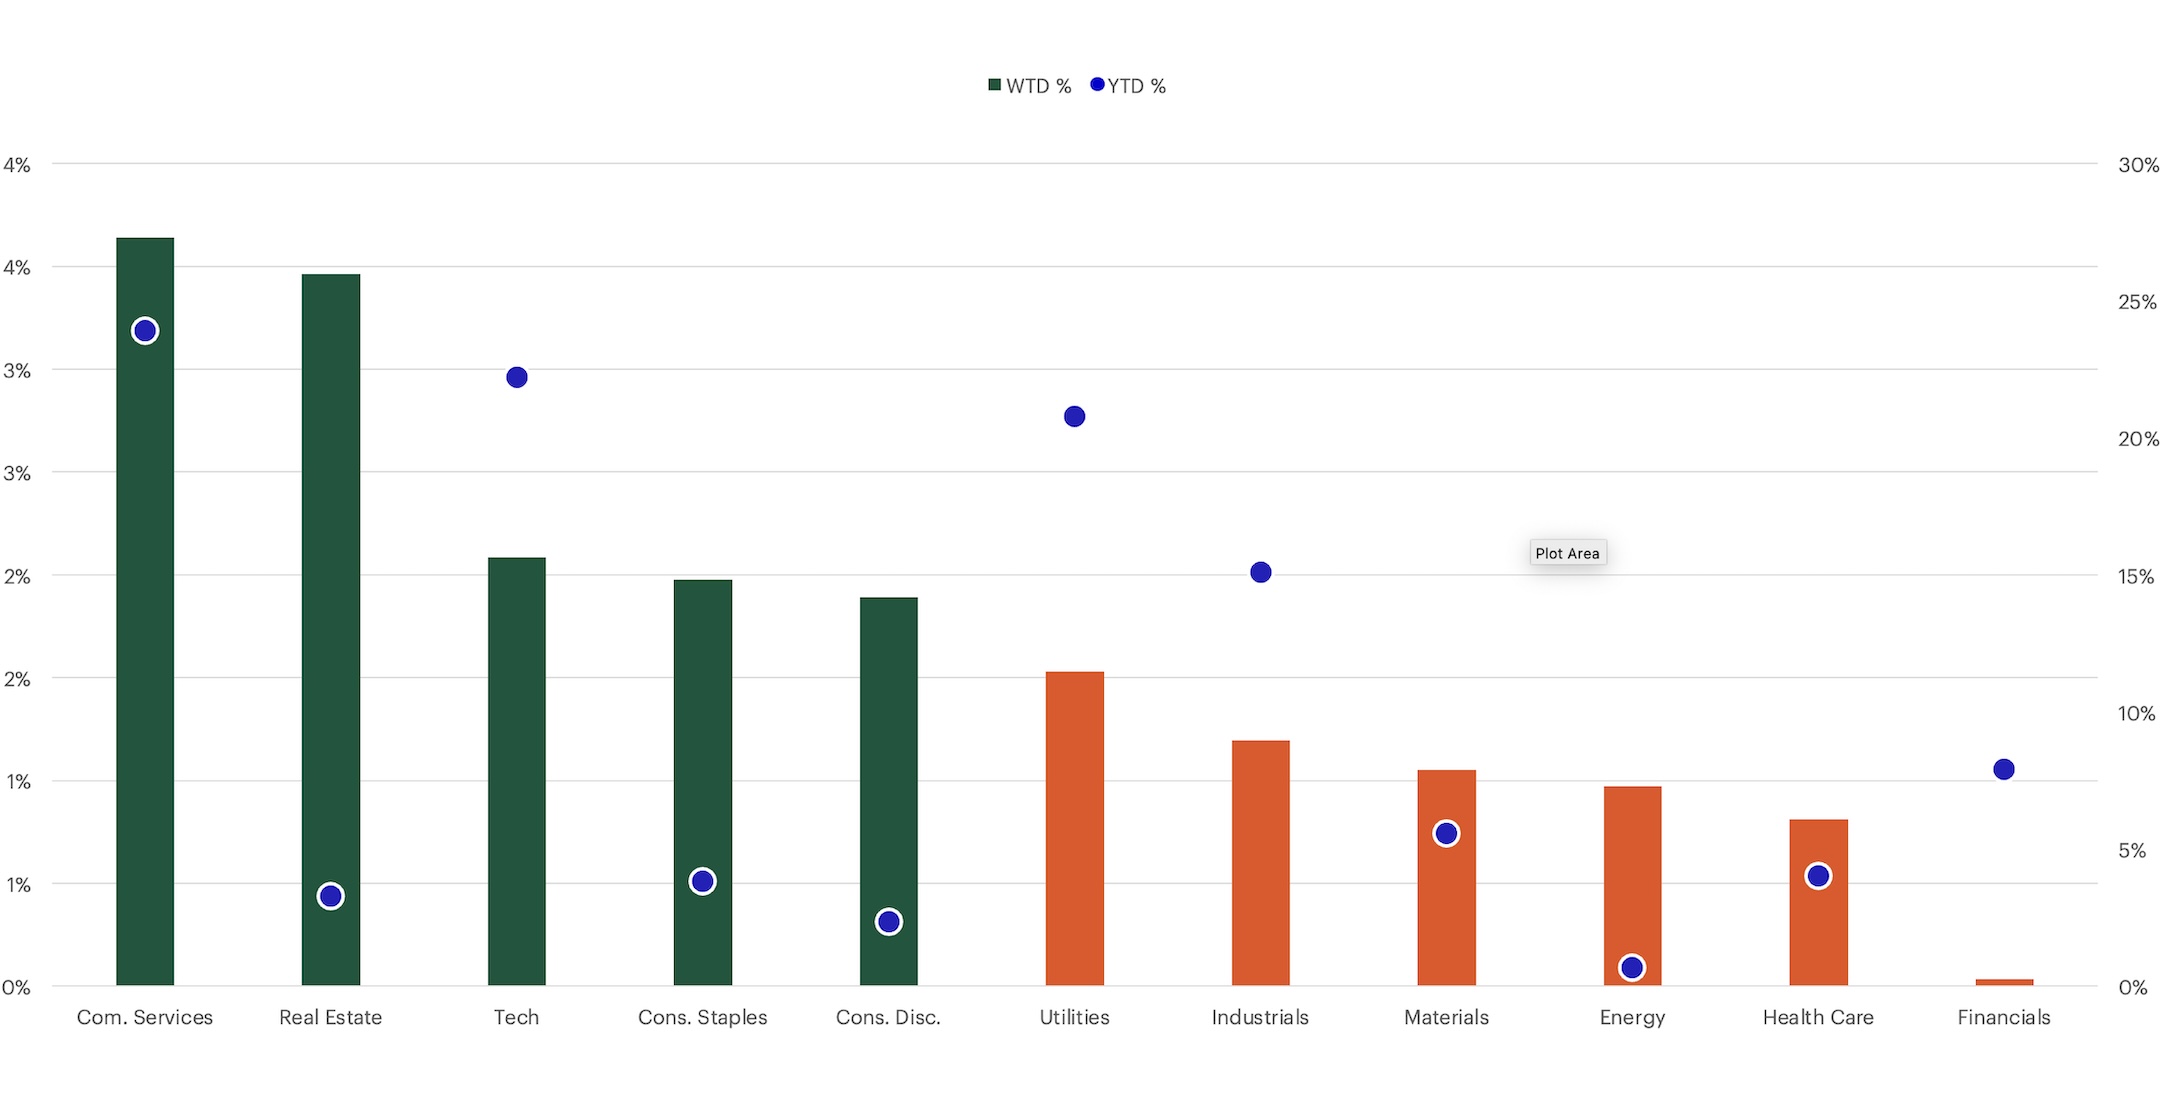
Past performance is not indicative of future results.
Russell US Equity Style Performance
Large-caps outperformed small-cap equities.
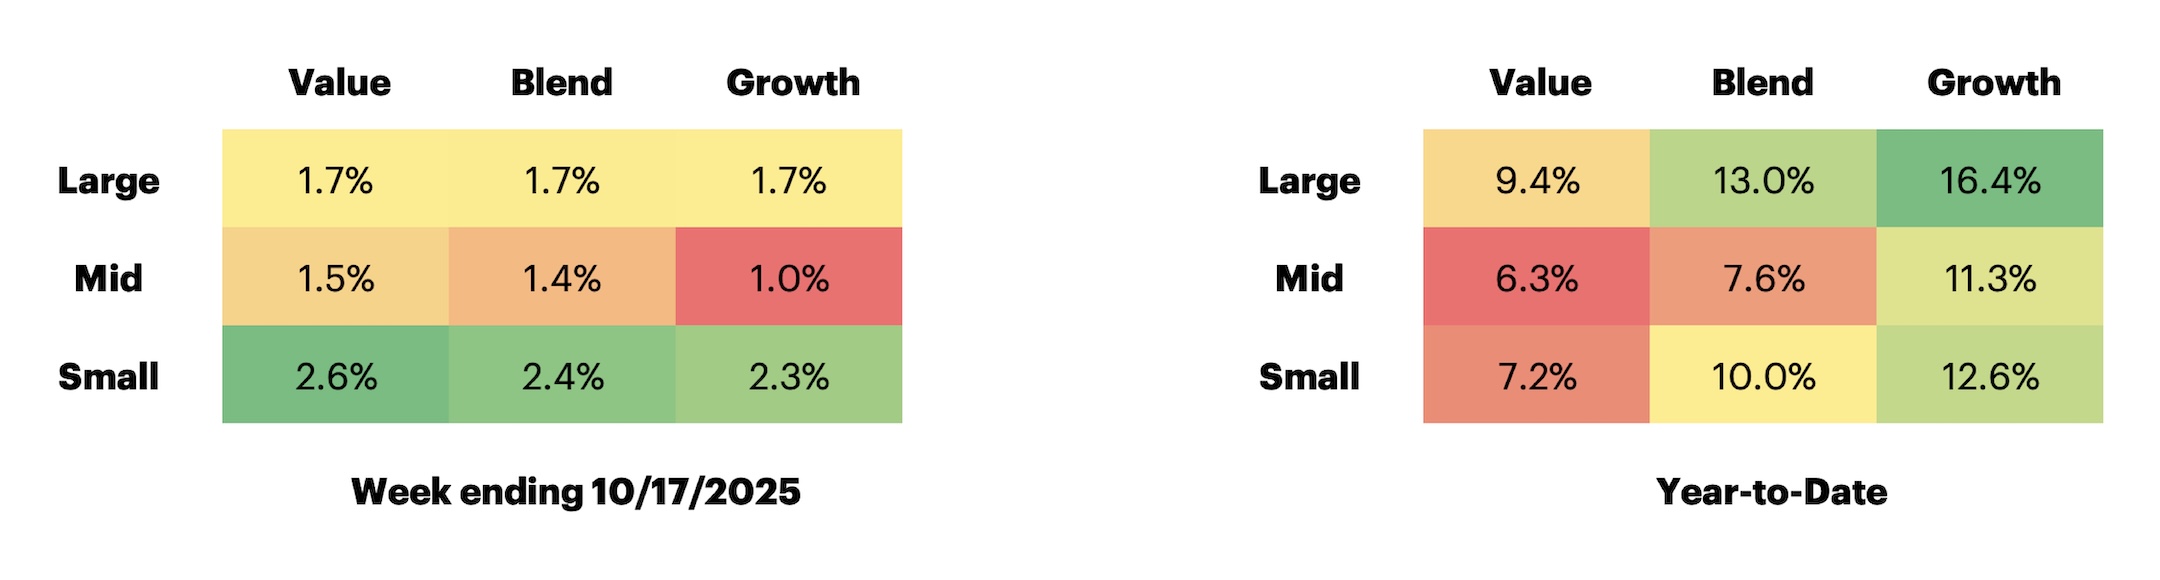
Past performance is not indicative of future results.
US Equity Valuation
S&P 500 Equity Risk Premium
Bonds continue to appear attractive than equities.
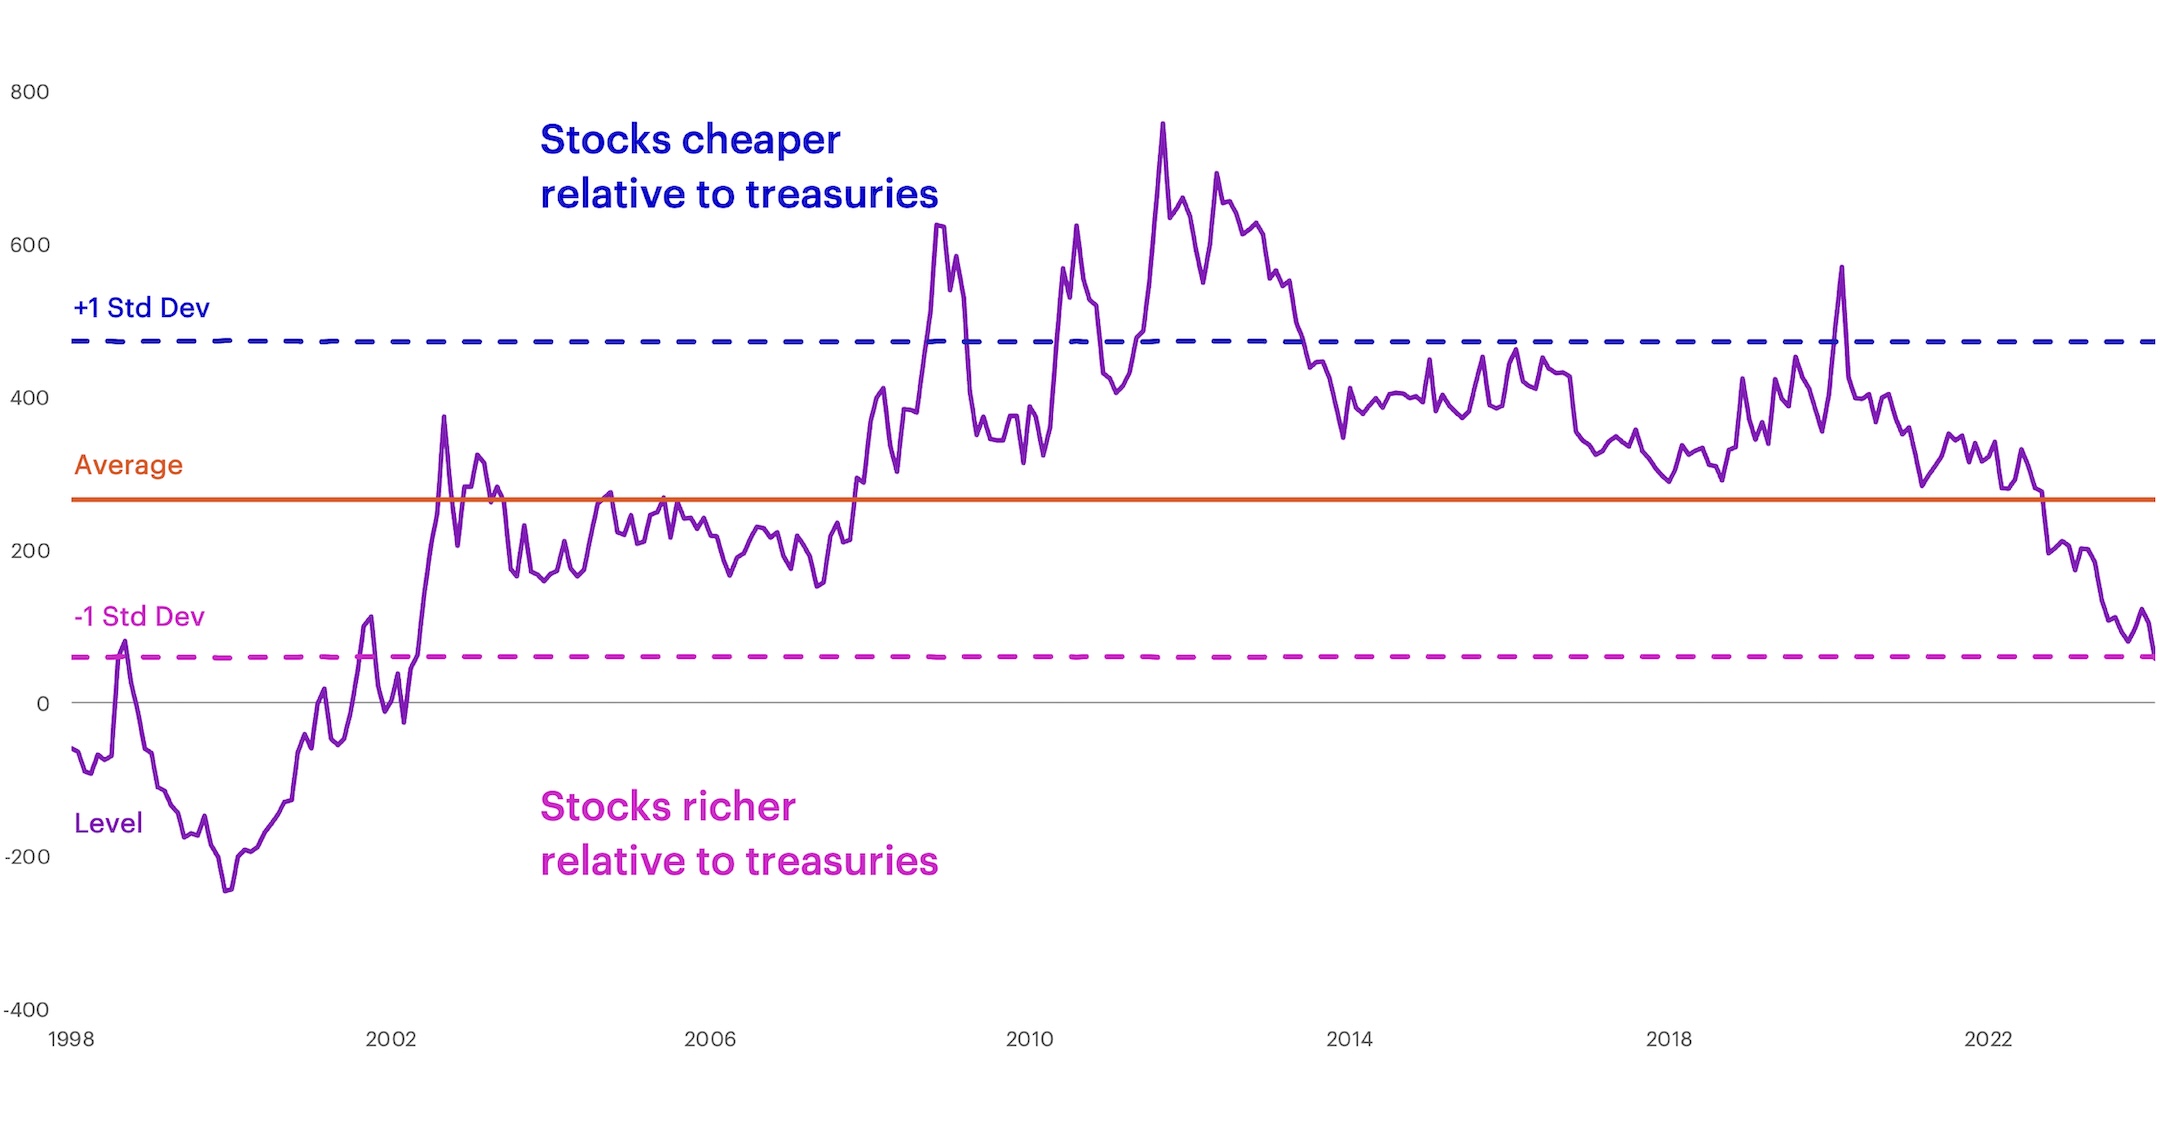
Past performance is not indicative of future results.
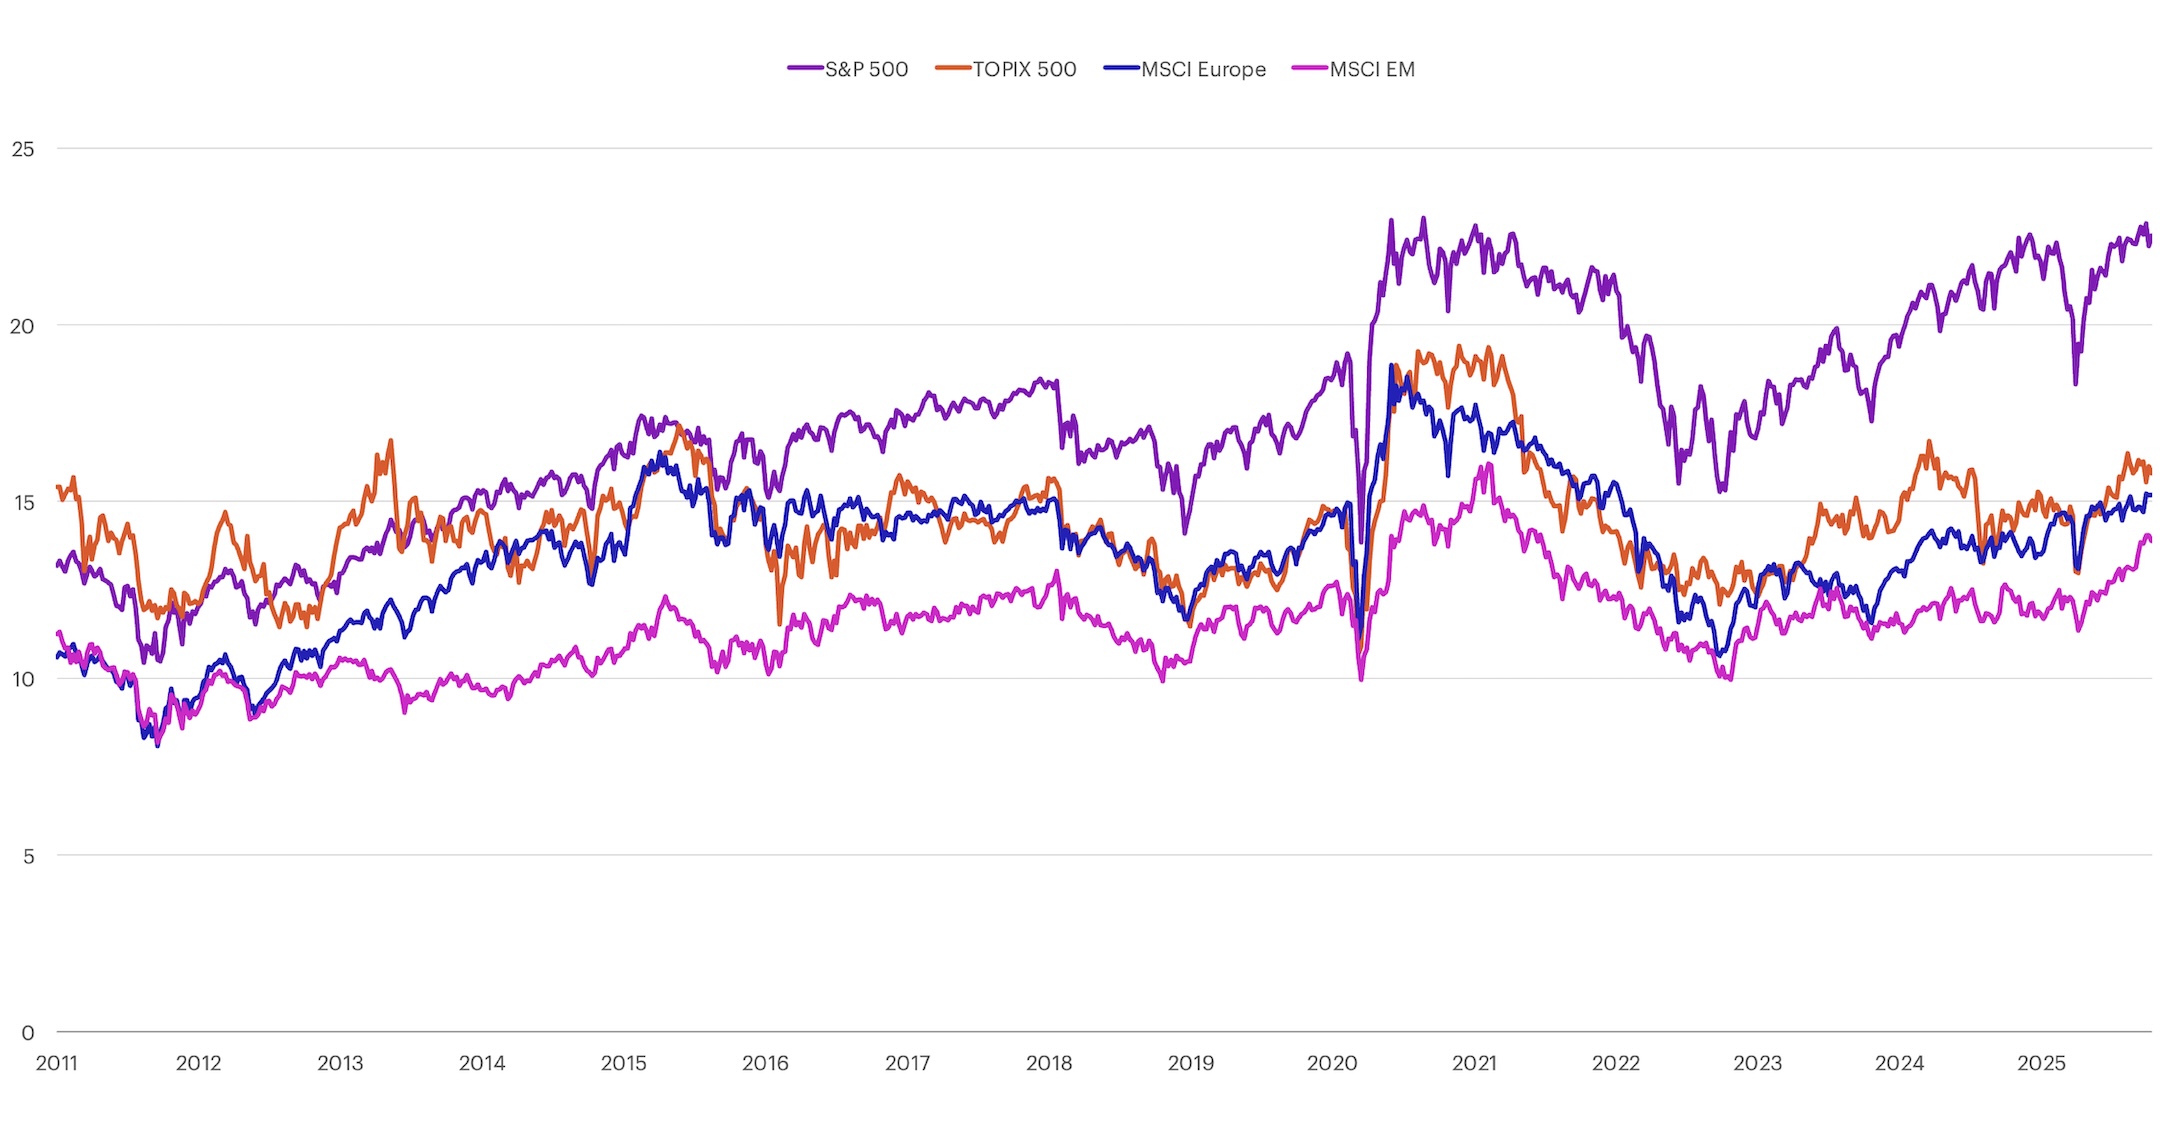
P/E Relative to Rest of World
The S&P 500 remains expensive relative to the rest of the world.
Past performance is not indicative of future results.
US Fixed Income Valuation
The 10-year yield decreased by 3 bp, to 4.00%, and the two-year yield declined by 4 bp, to 3.46%.
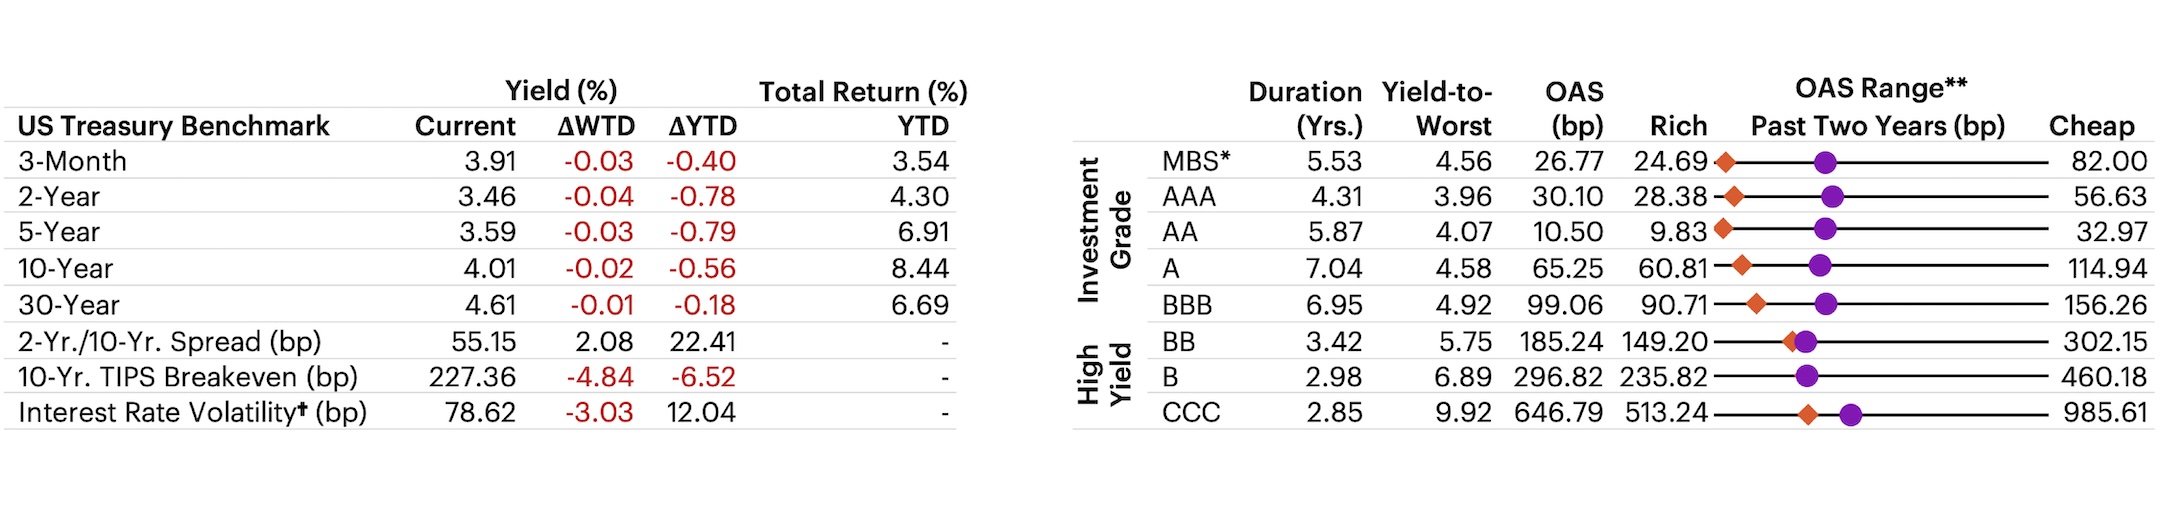
†Interest Rate Volatility as measured by ICE BofAML Option Volatility Estimate Index (MOVE); *Mortgage-backed securities (MBS) are debt obligations that represent claims to the cash flows from pools of mortgage loans, most commonly on residential property. Mortgage loans are purchased from banks, mortgage companies, and other originators and then assembled into pools by a governmental, quasi-governmental, or private entity; **Options Adjusted Spread (OAS): A measurement of the spread of a fixed income security rate and the risk-free rate of return, which is adjusted to take into account an embedded option. Past performance is not indicative of future results.
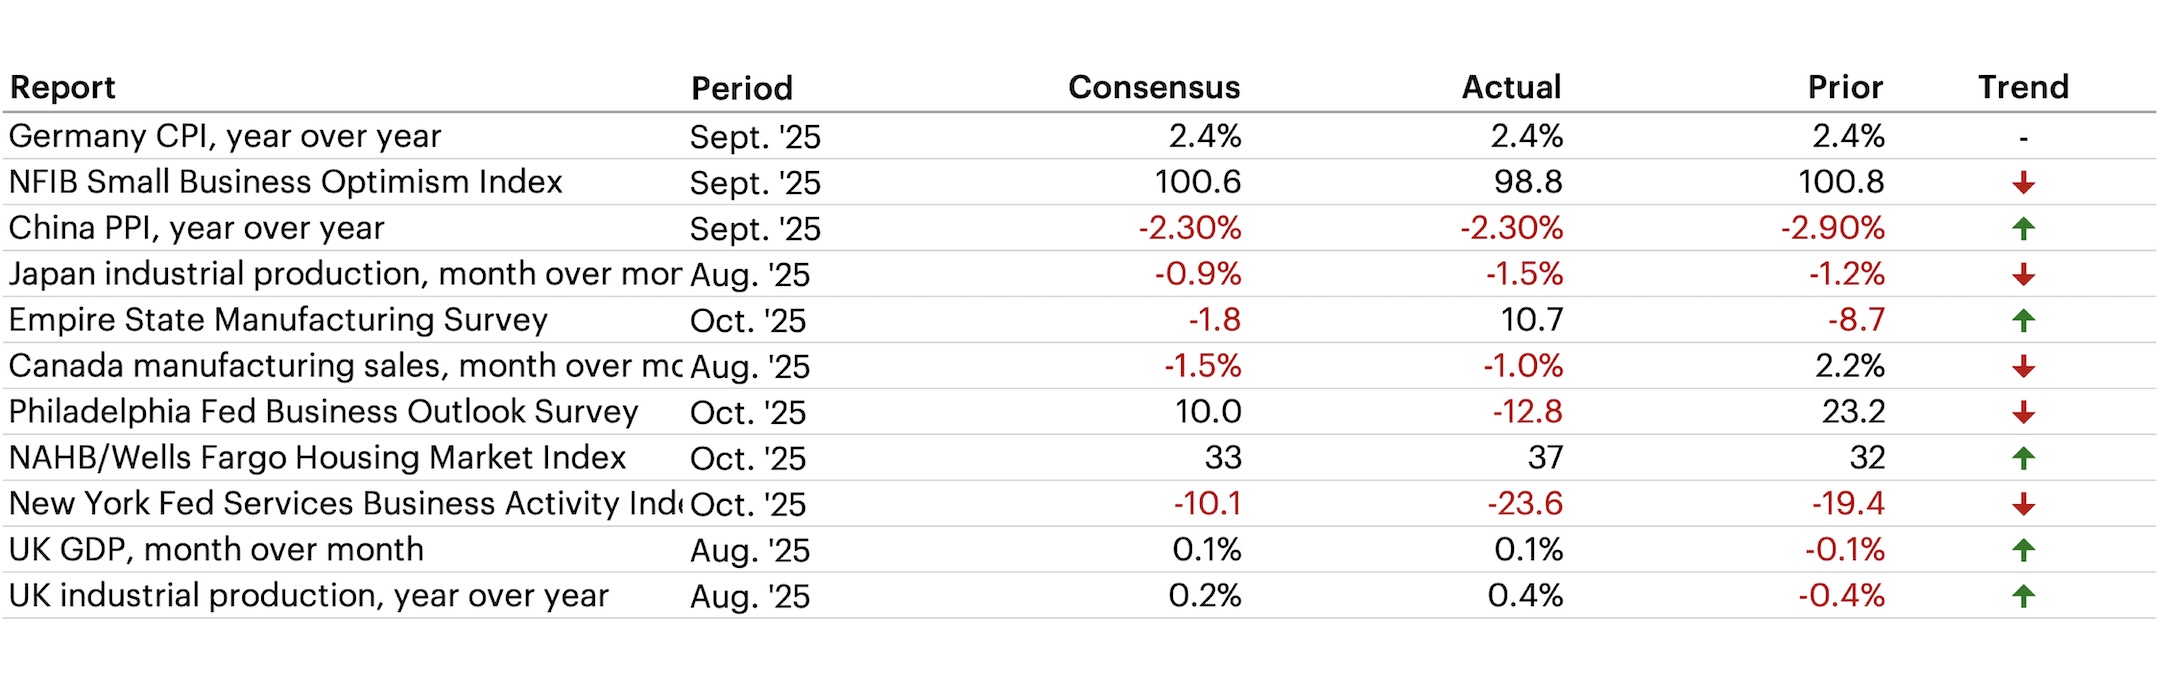
Latest Economic Data
Gold hit a fresh all-time high $4,200 while the US dollar posted its sharpest weekly decline since August. Fed Chair Powell’s dovish remarks lifted risk assets.
The Week Ahead
The week ahead brings Philadelphia Fed Non-Manufacturing Activity, Chicago Fed National Activity, S&P Global PMIs, home sales, and the US CPI report. The 3Q25 earnings season continues with Financials and Technology names scheduled to report.
- Philadelphia Fed Non-Manufacturing Activity Index at 8:30 AM ET
- Netflix, Inc. Reports Earnings
- Coca-Cola Company Reports Earnings
- MBA Mortgage Applications at 7:00 AM ET
- Tesla, Inc. Reports Earnings
- AT&T Inc. Reports Earnings
- Chicago Fed National Activity Index at 8:30 AM ET
- US existing home sales at 10:00 AM ET
- Kansas City Fed Manufacturing Activity Index at 11:00 AM ET
- T-Mobile US, Inc. Reports Earnings
- US CPI at 8:30 AM ET
- US core CPI at 8:30 AM ET
- S&P Global US Manufacturing PMI at 9:45 AM ET
- S&P Global US Services PMI at 9:45 AM ET
- S&P Global US Composite PMI at 9:45 AM ET
- Kansas City Fed Services Activity Index at 11:00 AM ET
- Procter & Gamble Company (The) Reports Earnings
Index benchmarks
Cross-Asset Performance
S&P 500: A market capitalization-weighted index of 500 widely held stocks often used as a proxy for the stock market. It measures the movement of the largest issues. Standard and Poor's chooses the member companies for the 500 based on market size, liquidity and industry group representation. Included are the stocks of industrial, financial, utility, and transportation companies. Since mid-1989, this composition has been more flexible and the number of issues in each sector has varied. The returns presented for the S&P 500 are total returns, including the reinvestment of dividends each month.
Dow Jones Industrial Average: Computed by summing the prices of the stocks of 30 companies and then dividing that total by an adjusted value—one which has been adjusted over the years to account for the effects of stock splits on the prices of the 30 companies. Dividends are reinvested to reflect the actual performance of the underlying securities.
NASDAQ Composite: Measures the performance of all issues listed in the NASDAQ Stock Market, except for rights, warrants, units, and convertible debentures. Morningstar reports the NASDAQ Composite as a price return.
MSCI Europe IMI: This index captures large, mid and small cap representation across 16 Developed Markets countries in Europe. With 1,372 constituents, the index covers approximately 99% of the free float-adjusted market capitalization across the Developed Markets countries of Europe.
MSCI Japan IMI: This index is designed to measure the performance of the large, mid and small cap segments of the Japan market. With 1,134 constituents, the index covers approximately 99% of the free float-adjusted market capitalization in Japan.
MSCI EM (Emerging Markets) Index: A free float-adjusted market-capitalization index that is designed to measure equity market performance of emerging markets. The MSCI Emerging Markets Index consists of the following 23 emerging market country indexes: Brazil, Chile, China, Colombia, Czech Republic, Egypt, Greece, Hungary, India, Indonesia, Korea, Malaysia, Mexico, Peru, Philippines, Poland, Qatar, Russia, South Africa, Taiwan, Thailand, Turkey and United Arab Emirates. For more information, visit the MSCI web site.
MSCI EAFE (Europe, Australasia, Far East) Index: A free float-adjusted market-capitalization index that is designed to measure the equity market performance of developed markets, excluding the U.S. and Canada. The MSCI EAFE Index consists of the following 21 developed market country indexes: Australia, Austria, Belgium, Denmark, Finland, France, Germany, Hong Kong, Ireland, Israel, Italy, Japan, the Netherlands, New Zealand, Norway, Portugal, Singapore, Spain, Sweden, Switzerland, and the United Kingdom. For more information, visit the MSCI website.
S&P 400 Index: This index provides investors with a benchmark for mid-sized companies. The index measures the performance of mid-sized companies, reflecting the distinctive risk and return characteristics of this market segment.
S&P 600 Index: This index measures the small-cap segment of the U.S. equity market. The index is designed to track companies that meet specific inclusion criteria to ensure that they are liquid and financially viable.
S&P 500 Growth: This index is a style-concentrated index designed to track the performance of stocks that exhibit the strongest growth characteristics by using a style-attractiveness-weighting scheme.
S&P 500 Value: This index is a style-concentrated index designed to track the performance of stocks that exhibit the strongest value characteristics by using a style-attractiveness-weighting scheme.
Bloomberg Commodity Index: Made up of 22 exchange-traded futures on physical commodities. The index currently represents 20 commodities, which are weighted to account for economic significance and market liquidity.
US Trade-Weighted Dollar Index: A weighted average of the foreign exchange value of the US dollar against a subset of the broad index currencies that circulate widely outside the US.
MSCI Emerging Markets Currency Index: sets the weights of each currency equal to the relevant country weight in the MSCI Emerging Markets Index.
Bloomberg US Aggregate Index: The US Aggregate Index covers the dollar-denominated investment-grade fixed-rate taxable bond market, including Treasuries, government-related and corporate securities, MBS pass-through securities, asset-backed securities, and commercial mortgage-based securities. These major sectors are subdivided into more specific sub-indices that are calculated and published on an ongoing basis. Total return comprises price appreciation/depreciation and income as a percentage of the original investment. This index is rebalanced monthly by market capitalization.
Bloomberg US Corporate High Yield Bond Index: This index is composed of fixed-rate, publicly issued, non-investment grade debt.
S&P Sector Performance
The S&P 500 Consumer Discretionary sector comprises those companies included in the S&P 500 that are classified as members of the consumer discretionary sector.
The S&P 500 Consumer Staples sector comprises those companies included in the S&P 500 that are classified as members of the consumer staples sector.
The S&P 500 Energy sector comprises those companies included in the S&P 500 that are classified as members of the energy sector.
The S&P 500 Financials sector comprises those companies included in the S&P 500 that are classified as members of the financial sector.
The S&P 500 Health Care sector comprises those companies included in the S&P 500 that are classified as members of the health care sector.
The S&P 500 Industrials Sector comprises those companies included in the S&P 500 that are classified as members of the industrials sector.
The S&P 500 Information Technology Sector comprises those companies included in the S&P 500 that are classified as members of the information technology sector.
The S&P 500 Materials Sector comprises those companies included in the S&P 500 that are classified as members of the materials sector.
The S&P 500 Communications Services Sector comprises those companies included in the S&P 500 that are classified as members of the telecommunications services sector.
The S&P 500 Utilities Sector comprises those companies included in the S&P 500 that are classified as members of the utilities sector.
The S&P 500 Real Estate Sector comprises those companies included in the S&P 500 that are classified as members of the real estate sector.
US Equity Style Performance
Weekly and monthly style performance charts use Russell 1000, Russell Mid Cap, and Russell 2000 style indexes to represent large cap, mid cap, and small cap respectively.
Russell 1000: Consists of the 1000 largest companies within the Russell 3000 index. Also known as the Market-Oriented Index, because it represents the group of stocks from which most active money managers choose. The returns we publish for the index are total returns, which include reinvestment of dividends. Frank Russell Company reports its indexes as one-month total returns.
Russell 1000 Growth: Market-capitalization weighted index of those firms in the Russell 1000 with higher price-to-book ratios and higher forecasted growth values. The Russell 1000 includes the largest 1000 firms in the Russell 3000, which represents approximately 98% of the investable US equity market.
Russell 1000 Value: Market-capitalization weighted index of those firms in the Russell 1000 with lower price-to-book ratios and lower forecasted growth values. The Russell 1000 includes the largest 1000 firms in the Russell 3000, which represents approximately 98% of the investable US equity market.
Russell 2000: Consists of the smallest 2000 companies in the Russell 3000 Index, representing approximately 7% of the Russell 3000 total market capitalization. The returns we publish for the index are total returns, which include reinvestment of dividends.
Russell 2000 Growth: Market-weighted total return index that measures the performance of companies within the Russell 2000 Index having higher price-to-book ratios and higher forecasted growth values. The Russell 2000 Index includes the 2000 firms from the Russell 3000 Index with the smallest market capitalizations. The Russell 3000 Index represents 98% of the of the investable US equity market.
Russell 2000 Value: Market-weighted total return index that measures the performance of companies within the Russell 2000 Index having lower price-to-book ratios and lower forecasted growth values. The Russell 2000 Index includes the 2000 firms from the Russell 3000 Index with the smallest market capitalizations. The Russell 3000 Index represents 98% of the of the investable US equity market.
Russell Midcap: Measures the performance of the 800 smallest companies in the Russell 1000 Index, which represent approximately 25% of the total market capitalization of the Russell 1000 Index. As of the latest reconstitution, the average market capitalization was approximately $4.0 billion; the median market capitalization was approximately $2.9 billion. The largest company in the index had an approximate market capitalization of $12 billion.
Russell Midcap Growth: Market-weighted total return index that measures the performance of companies within the Russell Midcap Index having higher price-to-book ratios and higher forecasted growth values. The Russell Midcap Index includes firms 201 through 1000, based on market capitalization, from the Russell 3000 Index. The Russell 3000 Index represents 98% of the of the investable U.S. equity market.
Russell Midcap Value: Market-weighted total return index that measures the performance of companies within the Russell Midcap Index having lower price-to-book ratios and lower forecasted growth values. The Russell Midcap Index includes firms 201 through 1000, based on market capitalization, from the Russell 3000 Index. The Russell 3000 Index represents 98% of the of the investable U.S. equity market.
P/E Relative to Rest of World
TOPIX: This free-floated-adjusted index tracks all domestic companies of the exchange’s First Section.
US Fixed Income Valuation
ICE BofAML Option Volatility Estimate Index (MOVE): A yield curve-weighted index of the normalized implied volatility on one-month treasury option.
An investment cannot be made directly in a market index.