VIX makes an appearance on the wall
- VIX fell below 15 on Tuesday
- Lowest close in more than seven months
- Specific VIX levels can be misleading guides
The stock market, as is often said, climbs a “wall of worry,” and the higher it climbs, the more worries it tends to accumulate.
The US market’s latest push to record levels appeared to bring a new worry to light in some circles—the low level of the Cboe Volatility Index (VIX), which on Tuesday fell 4.8% to close below 15—its lowest level since January—as the S&P 500 came up just short of another record close:
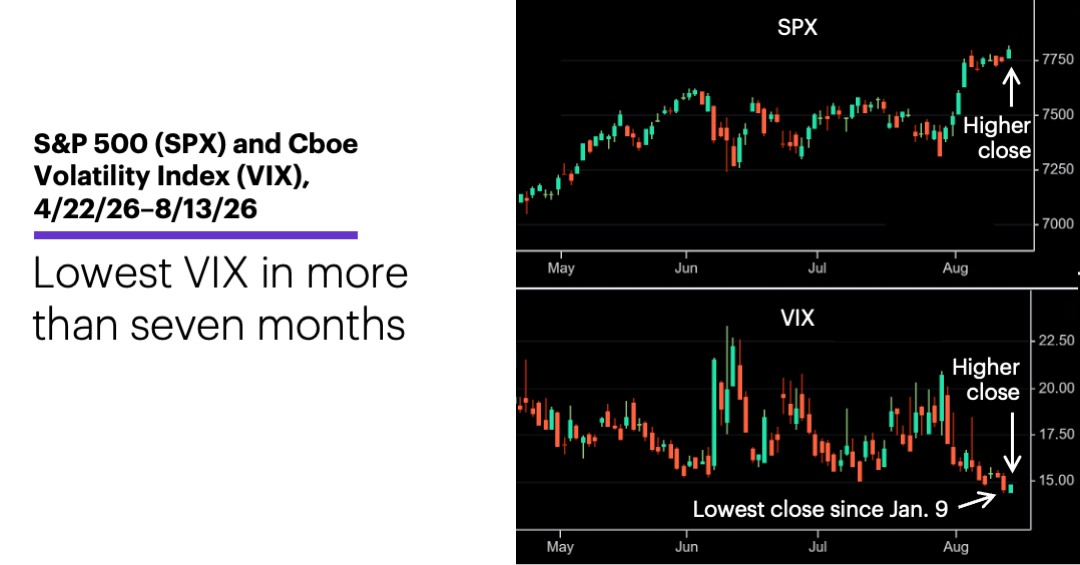
Source: Power E*TRADE. (For illustrative purposes. Not a recommendation.)
Because the VIX typically moves in the opposite direction of the SPX, this decline as the market pushed to new highs doesn’t necessarily represent unusual behavior. However, some market watchers have called out the VIX’s relatively low level as a sign of potential “complacency”—that is, a sign that investors may be underestimating possible risks (e.g., geopolitics, “peak earnings,” uncertain Fed policy) and overestimating anticipated tailwinds (e.g., no slowdown in the AI boom, continued earnings growth).
Those unquantifiable arguments aside, the historical record suggests that it’s difficult to identify a particular VIX threshold that reliably signals market exhaustion on a timely basis. Just one example: The VIX closed below 15 on 178 of the 253 trading days from June 1, 2023 to June 3, 2024 (and closed as low as 9.14), and the SPX gained more than 25% during this period. In other words, the market can fall on any day—and keep falling for an undetermined time—but the fact that the VIX was below 15, or any other level, may not have had much, if anything, to do with it.
Yes, if the VIX consistently edges to lower levels month after month (after month), one could reasonably argue that the stock market may be more vulnerable to correction. But since that scenario would likely reflect a stock market that has climbed month after month without a significant retracement, one could reasonably make the same argument without referencing the VIX at all.
That said, looking at what the SPX did in the weeks following other days like Tuesday suggests a tendency toward short-term weakness, but not necessarily more. For example, there have been 107 other days similar to Tuesday since 1990 (defined here as a day the VIX fell more than 4% and closed at its lowest level in at least six months). Here’s what the SPX did after them:1
•five-day median return of -0.05%
•10-day median return of +0.5%
•20-day median return of +1%
To go one step further, 56 of these examples even more closely resembled Tuesday, in that they occurred when the SPX closed at its highest level in at least six months in the preceding five days. Here’s what happened after this group:
•five-day median return of +0.1%
•10-day median return of +0.7%
•20-day median return of +1.3%
For perspective, the SPX’s median returns for all five-, 10-, and 20-day periods since 1990 are 0.3%, 0.6%, and 1.2%, respectively. That means except for the first five days, the SPX appeared to slightly outperform its benchmarks, on average, in the first few weeks after the days that most closely resembled Tuesday.
Final note: Tuesday delivered one other potentially bearish short-term VIX-related signal. The SPX closed at a new record high, but instead of closing lower, the VIX also closed higher. That suggests the market was concerned about higher market volatility even though stocks climbed for the day. Since 1990, after days the VIX closed higher on a day the SPX closed at 50-day (or longer) higher, the SPX closed lower on both of the next two days more than half the time.
Today’s numbers include: Retail Sales (8:30 a.m.), Consumer Sentiment (10 a.m.), Business Inventories (10 a.m.).
Today’s earnings include: Boost Run (BRUN).
Click here to log on to your account or learn more about E*TRADE's trading platforms, or follow the Company on X (Twitter), @ETRADE, for useful trading and investing insights.
1 All figures reflect S&P 500 (SPX) and Cboe Volatility Index (VIX) daily prices, 1990-2026. “Six months” is defined here as 126 trading days. Supporting document available upon request.