Understanding trends using technical analysis
E*TRADE from Morgan Stanley
One of the three assumptions of technical analysis is that stock prices tend to move in trends. Another way to think about this assumption is by borrowing from the world of physics and Sir Isaac Newton’s laws of motion. In particular, Newton’s law of motion states that an object in motion tends to stay in motion unless acted upon by an opposing force.
Now think about a stock that investors are buying. The price of this stock will rise until an opposing force acts upon the stock. Of course the opposing force would be investors selling the stock.
There are generally three types of trends in stock prices: uptrends, downtrends, and sideways trends. While it’s fairly easy to identify these trends based on historical data, the difficult part can be determining the trend in real-time.
Uptrends: Rising lows
One way to identify uptrends in real-time is by measuring the low of a period relative to other historical lows. In particular, a series of rising lows can be a sign of an uptrend. For example, the chart in Figure 1 displays a series of rising lows, where the current low is greater than the low from yesterday; the low yesterday is greater than the low from the previous day, and so on. Traders may buy or hold on to a stock if it’s forming a pattern of higher lows.
Uptrends example of rising lows
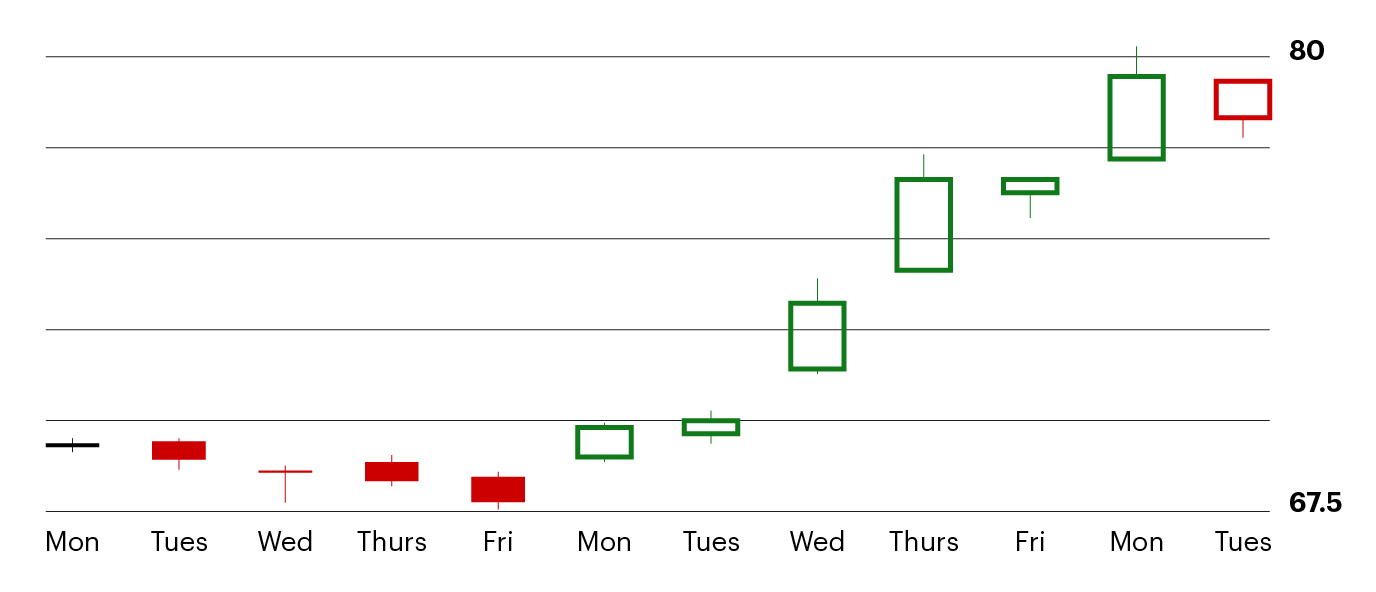
Figure 1. For illustration only not a recommendation.
Downtrends: Falling highs
Similar to identifying uptrends in real-time, some traders define downtrends by measuring the high of a period relative to historical highs. A series of falling highs can be a sign of a downtrend. For example, the chart in Figure 2 displays a series of falling highs, where the high in each candlestick is lower than the high in the previous candlestick. Traders may avoid or sell a stock that’s forming a pattern of lower highs.
Downtrends example of falling highs
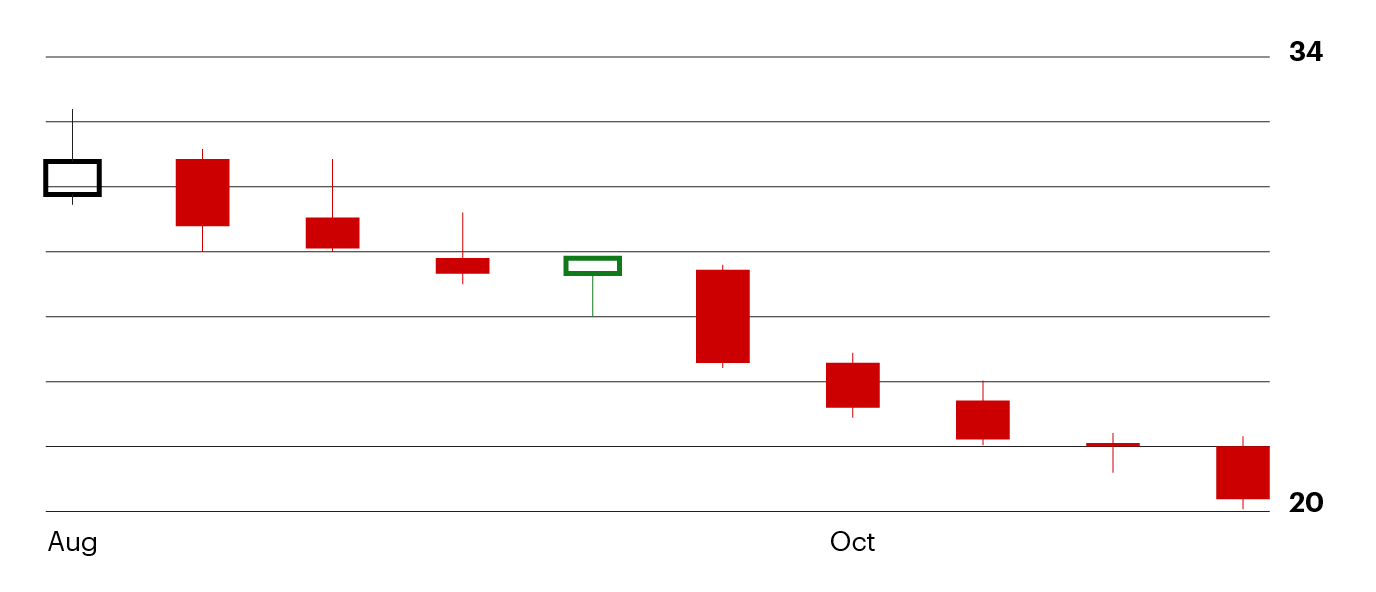
Figure 2. For illustration only not a recommendation
Sideways trends: Equal highs and lows
As you’ve seen in the above examples, and if you look in your portfolio or at other stocks, it seems stock prices do indeed tend to move in trends, both up and down, at least some of the time. Other times a stock price seems to go nowhere for extended periods of time. These periods are known as sideways trends and they are surprisingly common.
Some traders define a sideways trend in real-time by looking for equal highs and lows in a stock over an extended time period. For example, you can see a sideways trend in the chart in Figure 3 that lasted for more than two years. Some traders may avoid, or potentially apply market neutral strategies, to a stock in a sideways trend.
Sideways trends example of equal highs and lows
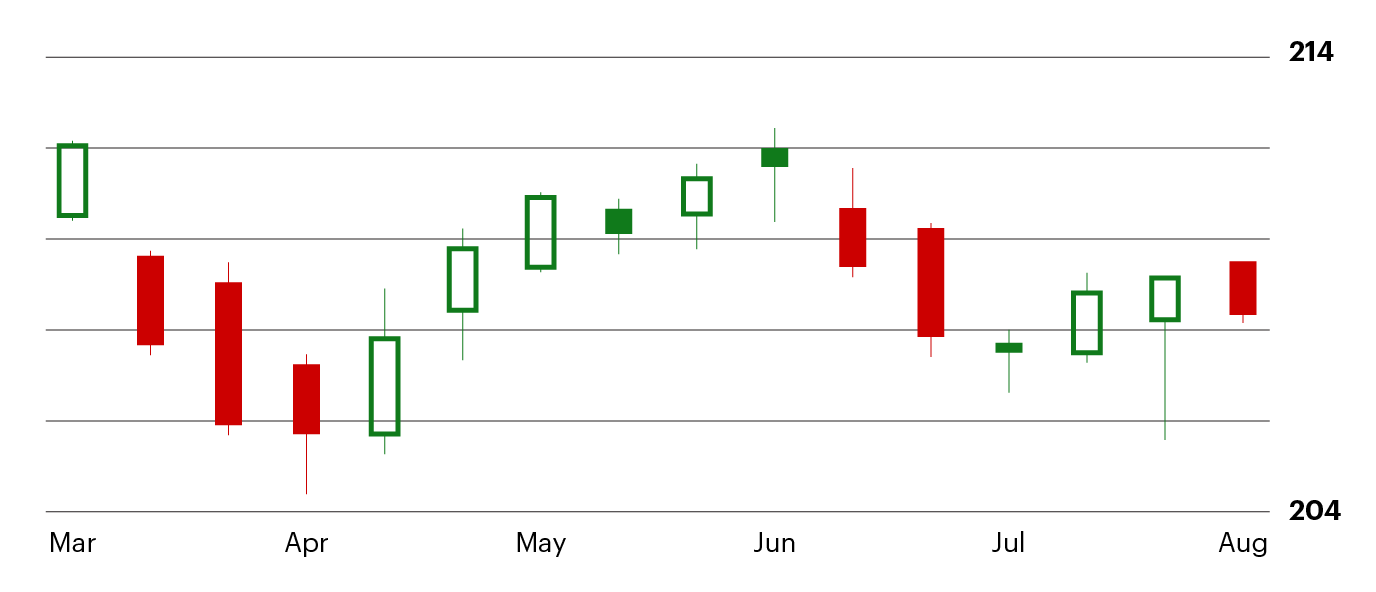
Figure 3. For illustration only not a recommendation.
There’s a saying that some traders latch on to: “The trend is your friend.” From a practical standpoint, this means potentially owning stocks that are trending higher and trying to avoid stocks that are trending lower or sideways. Practice identifying uptrends, downtrends, and sideways trends in stocks in your portfolio. If you find stocks moving sideways or trending down, you might take appropriate action and try to limit losses.