Introduction to technical analysis
E*TRADE from Morgan Stanley
Will XYZ stock go up or down?
Some traders try to answer this question by studying the basic characteristics of XYZ’s business. These characteristics may include sales, earnings, debt, and other financial aspects of the business. This method of analyzing a stock is known as fundamental analysis.
Other traders may try to answer the question by applying technical analysis. This form of analysis studies the trading activity of the stock. These characteristics generally include historical prices and volume of XYZ stock and related data.
What is technical analysis?
Generally, technical analysis is the process of gathering and studying historical market data in an attempt to forecast a stock price in the future. More precisely, technical analysis attempts to measure the supply of, and demand for, a stock.
Fortunately for traders today, gathering and studying historical market data is less challenging thanks to technology. All the historical data and tools you may need to perform technical analysis are built into E*TRADE and Power E*TRADE.
Assumptions of technical analysis
Technical analysis rests on three assumptions, the first of which is that the market discounts everything and a stock’s price reflects all known information about the company, economy, interest rates, and other core drivers of the business. Therefore, some traders ignore these core drivers and instead focus on the stock price.
The second assumption of technical analysis is that stock prices tend to move in trends. There are three types of trends traders attempt to identify with technical analysis: uptrends, sideways trends, and downtrends.
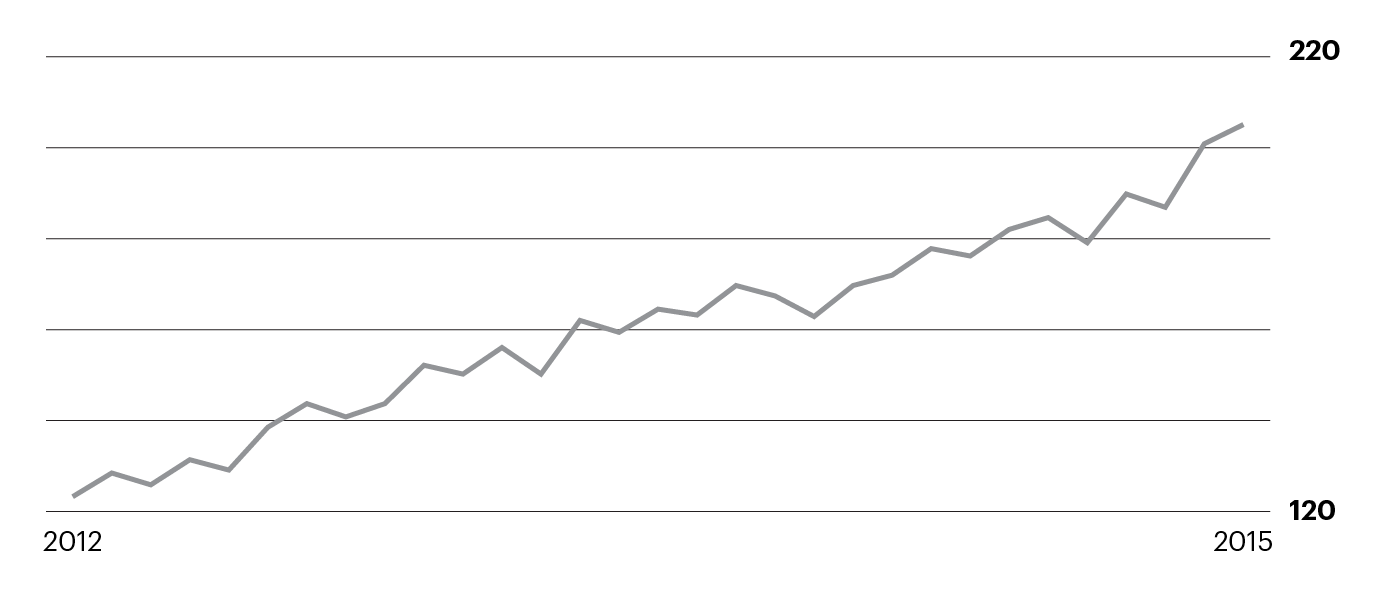
Stock uptrend example
The chart in Figure 1 displays an example of an uptrend that unfolded in a stock. Notice how the stock price moved from the lower-left to the upper-right of the chart, rising over time.
Figure 1. For illustration only, not a recommendation.
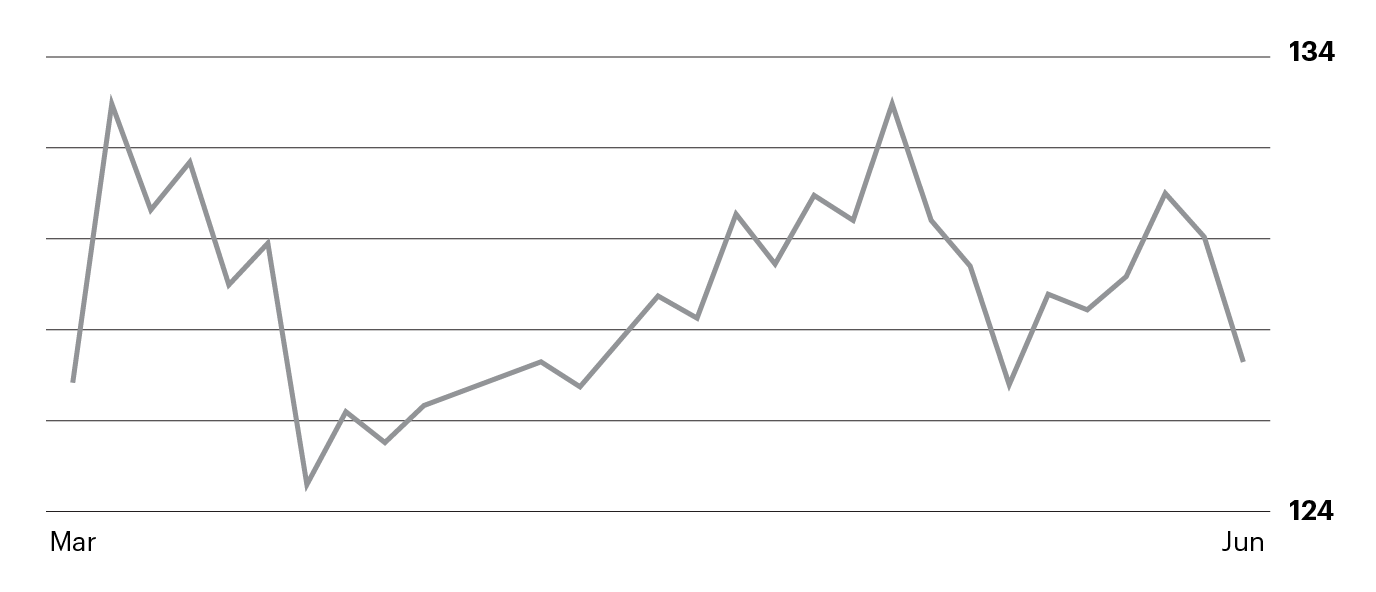
Stock sideways trend example
The chart in Figure 2 displays an example of a sideways trend. Notice how the stock moved from left to right with some ups and downs. But overall, the stock was little changed during this period.
Figure 2. For illustration only, not a recommendation.
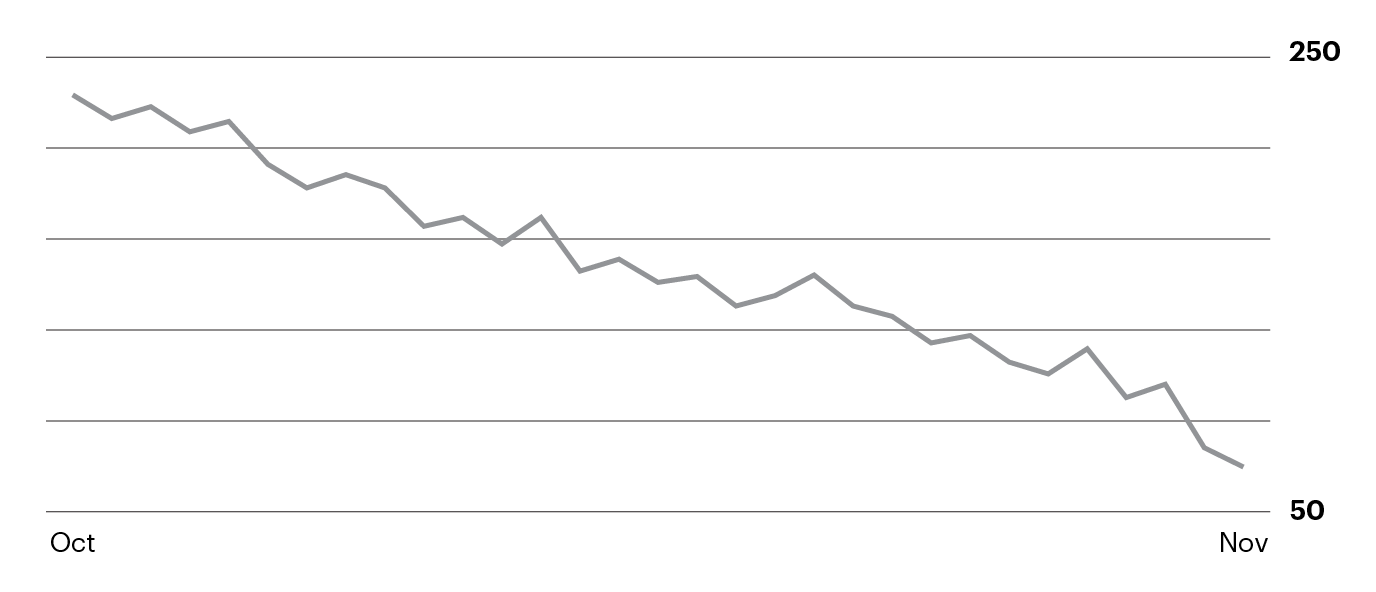
Stock downtrend example
The chart in Figure 3 displays an example of a downtrend. Observe how the price of the stock moved from the upper-left to the lower-right of the chart, falling over time.
Figure 3. For illustration only not a recommendation
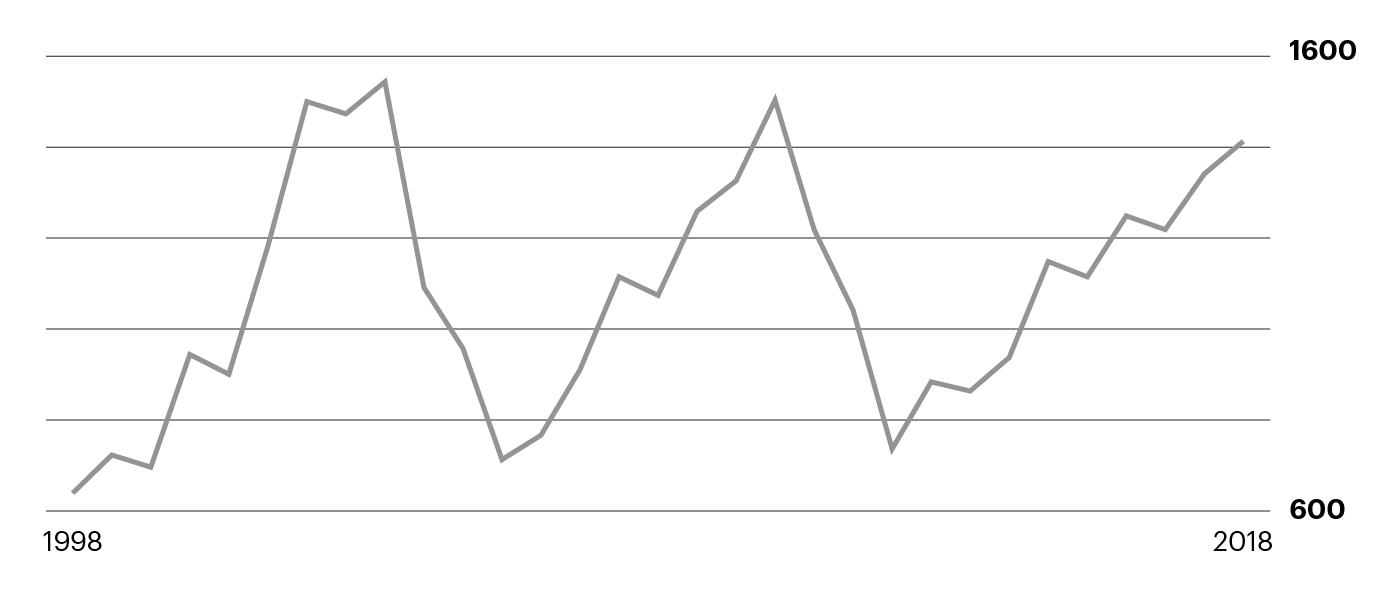
History repeats itself example
The third assumption of technical analysis is that history repeats in the stock market. One example of repeating history can be seen in Figure 4 below. This is a chart of the S&P 500 from 1997 to 2013. You can see the similarities in the S&P 500 during the dot-com boom and subsequent bust in 2000, and the recovery and financial crisis during 2009. In both cases, the S&P 500 moved up to about 1,500 and then dropped by about 50%.
Figure 4. For illustration only not a recommendation