Market Dashboard
New every Monday with last week’s recap and notes on the week ahead.
Last update: 08/25/2025
Dovish comments from the Fed chair on Friday boosted hopes for a September rate cut, halting a five-day slide in major US stock indexes. The S&P 500 was up 0.3% and the Nasdaq down 0.9% for the week, while the US Treasury yield curve steepened. Manufacturing activity rose and housing starts jumped, while continuing jobless claims surged.
US equities mixed after Fed comments halt slide
- US equities ended the week mixed, after dovish commentary from Federal Reserve Chair Jerome Powell helped to halt a five-day slide in major indexes.
- The S&P 500 Index completed a round trip to eke out a modest weekly gain of 0.3%.
- The tech-heavy Nasdaq Composite finished the week down 0.9%, its second-worst drop since April.
- The small-cap Russell 2000 closed the week up 3.3%.
- After rising near 17 during the week, the Chicago Board Options Exchange (CBOE) Volatility Index (VIX), a measure of implied stock-market volatility, ended Friday at 14, close to 2025’s lows.
- US equities saw $2.5 billion in outflows for the week, pointing to a market rotation.
Dovish Fed speech sparks Friday market rally
- Through Thursday, large-cap US stock indexes had struggled amid concerns about elevated valuations and AI capital spending.
- However, equities and fixed income broadly rallied Friday after Fed Chair Jerome Powell, speaking in Jackson Hole, Wyoming, signaled the possibility of a September interest rate cut by highlighting rising risks to the labor market.
- Powell also remarked that it would be reasonable to assume that the effect of tariffs on inflation will be short-lived.
Yield curve steepens amid rate cut hopes
- Following Powell’s remarks, market-implied expectations for a September rate cut rose to 81%, with the Treasury yield curve steepening.
- The 10-year/30-year yield spread widened to 62 basis points, amid investor concerns about the sustainability of US debt and deficits.
- Corporate bond spreads continued to narrow, signaling increased investor confidence, despite weakening growth dynamics.
- Global bond funds experienced record inflows of $97 billion over the past month, paced by inflows to investment-grade bonds.
July Fed meeting minutes highlight inflation risks
- The Federal Open Market Committee (FOMC) July meeting minutes had few surprises. Participants expected companies to pass tariffs onto consumers and reiterated the importance of understanding tariffs’ effects on inflation.
- Most Fed officials viewed inflation risks as greater than employment risks. However, investors found the minutes outdated due to recent economic data.
Manufacturing activity surges
- S&P Global’s flash U.S. Composite PMI Output Index, which tracks manufacturing and service-sector activity, surprised to the upside in August.
- The index’s manufacturing component posted its highest reading since May 2022, with the report noting increases in output, new orders, and employment.
- Tariff-driven inflation concerns returned, as companies appeared to have begun passing cost increases to customers in greater increments.
Housing starts rise, building permits lag
- Housing starts outperformed expectations in July, printing at five-month highs.
- Building permits missed analysts’ expectations.
Continuing jobless claims jump
- Additionally, continuing jobless claims jumped to 1.97 million, the highest level since 2021.
CRC# 4771623 08/2025
How can E*TRADE from Morgan Stanley help?
Mighty mega caps
Consider shoring up your portfolio in tough markets by backing very large, time-tested companies that have the potential to withstand downturns.
Hedging Inflation
Discover ways to invest in securities that may help your portfolio resist the effects of inflation while also keeping risk and volatility in check.
Futures
Like options, futures let you lock in a price now for an investment you’ll buy in the future. They cost much less than the actual investment, so you can control a large contract with a relatively small amount of capital.
Certificates of Deposit (CD)
Fixed rates. Annual Percentage Yield up to 1,2
Lock in a competitive fixed rate for terms from to .3
Morgan Stanley Private Bank, Member FDIC.
Cross-Asset Performance Table
Returns and prices of the most popular indices and assets as of 08/22/25.
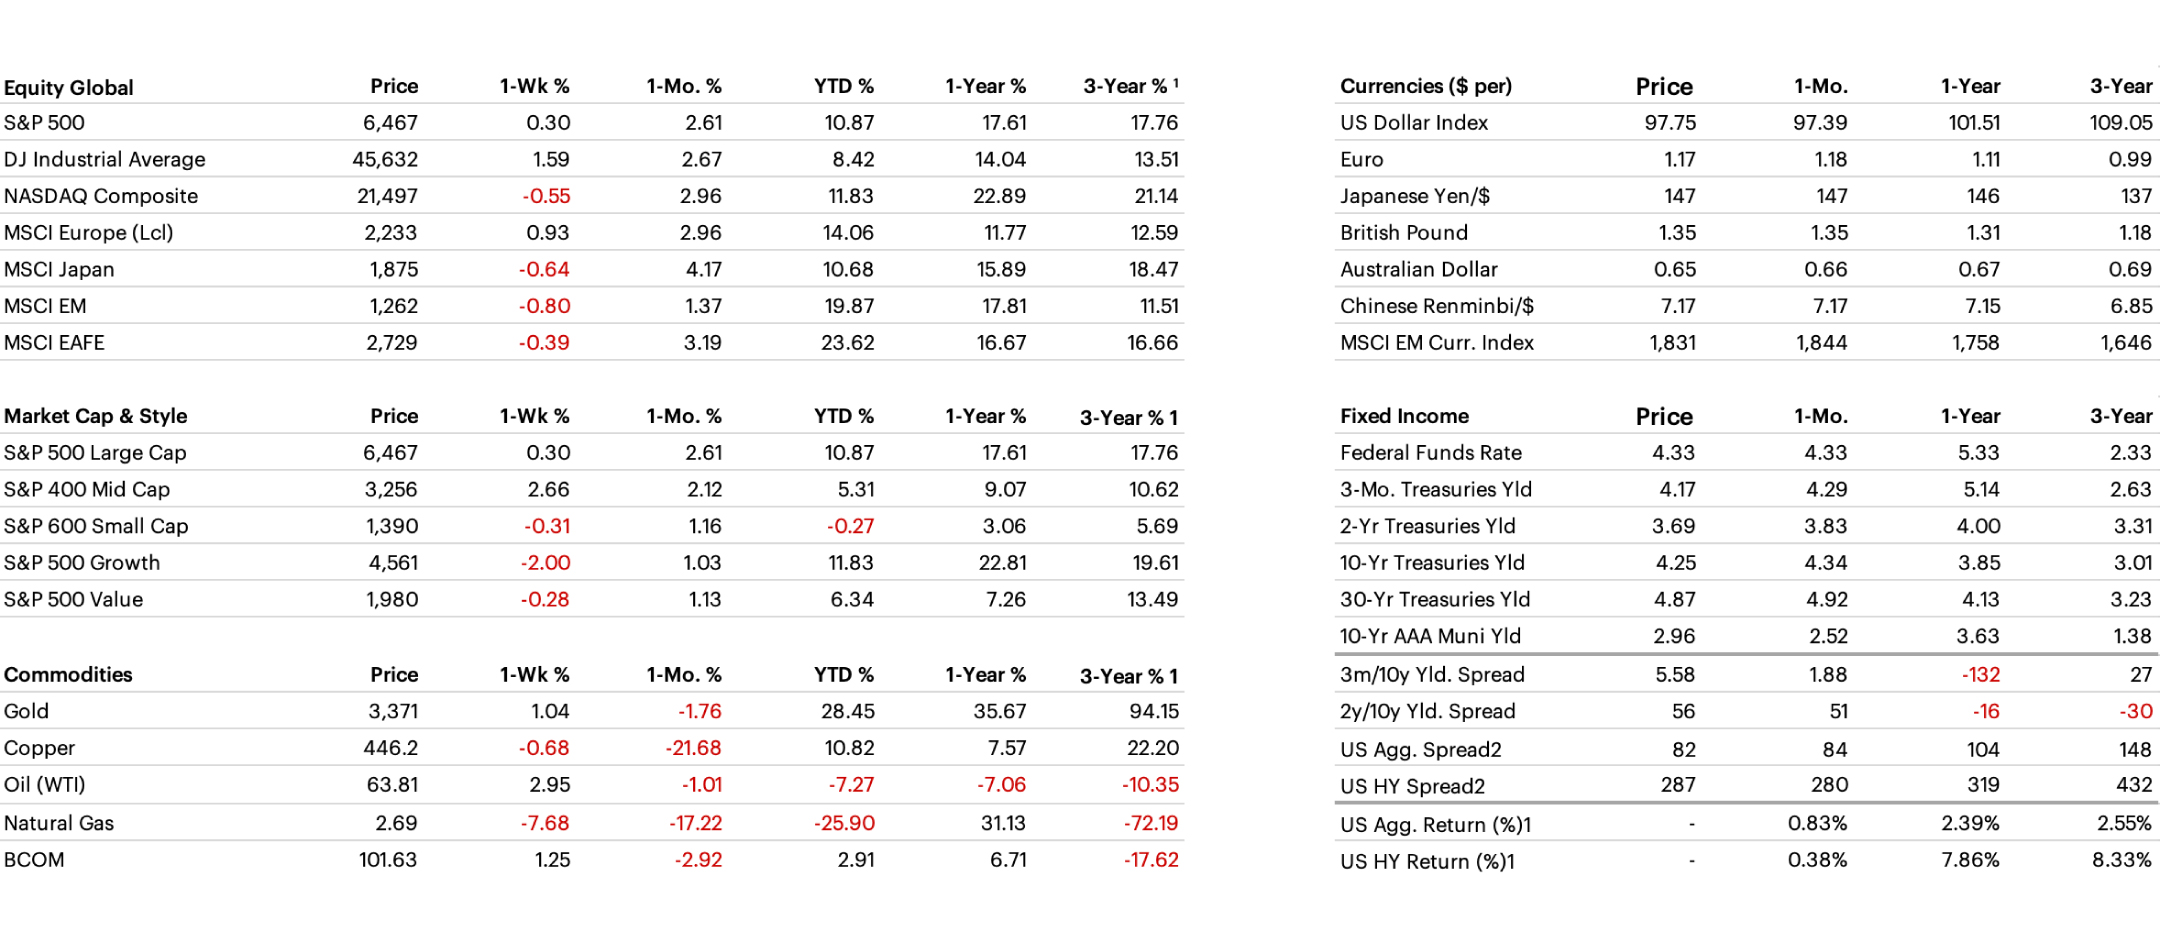
1) Annualized 3-year % return. 2) Option Adjusted Spread (OAS): OAS is a measurement of the spread of a fixed income security rate and the risk-free rate of return, which is adjusted to take into account an embedded option. Equity risk premium is the excess return that an individual stock or the overall stock market provides over a risk-free rate. The risk-free rate represents the interest an investor would expect from an absolutely risk-free investment over a specified period of time. Past performance is not indicative of future results.
S&P 500 Sector Performance
Energy and Real Estate were the strongest-performing S&P 500 sectors last week, while Communication Services and Information Technology lagged.
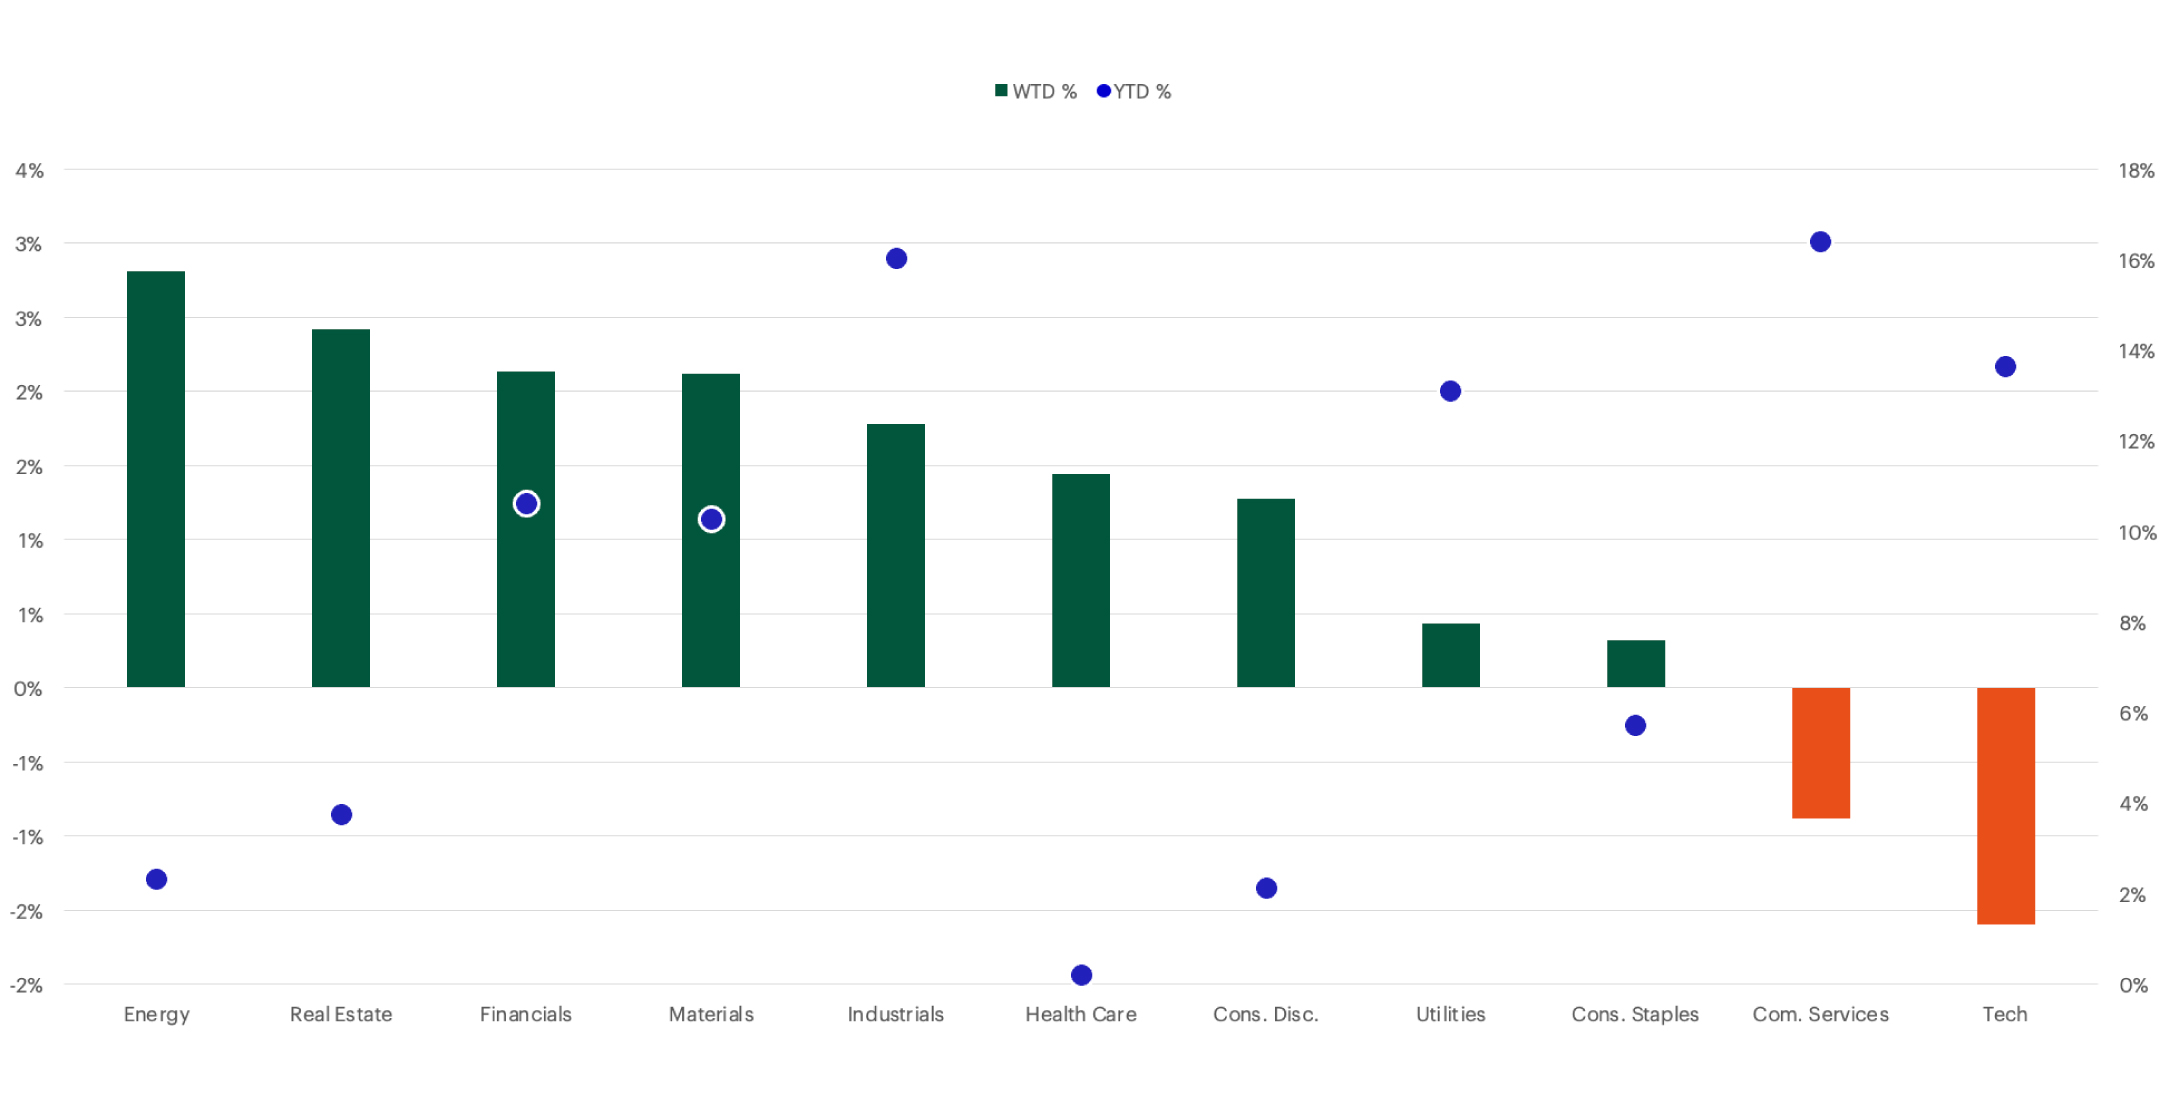
Past performance is not indicative of future results.
Russell US Equity Style Performance
Small-cap stocks outperformed large-cap equities.
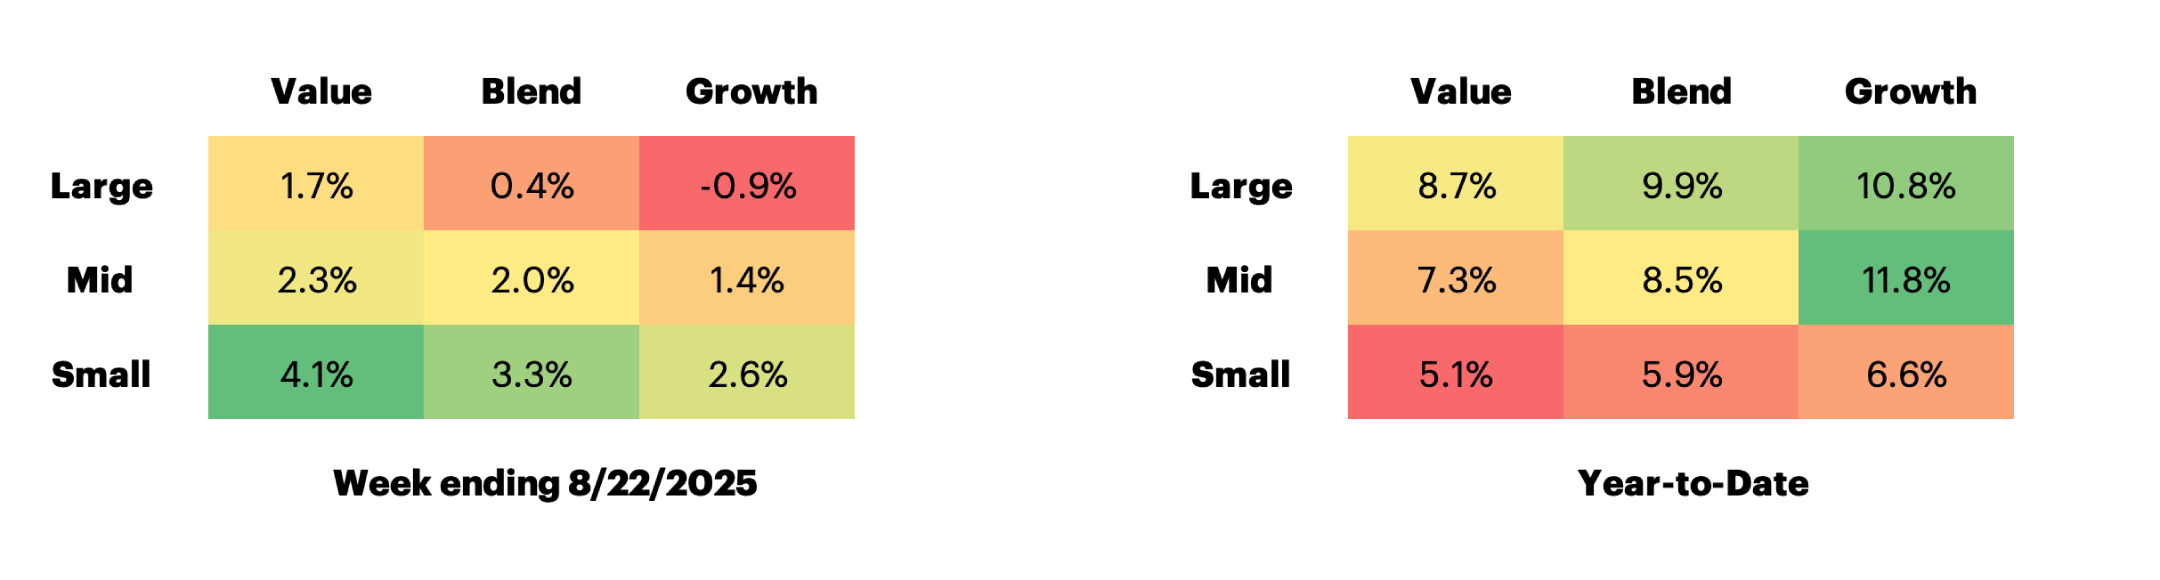
Past performance is not indicative of future results.
US Equity Valuation
S&P 500 Equity Risk Premium
Bonds continue to appear attractive relative to equities.
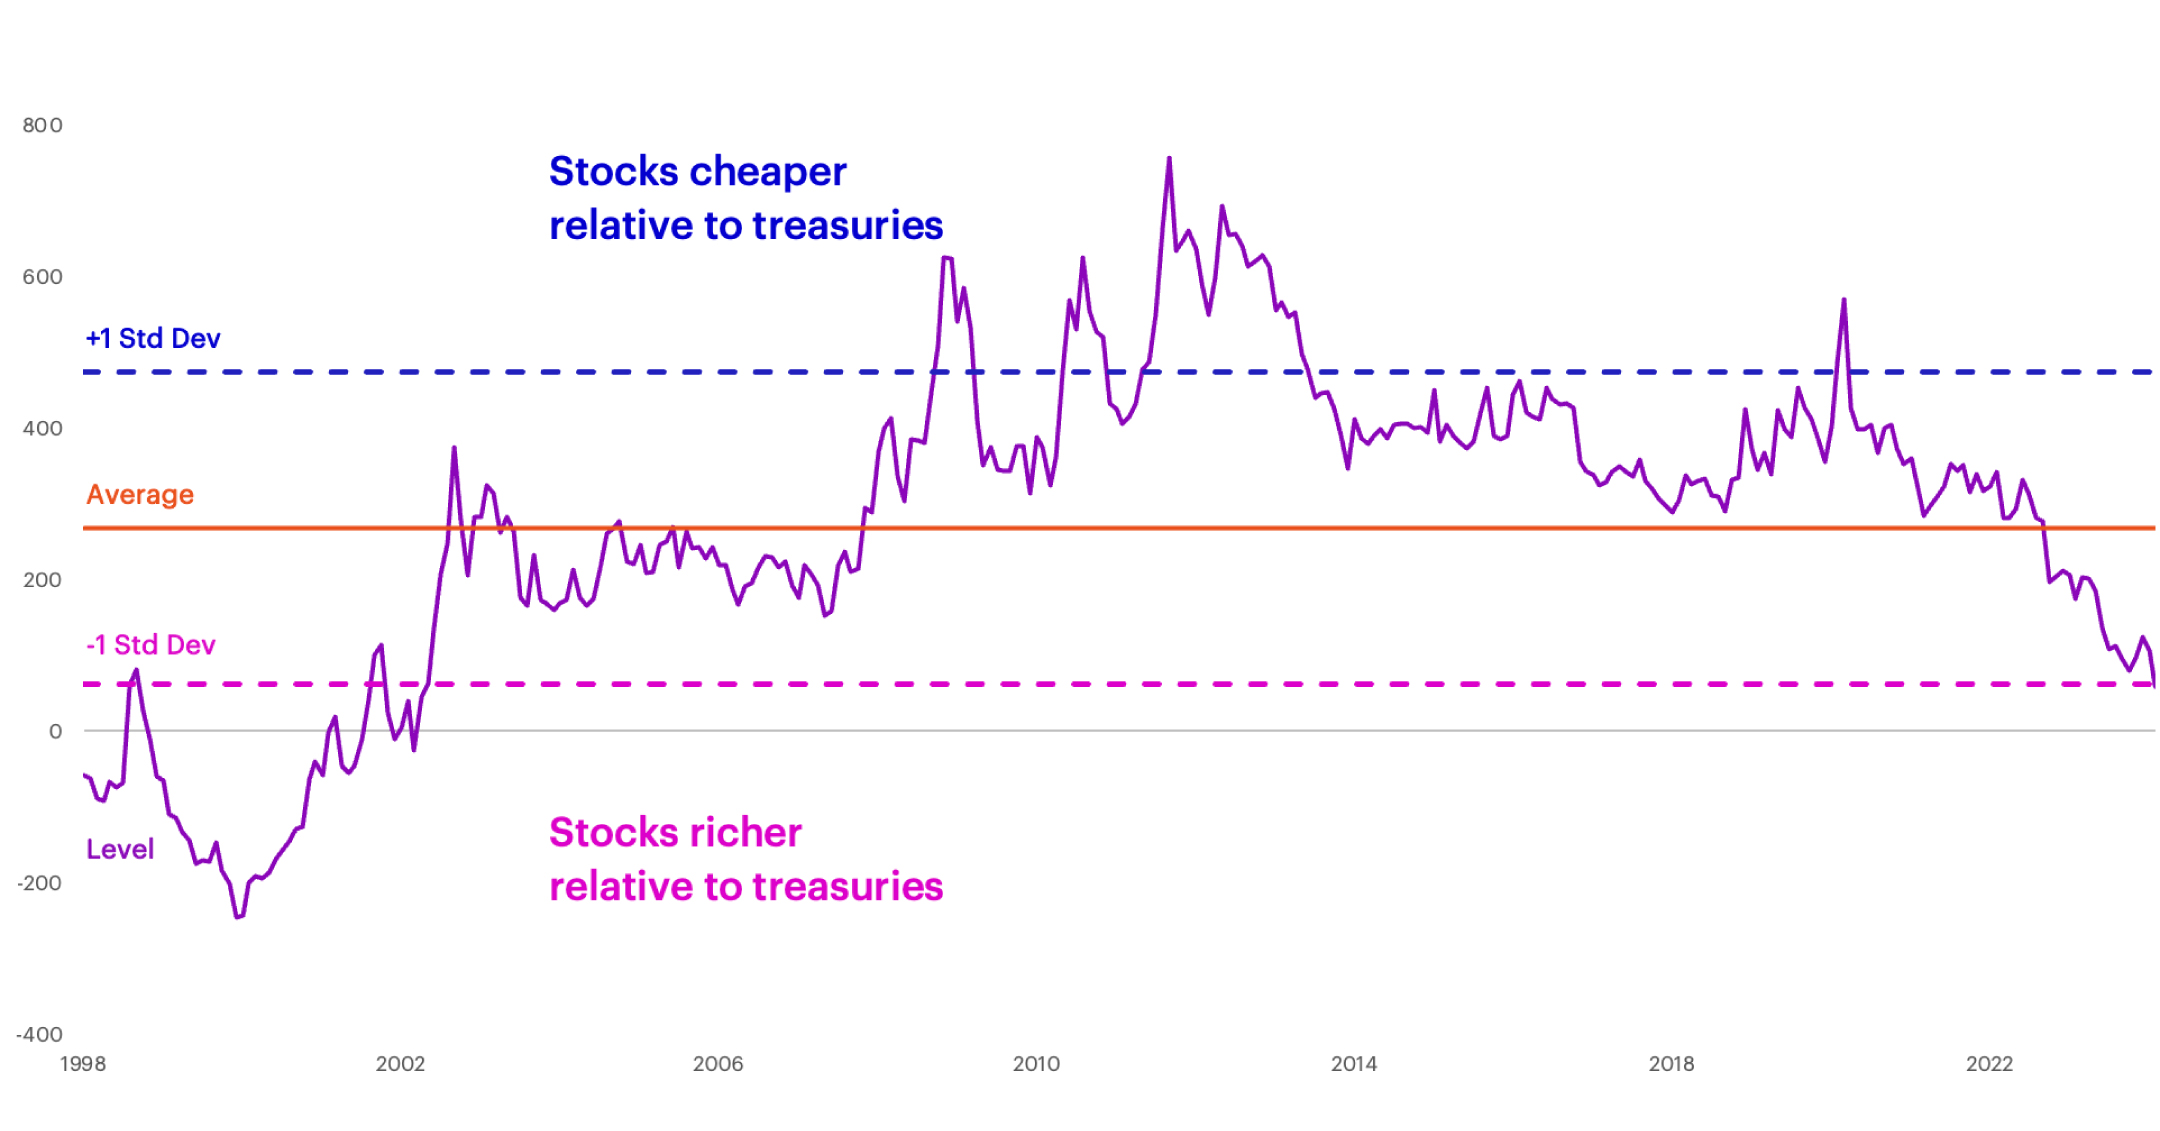
Past performance is not indicative of future results.
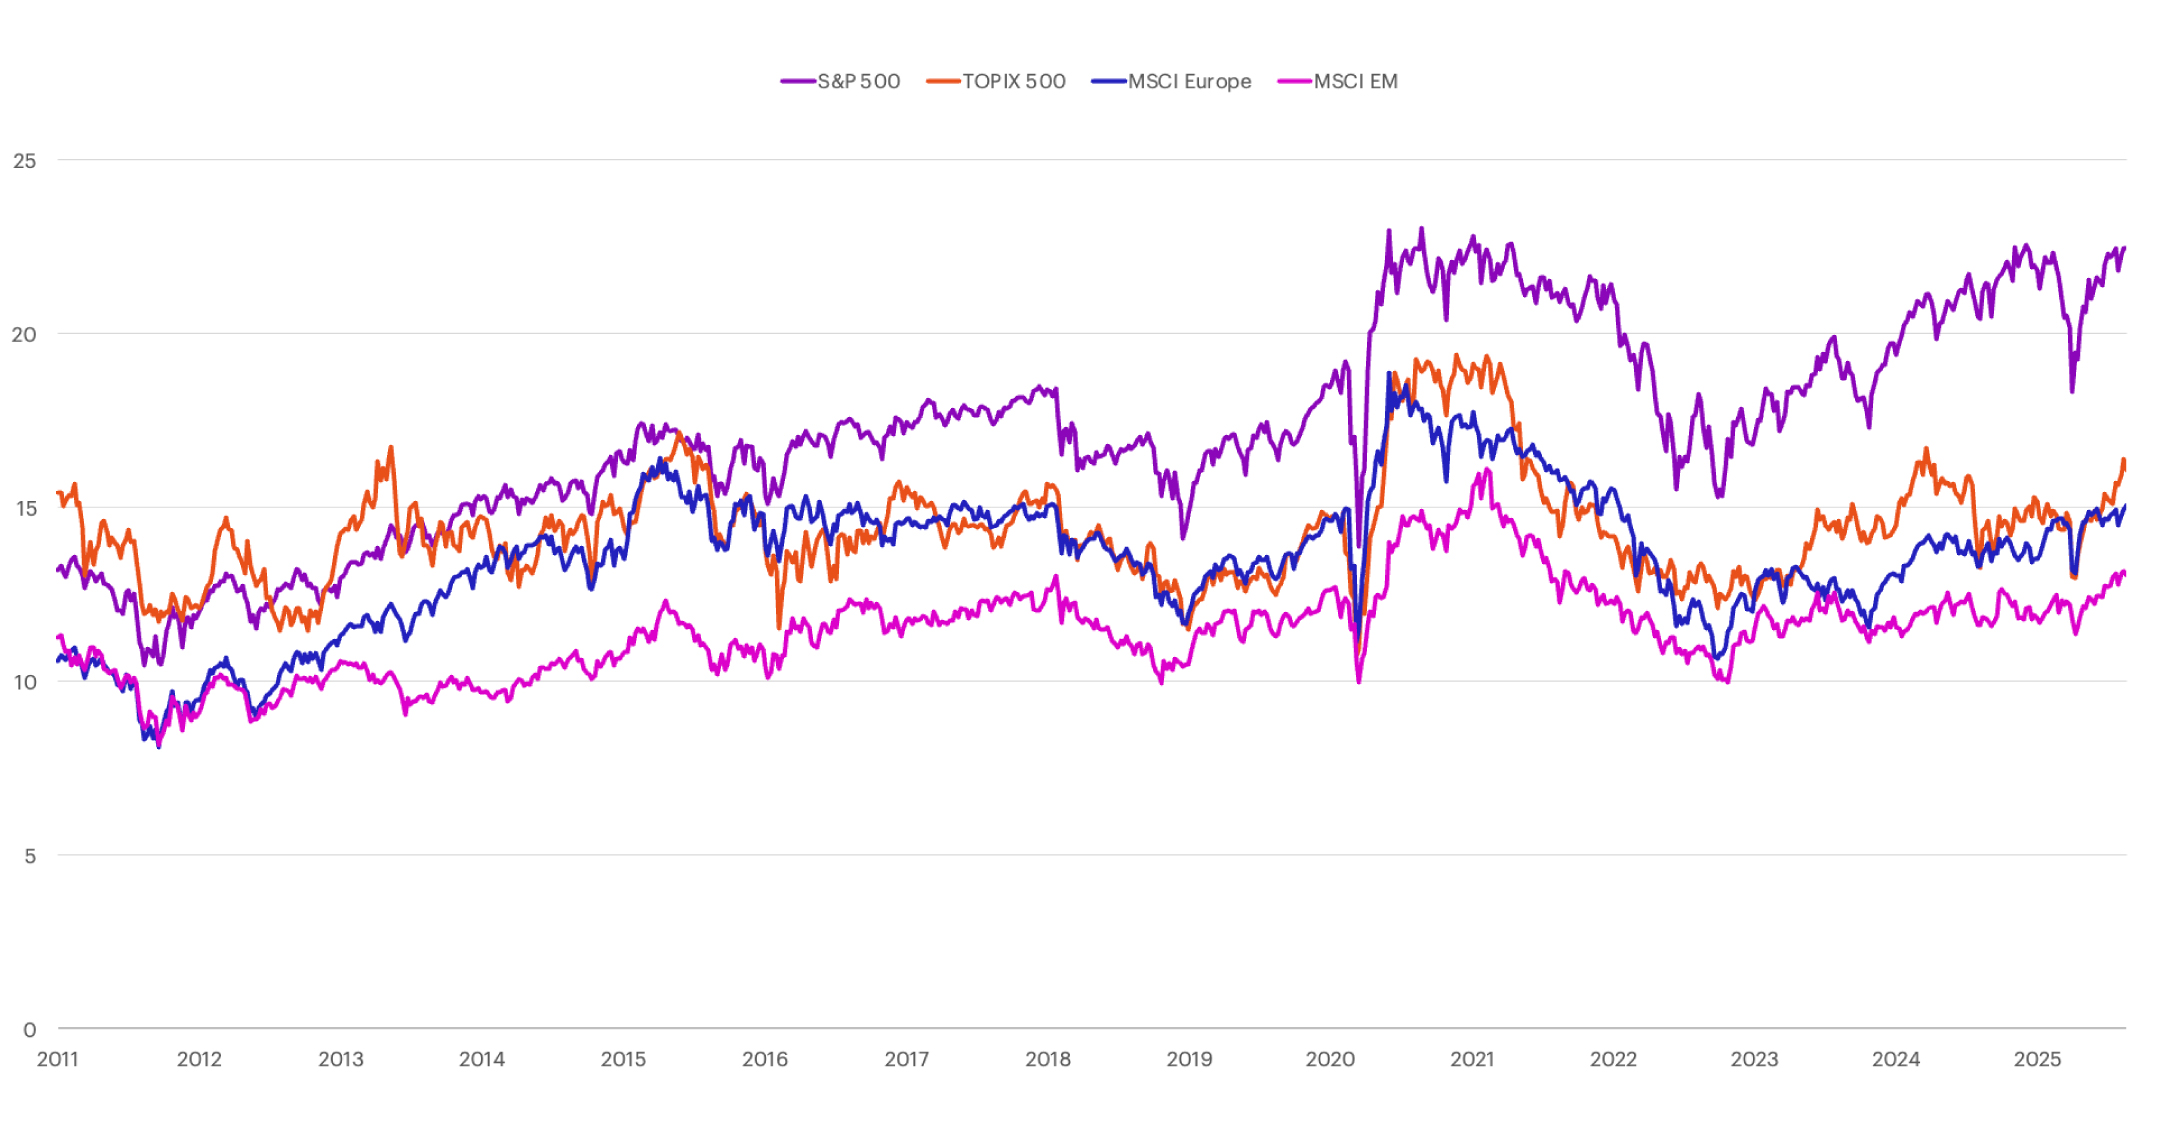
P/E Relative to Rest of World
The S&P 500 remains expensive relative to the rest of the world.
Past performance is not indicative of future results.
US Fixed Income Valuation
The two-year US Treasury yield decreased 6 bps to 3.69% last week, while the 10-year yield decreased 6 bps to 4.25%.
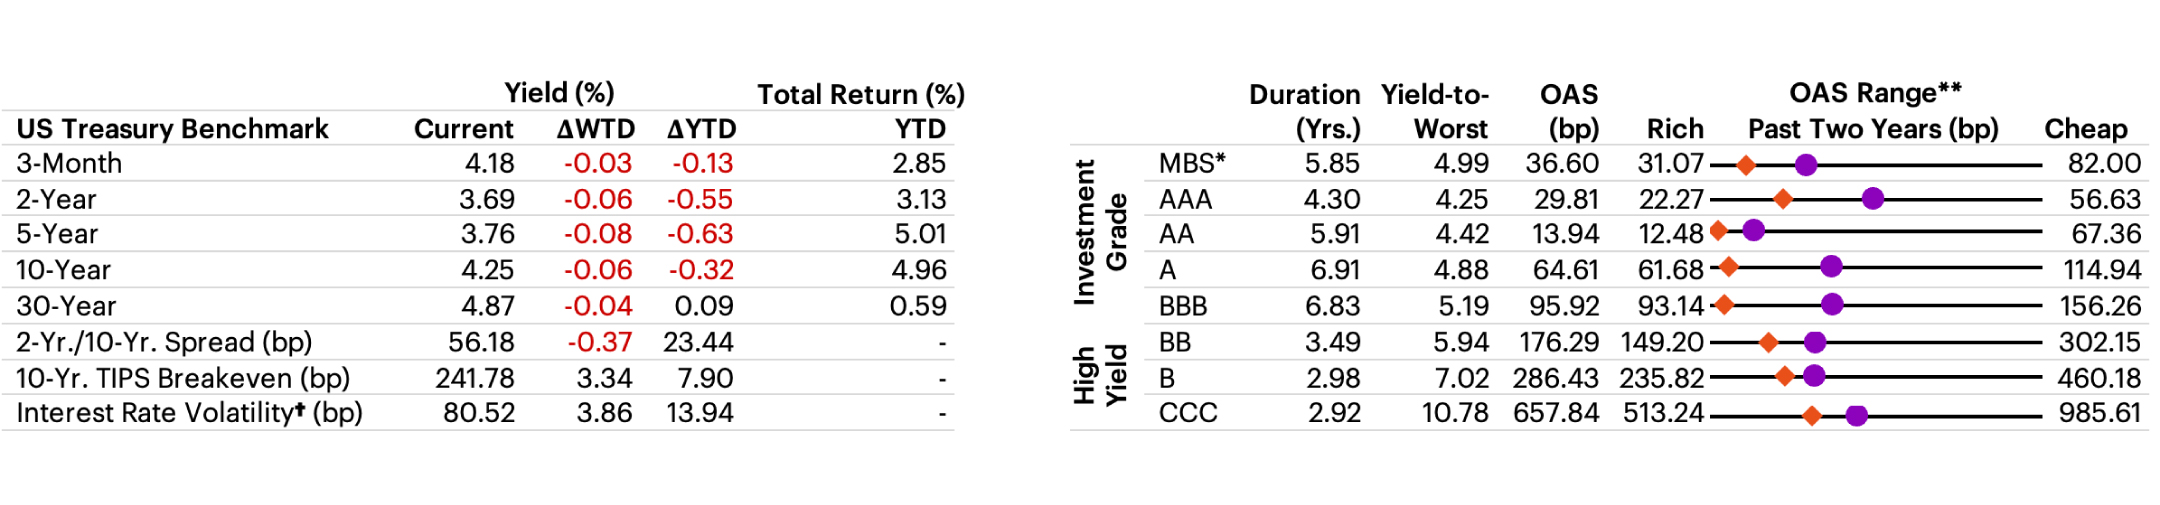
†Interest Rate Volatility as measured by ICE BofAML Option Volatility Estimate Index (MOVE); *Mortgage-backed securities (MBS) are debt obligations that represent claims to the cash flows from pools of mortgage loans, most commonly on residential property. Mortgage loans are purchased from banks, mortgage companies, and other originators and then assembled into pools by a governmental, quasi-governmental, or private entity; **Options Adjusted Spread (OAS): A measurement of the spread of a fixed income security rate and the risk-free rate of return, which is adjusted to take into account an embedded option. Past performance is not indicative of future results.
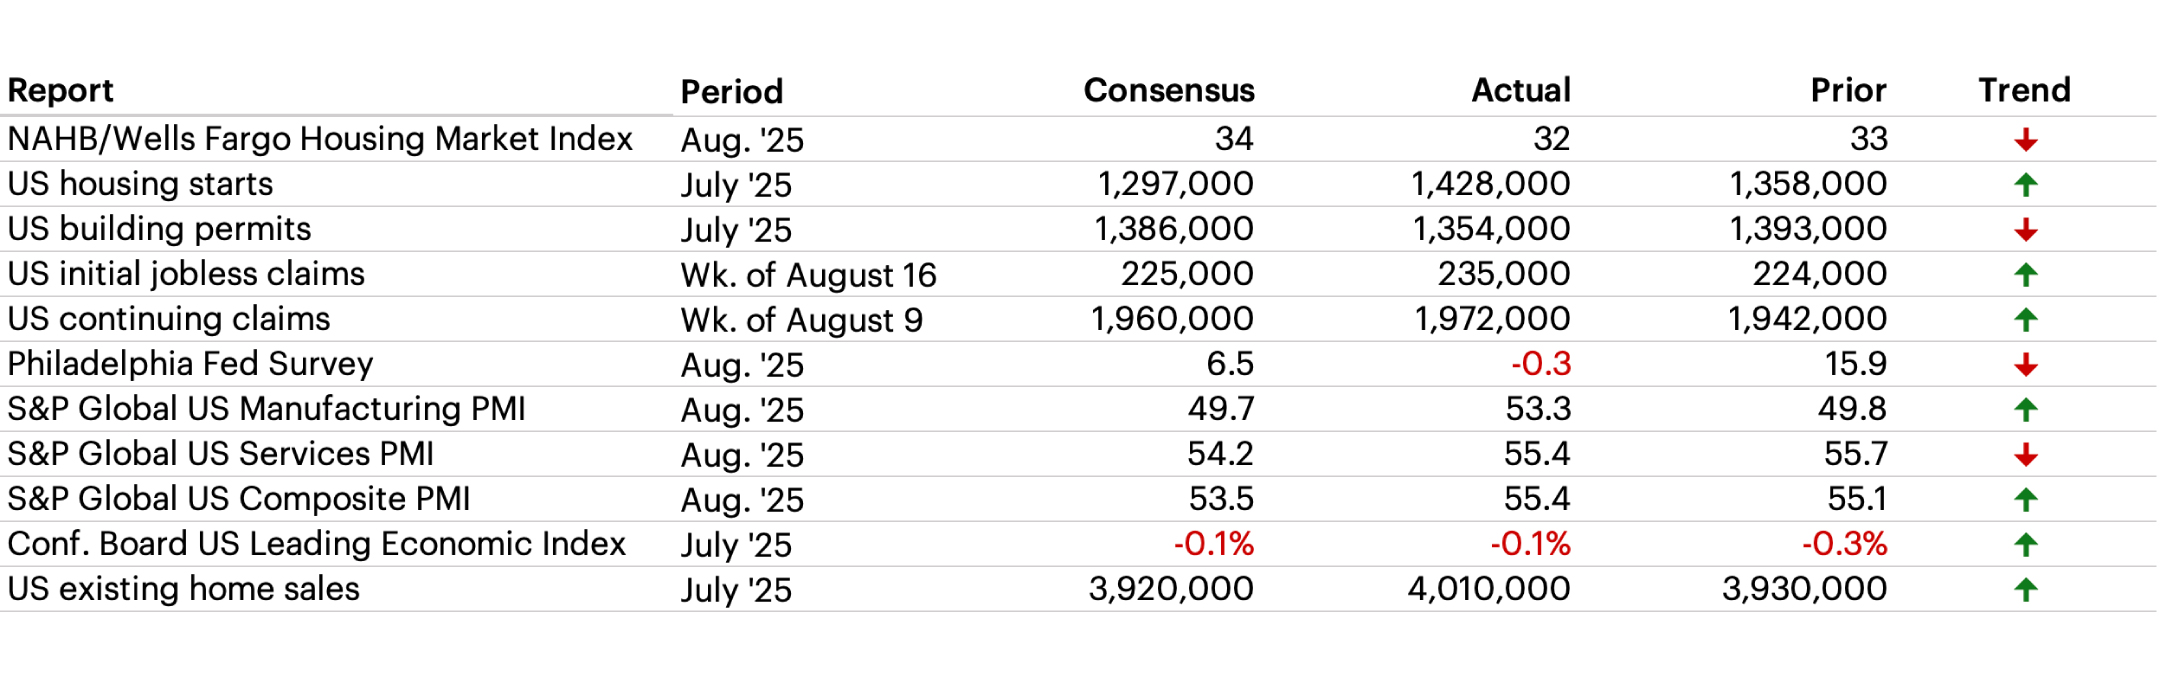
Latest Economic Data
August US Flash PMIs surprised to the upside: Manufacturing printed its highest reading since May 2022, with the report noting increases in output, new orders, and employment. Tariff-driven inflation concerns returned, as companies appeared to have begun passing through cost increases in greater increments.
The Week Ahead
The week ahead brings data for the Richmond Fed’s manufacturing index, the Conference Board’s consumer confidence surveys, Mortgage Bankers Association mortgage applications, jobless claims, and July’s personal consumption expenditures (PCE) price index.
- Chicago Fed National Activity Index at 8:30 AM ET
- New Home Sales at 10:00 AM ET
- Dallas Fed Manufacturing Activity at 10:30 AM ET
- Durable Goods Orders at 8:30 AM ET
- FHFA House Price Index at 9:00 AM ET
- Richmond Fed Manufacturing Index at 10:00 AM ET
- Conference Board Consumer Confidence at 10:00 AM ET
- Conference Board Present Situation at 10:00 AM ET
- Conference Board Expectations at 10:00 AM ET
- Bank of Montreal Reports Earnings
- NVIDIA Corporation Reports Earnings
- CrowdStrike Holdings, Inc. Reports Earnings
- Snowflake Inc. Reports Earnings
- GDP Price Index at 8:30 AM ET
- Initial and Continuing Jobless Claims at 8:30 AM ET
- Pending Home Sales at 10:00 AM ET
- Personal Income and Spending at 8:30 AM ET
- Headline and Core PCE at 8:30 AM ET
- Wholesale Inventories at 8:30 AM ET
- MNI Chicago PMI at 8:30 AM ET
- Alibaba Group Holding Limited Reports Earnings
Index benchmarks
Cross-Asset Performance
S&P 500: A market capitalization-weighted index of 500 widely held stocks often used as a proxy for the stock market. It measures the movement of the largest issues. Standard and Poor's chooses the member companies for the 500 based on market size, liquidity and industry group representation. Included are the stocks of industrial, financial, utility, and transportation companies. Since mid-1989, this composition has been more flexible and the number of issues in each sector has varied. The returns presented for the S&P 500 are total returns, including the reinvestment of dividends each month.
Dow Jones Industrial Average: Computed by summing the prices of the stocks of 30 companies and then dividing that total by an adjusted value—one which has been adjusted over the years to account for the effects of stock splits on the prices of the 30 companies. Dividends are reinvested to reflect the actual performance of the underlying securities.
NASDAQ Composite: Measures the performance of all issues listed in the NASDAQ Stock Market, except for rights, warrants, units, and convertible debentures. Morningstar reports the NASDAQ Composite as a price return.
MSCI Europe IMI: This index captures large, mid and small cap representation across 16 Developed Markets countries in Europe. With 1,372 constituents, the index covers approximately 99% of the free float-adjusted market capitalization across the Developed Markets countries of Europe.
MSCI Japan IMI: This index is designed to measure the performance of the large, mid and small cap segments of the Japan market. With 1,134 constituents, the index covers approximately 99% of the free float-adjusted market capitalization in Japan.
MSCI EM (Emerging Markets) Index: A free float-adjusted market-capitalization index that is designed to measure equity market performance of emerging markets. The MSCI Emerging Markets Index consists of the following 23 emerging market country indexes: Brazil, Chile, China, Colombia, Czech Republic, Egypt, Greece, Hungary, India, Indonesia, Korea, Malaysia, Mexico, Peru, Philippines, Poland, Qatar, Russia, South Africa, Taiwan, Thailand, Turkey and United Arab Emirates. For more information, visit the MSCI web site.
MSCI EAFE (Europe, Australasia, Far East) Index: A free float-adjusted market-capitalization index that is designed to measure the equity market performance of developed markets, excluding the U.S. and Canada. The MSCI EAFE Index consists of the following 21 developed market country indexes: Australia, Austria, Belgium, Denmark, Finland, France, Germany, Hong Kong, Ireland, Israel, Italy, Japan, the Netherlands, New Zealand, Norway, Portugal, Singapore, Spain, Sweden, Switzerland, and the United Kingdom. For more information, visit the MSCI website.
S&P 400 Index: This index provides investors with a benchmark for mid-sized companies. The index measures the performance of mid-sized companies, reflecting the distinctive risk and return characteristics of this market segment.
S&P 600 Index: This index measures the small-cap segment of the U.S. equity market. The index is designed to track companies that meet specific inclusion criteria to ensure that they are liquid and financially viable.
S&P 500 Growth: This index is a style-concentrated index designed to track the performance of stocks that exhibit the strongest growth characteristics by using a style-attractiveness-weighting scheme.
S&P 500 Value: This index is a style-concentrated index designed to track the performance of stocks that exhibit the strongest value characteristics by using a style-attractiveness-weighting scheme.
Bloomberg Commodity Index: Made up of 22 exchange-traded futures on physical commodities. The index currently represents 20 commodities, which are weighted to account for economic significance and market liquidity.
US Trade-Weighted Dollar Index: A weighted average of the foreign exchange value of the US dollar against a subset of the broad index currencies that circulate widely outside the US.
MSCI Emerging Markets Currency Index: sets the weights of each currency equal to the relevant country weight in the MSCI Emerging Markets Index.
Bloomberg US Aggregate Index: The US Aggregate Index covers the dollar-denominated investment-grade fixed-rate taxable bond market, including Treasuries, government-related and corporate securities, MBS pass-through securities, asset-backed securities, and commercial mortgage-based securities. These major sectors are subdivided into more specific sub-indices that are calculated and published on an ongoing basis. Total return comprises price appreciation/depreciation and income as a percentage of the original investment. This index is rebalanced monthly by market capitalization.
Bloomberg US Corporate High Yield Bond Index: This index is composed of fixed-rate, publicly issued, non-investment grade debt.
S&P Sector Performance
The S&P 500 Consumer Discretionary sector comprises those companies included in the S&P 500 that are classified as members of the consumer discretionary sector.
The S&P 500 Consumer Staples sector comprises those companies included in the S&P 500 that are classified as members of the consumer staples sector.
The S&P 500 Energy sector comprises those companies included in the S&P 500 that are classified as members of the energy sector.
The S&P 500 Financials sector comprises those companies included in the S&P 500 that are classified as members of the financial sector.
The S&P 500 Health Care sector comprises those companies included in the S&P 500 that are classified as members of the health care sector.
The S&P 500 Industrials Sector comprises those companies included in the S&P 500 that are classified as members of the industrials sector.
The S&P 500 Information Technology Sector comprises those companies included in the S&P 500 that are classified as members of the information technology sector.
The S&P 500 Materials Sector comprises those companies included in the S&P 500 that are classified as members of the materials sector.
The S&P 500 Communications Services Sector comprises those companies included in the S&P 500 that are classified as members of the telecommunications services sector.
The S&P 500 Utilities Sector comprises those companies included in the S&P 500 that are classified as members of the utilities sector.
The S&P 500 Real Estate Sector comprises those companies included in the S&P 500 that are classified as members of the real estate sector.
US Equity Style Performance
Weekly and monthly style performance charts use Russell 1000, Russell Mid Cap, and Russell 2000 style indexes to represent large cap, mid cap, and small cap respectively.
Russell 1000: Consists of the 1000 largest companies within the Russell 3000 index. Also known as the Market-Oriented Index, because it represents the group of stocks from which most active money managers choose. The returns we publish for the index are total returns, which include reinvestment of dividends. Frank Russell Company reports its indexes as one-month total returns.
Russell 1000 Growth: Market-capitalization weighted index of those firms in the Russell 1000 with higher price-to-book ratios and higher forecasted growth values. The Russell 1000 includes the largest 1000 firms in the Russell 3000, which represents approximately 98% of the investable US equity market.
Russell 1000 Value: Market-capitalization weighted index of those firms in the Russell 1000 with lower price-to-book ratios and lower forecasted growth values. The Russell 1000 includes the largest 1000 firms in the Russell 3000, which represents approximately 98% of the investable US equity market.
Russell 2000: Consists of the smallest 2000 companies in the Russell 3000 Index, representing approximately 7% of the Russell 3000 total market capitalization. The returns we publish for the index are total returns, which include reinvestment of dividends.
Russell 2000 Growth: Market-weighted total return index that measures the performance of companies within the Russell 2000 Index having higher price-to-book ratios and higher forecasted growth values. The Russell 2000 Index includes the 2000 firms from the Russell 3000 Index with the smallest market capitalizations. The Russell 3000 Index represents 98% of the of the investable US equity market.
Russell 2000 Value: Market-weighted total return index that measures the performance of companies within the Russell 2000 Index having lower price-to-book ratios and lower forecasted growth values. The Russell 2000 Index includes the 2000 firms from the Russell 3000 Index with the smallest market capitalizations. The Russell 3000 Index represents 98% of the of the investable US equity market.
Russell Midcap: Measures the performance of the 800 smallest companies in the Russell 1000 Index, which represent approximately 25% of the total market capitalization of the Russell 1000 Index. As of the latest reconstitution, the average market capitalization was approximately $4.0 billion; the median market capitalization was approximately $2.9 billion. The largest company in the index had an approximate market capitalization of $12 billion.
Russell Midcap Growth: Market-weighted total return index that measures the performance of companies within the Russell Midcap Index having higher price-to-book ratios and higher forecasted growth values. The Russell Midcap Index includes firms 201 through 1000, based on market capitalization, from the Russell 3000 Index. The Russell 3000 Index represents 98% of the of the investable U.S. equity market.
Russell Midcap Value: Market-weighted total return index that measures the performance of companies within the Russell Midcap Index having lower price-to-book ratios and lower forecasted growth values. The Russell Midcap Index includes firms 201 through 1000, based on market capitalization, from the Russell 3000 Index. The Russell 3000 Index represents 98% of the of the investable U.S. equity market.
P/E Relative to Rest of World
TOPIX: This free-floated-adjusted index tracks all domestic companies of the exchange’s First Section.
US Fixed Income Valuation
ICE BofAML Option Volatility Estimate Index (MOVE): A yield curve-weighted index of the normalized implied volatility on one-month treasury option.
An investment cannot be made directly in a market index.