Chip retreat weighs on market
- Stocks slump as chip sector enters bear market
- Inflation cooled, but oil jumps on new US-Iran clashes
- This week: first Mag-7 earnings
Big banks kicked off earnings season by topping estimates and inflation data surprised to the downside, but the US market still took a step back last week as semiconductor stocks continued to sell off and escalating US-Iran hostilities pushed up oil prices.
A volatile week for the S&P 500 (SPX) ended with a wide-swinging Friday. The index fell 1.4% in early trading, erased nearly two-thirds of that deficit, then seesawed the remainder of session—ultimately closing at its lowest level since June 29:
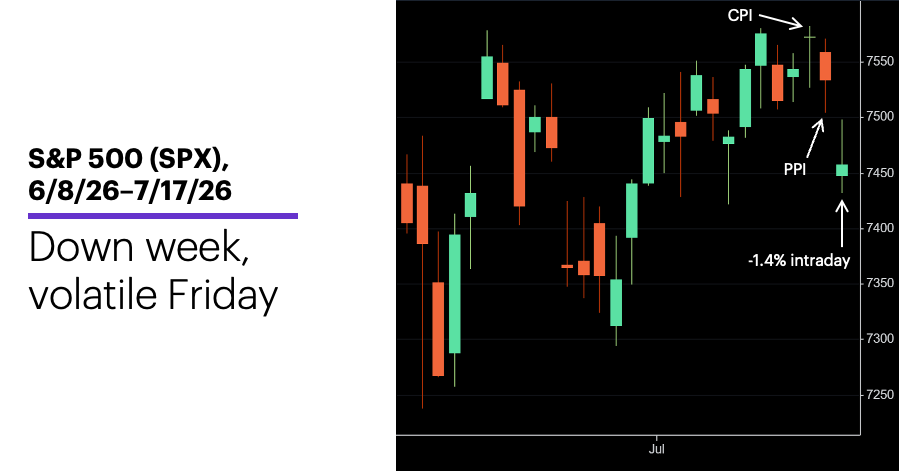
Source: Power E*TRADE. (For illustrative purposes. Not a recommendation. Note: It is not possible to invest in an index.)
The headline: Chip volatility, geopolitics stymies bulls.
The fine print: Morgan Stanley Wealth Management strategist recently argued that “quality” S&P 500 stocks (i.e., those companies with among the highest composite scores based on return on invested capital, free-cash-flow margin, debt-to-equity ratio and earnings stability) may attract more investor attention if the AI-driven momentum trade—which was the primary driver for the chip-stock rally—fades.1
The move: On Friday the PHLX Semiconductor Index (SOX) closed in bear-market territory—more than 20% below its June 22 record close.
The number: -0.3%, the month-over-month (for June) decline in the Producer Price Index (PPI) reported last Thursday. While Wednesday’s Consumer Price Index (CPI) wasn’t quite as cool, both inflation gauges surprised to the downside.
The scorecard: The indexes with the most exposure to tech lost the mos ground last week:
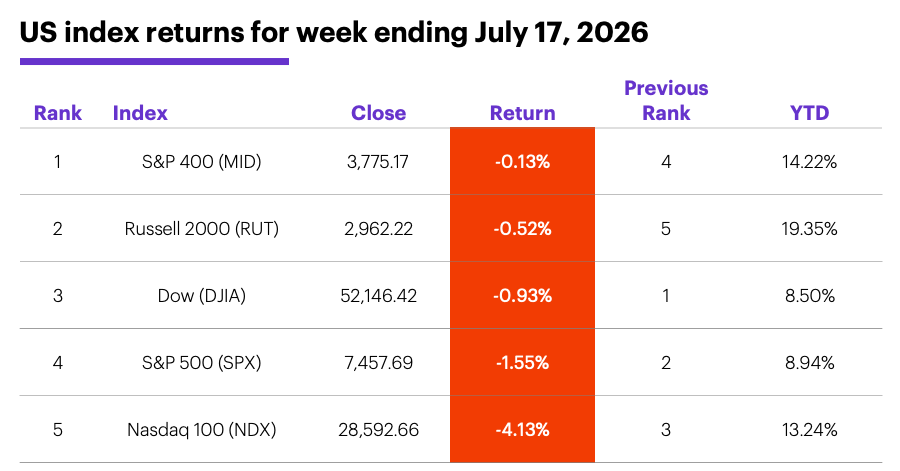
Source (data): Power E*TRADE. (For illustrative purposes. Not a recommendation.)
S&P 500 sector returns: The strongest S&P 500 sectors last week were energy (+5%), real estate (+2.3%), and consumer staples (+1.4%). The weakest sectors were tech (-3.7%), communication services (-2.3%), and industrials (-1.4%).
S&P 500 stock movers: Last week’s biggest gains were PayPal (PYPL) +22% to $56.56 and Cintas (CTAS) +14% to $204.45. The biggest losses were Sandisk (SNDK) -29% to $1,354.82, IBM (IBM) -26% to $212.67, and Marvell Technology (MRVL) -20% to $188.68. Other moves: Q32 Bio (QTTB) +89% to $21.38 on Monday, Gorilla Technology (GRRR) -29% to $11.89 on Wednesday. (Note: E*TRADE clients can now trade fractional shares on select stocks and ETFs.)
Yields and the dollar: The 10-year US Treasury yield ticked 0.01% lower to 4.55% last week. The US Dollar Index (DXY) slipped 0.18 to 100.77.
Commodity futures: September WTI crude oil (CLU6) closed Friday at its highest level in more than a month, up $10.44 (14.6%) to $81.78 for the week. August gold (GCQ6) fell $94.90 to $4,018.80. Biggest gains: September Brent crude oil (BU6) +15.9%, September WTI crude oil (CLU6) +14.6%. Biggest declines: September cocoa (CCU6) -8.8%, September silver (SIU6) -6.4%.
Crypto: Bitcoin -0.4% to $63,899.46 last week, Ethereum +2.5% to 1,840.99.
Coming this week
This week’s light economic calendar should keep the focus on earnings, barring any geopolitical surprises. In addition to the first Magnificent Seven stocks, several high-profile aerospace and defense, industrial, and tech names are scheduled to report. A few highlights:
●Monday: Domino’s Pizza (DPZ), Steel Dynamics (STLD), Wintrust (WTFC)
●Tuesday: Alaska Air (ALK), Danaher (DHR), General Motors (GM), Halliburton (HAL), Hasbro (HAS), KeyCorp (KEY), 3M (MMM), Northrop Grumman (NOC), Novartis (NVS), Synchrony Financial (SYF)
●Wednesday: CME Group (CME), GE Vernova (GEV), Alphabet (GOOGL), Medpace (MEDP), AT&T (T), Teledyne (TDY), Tesla (TSLA), Texas Instruments (TXN)
●Thursday: AAmerican Airlines (AAL), Freeport McMoRan (FCX), Honeywell (HON), Lockheed Martin (LMT), Newmont (NEM), T-Mobile US (TMUS), Verisign (VRSN)
●Friday: American Express (AXP), SLB (SLB), Verizon (VZ)
This week’s numbers include:
●Monday: Leading Economic Indicators Index
●Thursday: Chicago Fed National Activity Index
●Friday: S&P Global Manufacturing and Services PMIs (flash)
Short-term NDX pivots
The Nasdaq 100’s (NDX) price action on Friday was more unusual than it may have appeared to be at first glance. The tech index closed lower and fell more than 2.5% intraday, something it’s done 820 other times since October 1985. Five trading days later, it was higher 56.8% of the time, which is a little below its 58% rate for all five-day periods. 2
But if we focus on a subset of these moves that more closely match Friday’s—an intraday decline of at least 2.5%, combined with a closing loss of less than -2%—we get 237 examples. After these, the NDX was higher five trading days later slightly less frequently, just 55.3% of the time.
However, the NDX did much more than that on Friday, both by falling to its lowest level in nearly a month, and by rebounding to erase some of the day’s loss. Here are four important aspects of Friday’s price action:
● a lower close
● a 2.5%-or-larger intraday decline
● the lowest intraday low in at least 20 trading days
● a close above the open
This represents a much more select sample of days—just 26 others since 1985. Five days later, the NDX was higher 61.5% of the time (16 of 26 cases). Aside from the fact that this is a small number of examples—which provides less confidence about drawing conclusions from them—the results also exhibited a fair amount of volatility: The index split evenly between gains and loss the first two days after the down day, and closed lower more often than higher on the fourth day after the down day.
Click here to log on to your account or learn more about E*TRADE's trading platforms, or follow the Company on X (Twitter), @ETRADE, for useful trading and investing insights.
1 MorganStanley.com. Global Insights Focus: When Momentum Crowds Out Quality. 7/1/26.
2 All figures reflect Nasdaq 100 (NDX) daily prices, 1985-2026. Supporting document available upon request.