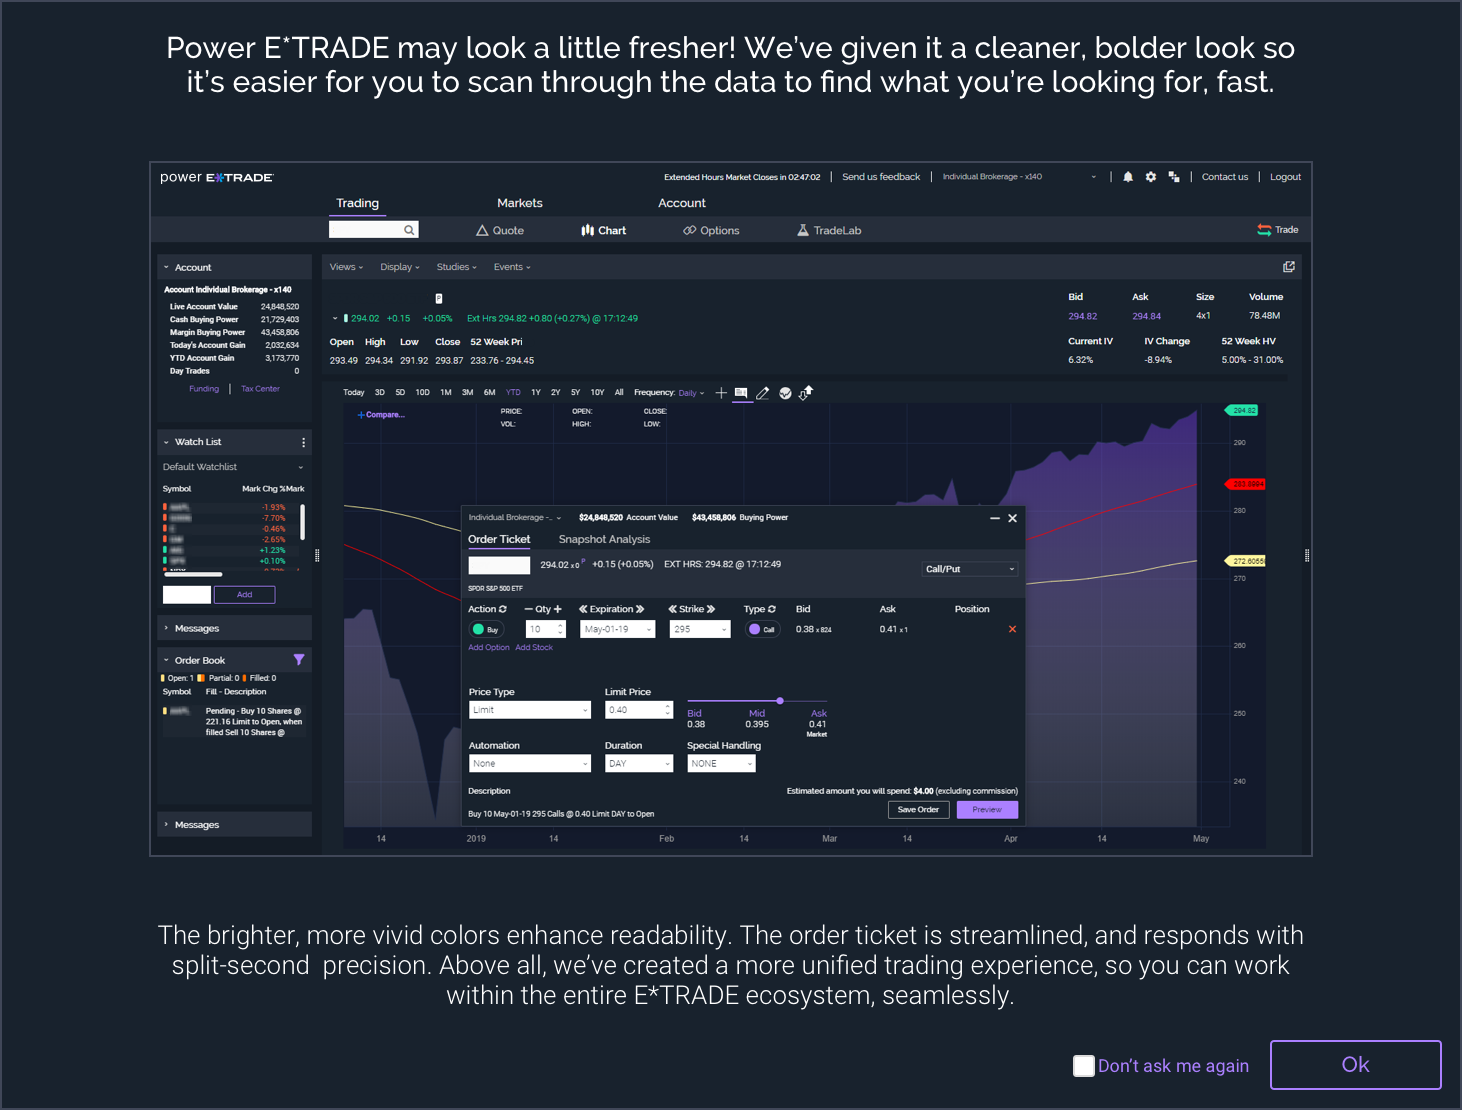
Power E*TRADE Release Notes
Version 202
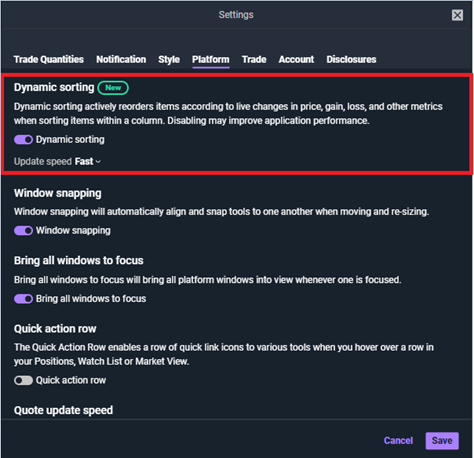
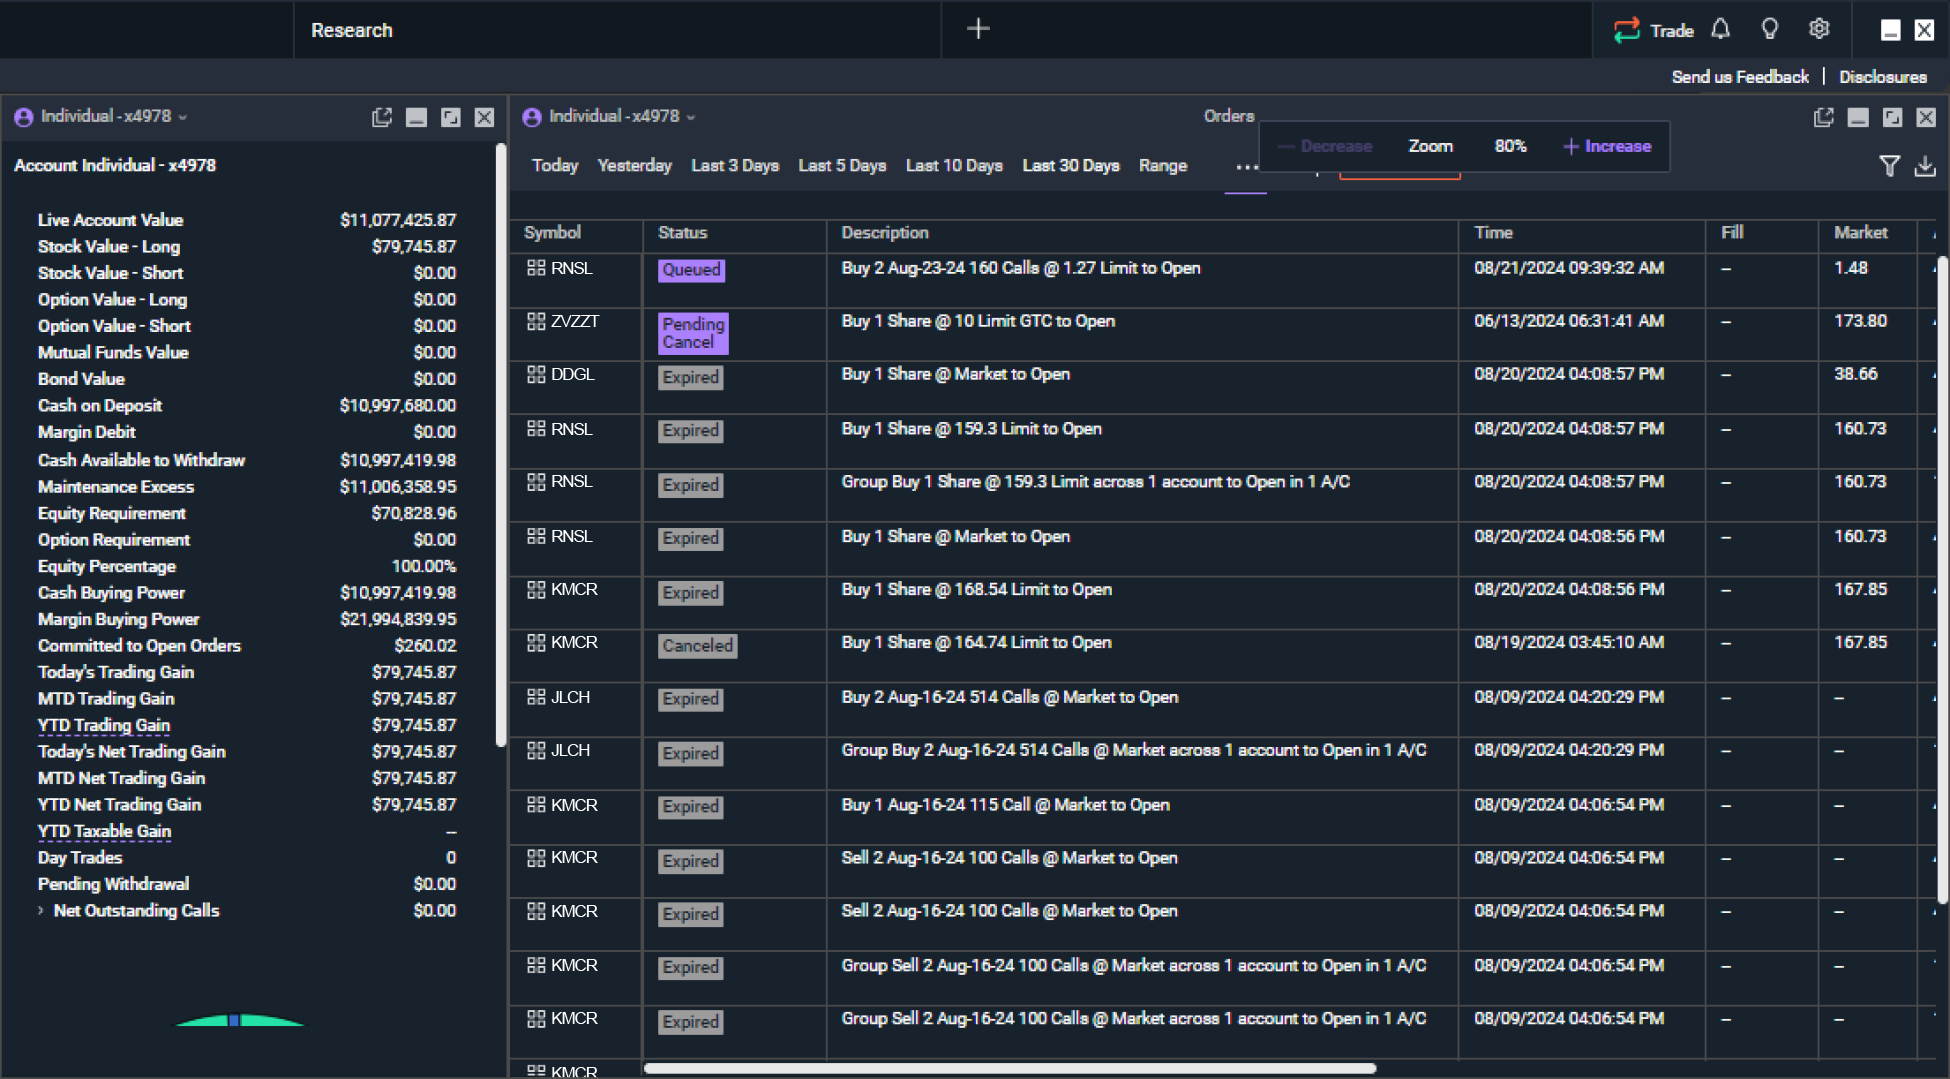
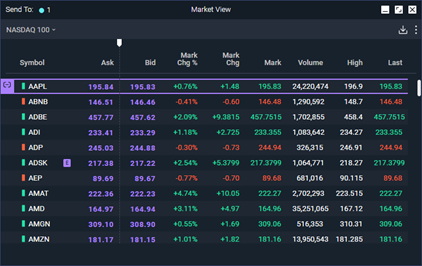
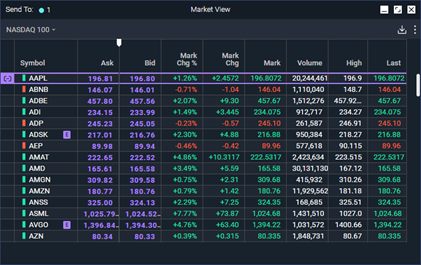
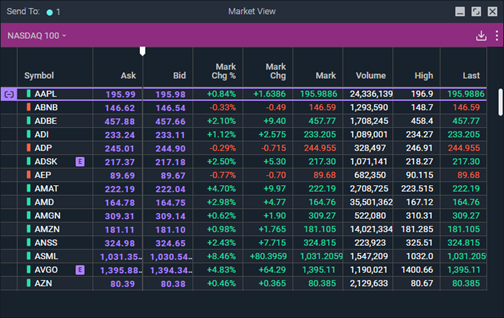
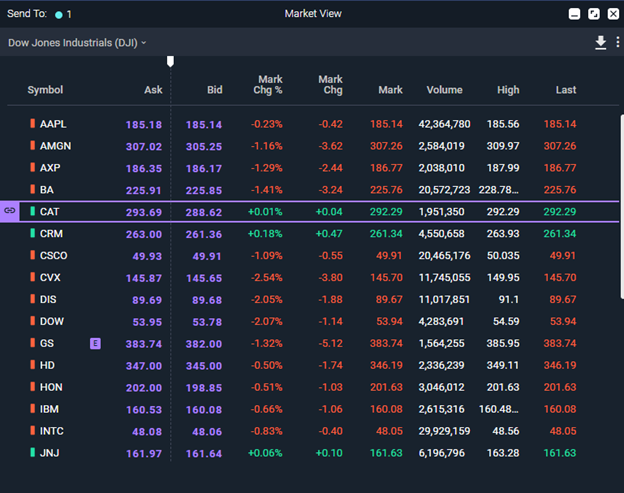
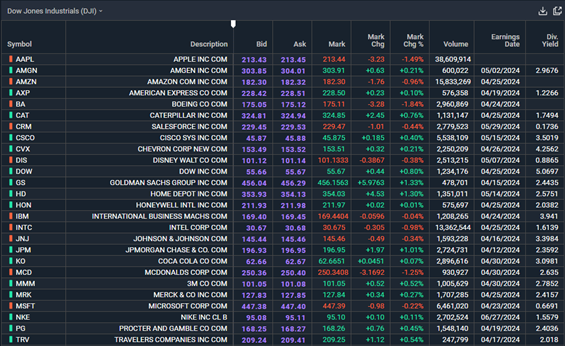
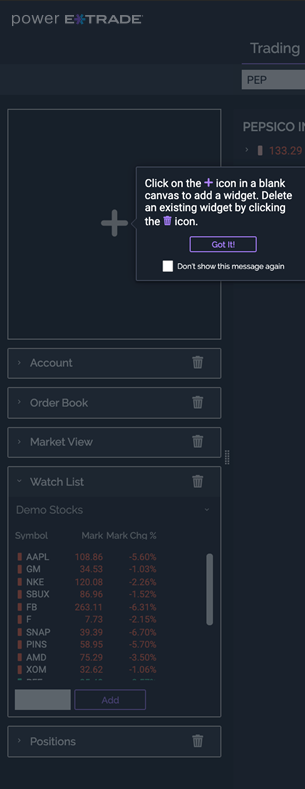
Dynamic Sorting – Watch List and Market View
Dynamic Sorting is now available as an optional setting for the Watch List and Market View tools. When enabled, your tables will automatically re-sort at regular intervals based on your selected sort criteria—so the information you care about stays at the top as prices and market data change. This makes your Watch List and Market View easier to scan and helps you spot updates faster.
News Enhancements
The News tool has been enhanced with a refreshed look and improved usability. In addition to visual updates, it now supports symbol linking for quicker navigation to relevant securities. You can also filter news by selecting a specific watchlist or account, making it easier to view headlines tailored to the lists you follow.
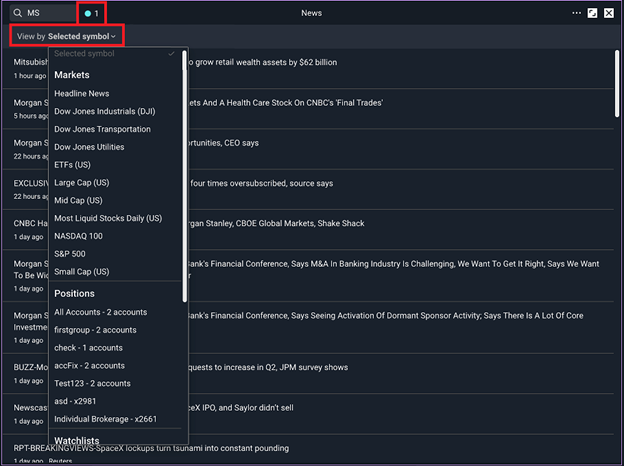
For illustration only. News is not up-to-date or a recommendation.
Futures Trading
Futures order tickets now load more quickly and efficiently. This will result in reduced waiting time when opening and interacting with the futures ticket, supporting a smoother order-entry experience.
Charts
Multiple chart enhancements have been made focusing on performance and speed. This will provide faster chart rendering and more responsive interactions.
We have also resolved a chart issue affecting candlestick data for customers in certain time zones.
Previous releases
Version 201
High Low Tool
The maximum number of High Low tool windows has increased from 5 to 8. This gives you more flexibility to monitor additional symbols without needing to swap configurations.
Charts – Volume Study
We have fixed an issue where the volume study was not streaming accurately during extended hours sessions.
Version 200
Positions Widget
You will now maintain your column sorting preferences across sessions within the Positions widget. Once you set a preferred sorting order, this preference will be saved and automatically applied in your next session, providing consistency and saving time.
Live Action
Live Action scans will now persist across sessions. This enhancement ensures that any scans performed using Live Action will be retained, allowing you to continue your work seamlessly without needing to re-initiate scans in subsequent sessions.
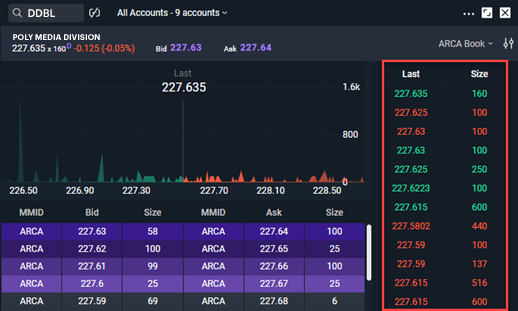
Market Depth
Upon tool launch and when switching symbols within the tool, the quantity populated in the order ticket now follows your global quantity setting (instead of defaulting to 1).
Charts
Chart responsiveness has been enhanced to more effectively display data across custom window sizes and layouts.
Version 199
Ticker Tape
Our new Ticker Tape allows six of the most popular symbols to remain visible at all times when the feature is enabled, providing persistent market awareness.
Orders Tool Enhancement
Our right-click menu has been added to the Orders tool, enabling you to take action on symbols directly from the order book—streamlining workflows and improving efficiency.
Quick Trade Tool Enhancement
The Quick Trade tool now supports options trading. You can send options to Quick Trade using existing symbol linking functionality, making it easier to move from analysis to execution.
Version 198
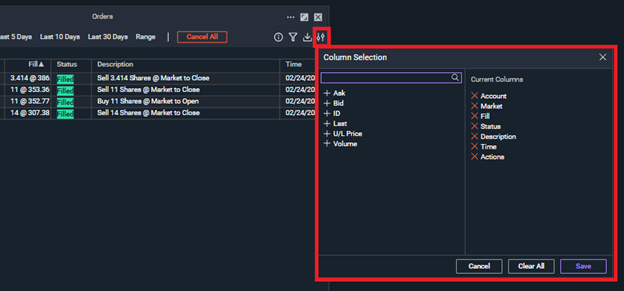
Orders Tool Improvements
You can now configure settings and customize visible columns within the Orders tool. This enables a more tailored view of order details based on individual workflows and preferences.
Today’s Realized Gain Field
A new Today’s Realized Gain field to both the Balances tool and the Account widget has been added. This update provides clearer visibility into realized P&L activity for the day, helping you quickly assess performance alongside your existing balance figures.
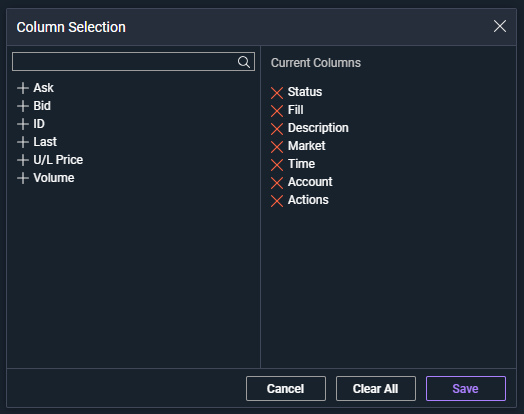
New Data Table Columns
% of Portfolio
Adds visibility into how each position’s value relates to the overall account value, making it easier to understand portfolio concentration at a glance.
U/L Change %
This column will display the % change of the underlying security, helping you quickly gauge underlying-driven movement without leaving the Positions tool.
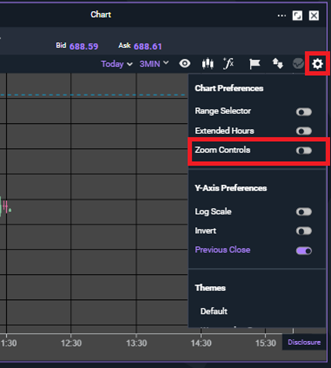
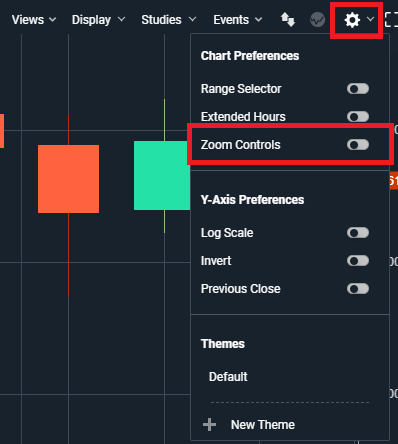
Chart Zoom Control
A new setting allows you to turn on/off the on-chart zoom controls to better match your preferred chart interaction experience.
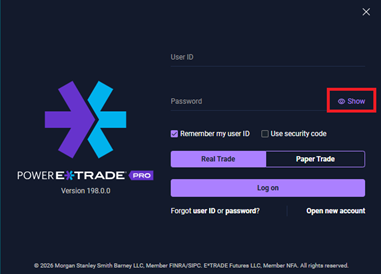
Login Screen Update
You can now toggle password visibility on the login screen, reducing entry errors and improving usability.
Version 197
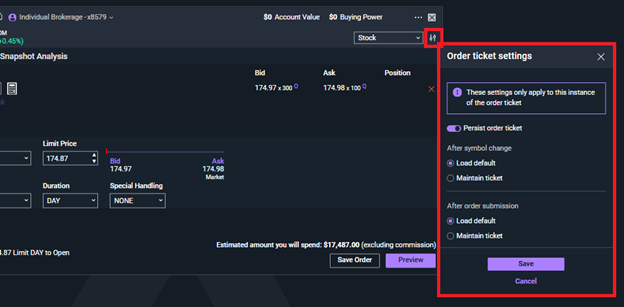
Order Ticket Settings
We’ve introduced Order Ticket Settings to give you more control over how your order ticket behaves during and after order submission. With Order Ticket Settings, you can now:
Persist the order ticket after submission
Keep the ticket open and set to your desired location and size after placing an order so you can quickly submit additional orders without reopening the ticket.
Choose post-submission ticket behavior
Select whether the ticket should revert to default values after submission or maintain your existing inputs for faster repeat entry.
These new controls help streamline repeat order workflows and allow you to tailor the ticket experience to your preferred trading style.
Version 196
Layout Manager
Our new Layout Manager tool is now available, allowing you to create and manage custom layouts. This feature is particularly beneficial for users who frequently switch between different computer and monitor setups, ensuring a seamless transition and consistent workspace configuration. Within the Layout Manager settings, you can also choose to disable Auto save so that the changes you make to your platform do not save, until you manually do so.
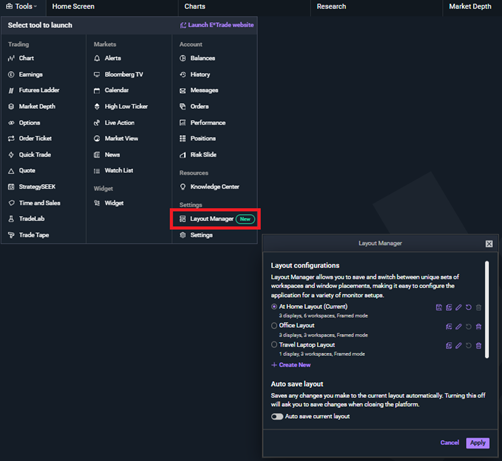
Chart Enhancements
Themes: Customize your trading charts with our new Chart Themes feature. You can now personalize color patterns to suit your preferences, enhancing visual clarity and making data interpretation more intuitive.
Previous Close Line: We've added a horizontal line on charts to indicate the security's closing price from the previous trading day. This feature provides a quick reference point for analyzing market trends and making informed trading decisions.
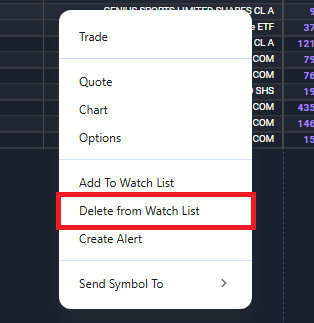
Deleting From Watch List
Managing your watch list is now more convenient. You can easily delete a security from your watch list using the right-click menu, streamlining the process and improving list management efficiency.
Version 195
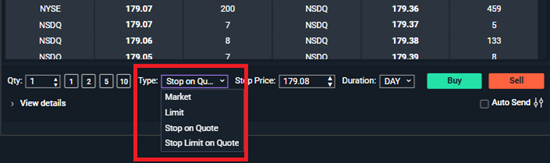
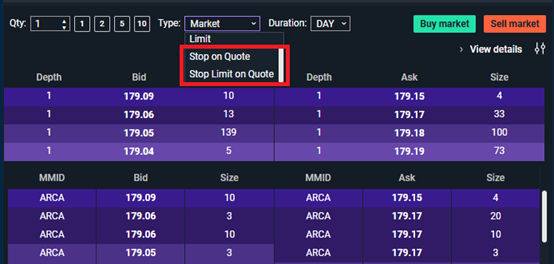
Market Depth Enhancements: We’ve expanded the available order types in the Market Depth order ticket to include stop on quote and stop limit on quote orders, providing you with more strategic options to manage your trades effectively.
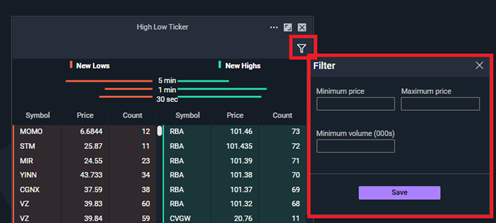
High Low Ticker Tool Filters: Customize your market analysis with new price and volume filters added to the High Low ticker tool, allowing you to focus on the data that matters most to you.
Expanded PnL Metrics: Dive deeper into your investments with our enhanced Lot level view. Now, you can see the profit/loss amount for individual lots, giving you a clearer picture of your portfolio's performance and making it easier to optimize your tax plan.
Extended Hours Speed Keys: We’ve added a new Speed Keys duration for the extended hours session, allowing you to quickly trade with your keyboard outside of standard market hours.
Persistent Order Book Filters: Enjoy a seamless trading experience with order book filters that now persist across sessions, saving you time and effort in setting up your preferred views.
Enhanced Notes Experience: We’ve improved the experience for adding notes to data tables, making it easier for you to annotate and organize your insights.
Industry Column Addition: Gain more insights with the new Industry column added to both Market View and Watch List, helping you to better categorize and analyze your list of securities.
Version 194
Extended hours profit/loss streaming
You can now include extended hours changes in your Portfolio by enabling Extended Hours Profit/Loss Streaming in Platform Settings. By enabling this feature, your balances and PnLs across the platform will update around the clock for securities which trade outside of normal market hours.
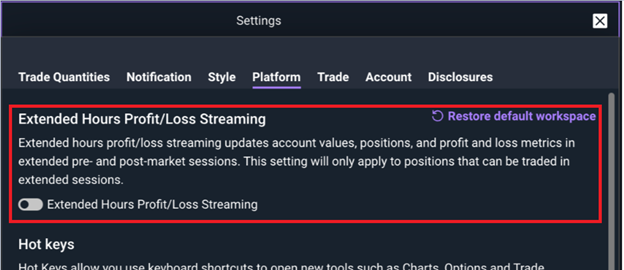
Chart enhancements
We have upgraded our charts library with several improvements to chart performance and stability. While you may not notice a change on the interface, this sets the stage for further enhancements down the line.
Version 192
Market depth enhancements
We’re thrilled to announce several new features to our Market depth tool, designed to help enhance your trading experience. Now you can utilize Speed keys, previously available only on our Watch list and Charts tools, to execute trades with keyboard shortcuts directly within Market depth. These settings are seamlessly integrated, requiring no additional enablement or configuration.
Other enhancements include:
- Open order display: Identify the price of your open orders, now highlighted within the depth table.
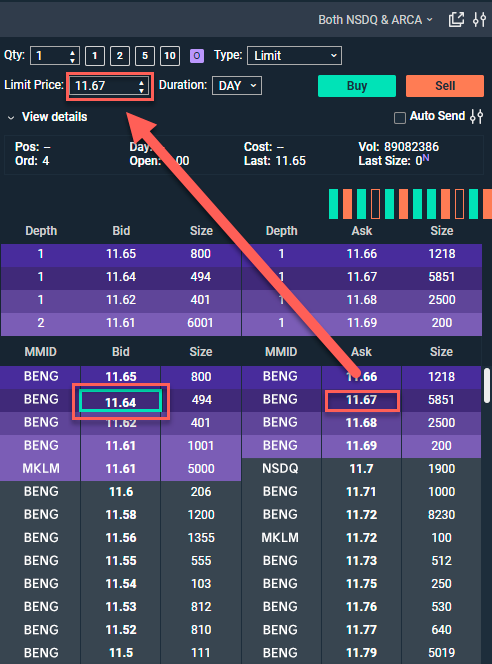
- Quick price entry: Left click on a price in the depth table to automatically fill the limit price field in the order ticket.
- Order ticket persistence: Your market depth order ticket settings will now be saved across sessions, preserving your preferred configurations.
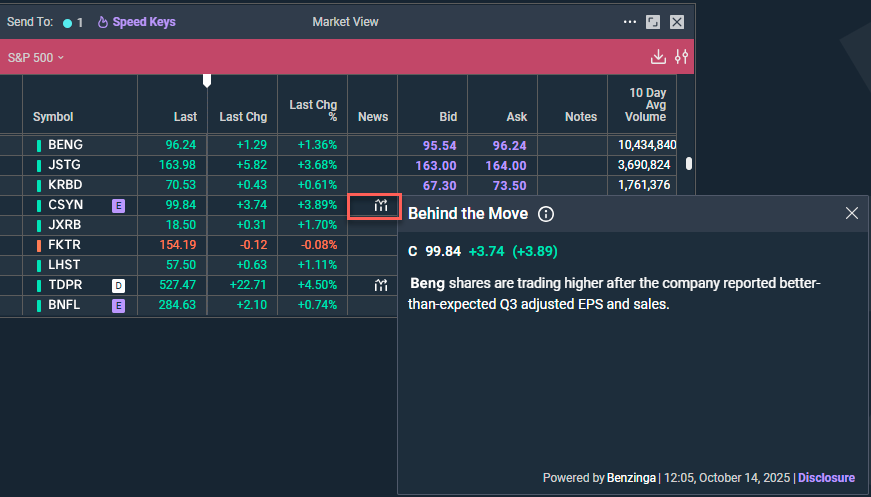
News column on Positions, Watch list & Market View
Stay informed with the new column for News on our Positions and Watch list pages. If a stock experiences significant movement, the Behind the move chip will appear, providing insights into the reasons behind the change.
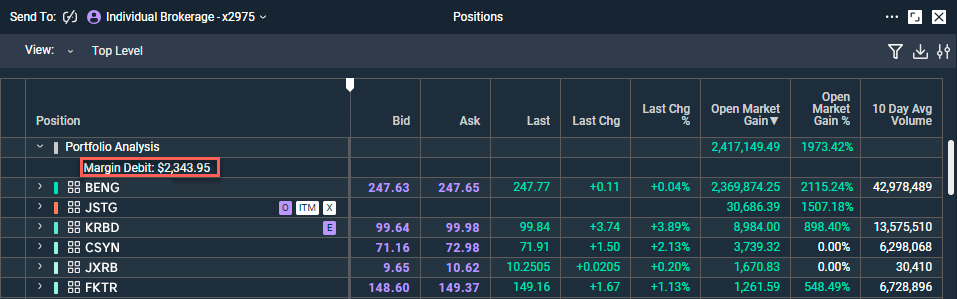
Margin debt on Positions
Now monitor your margin debit balance details directly from the Positions page. Details will be displayed in the Portfolio analysis section for easy access.
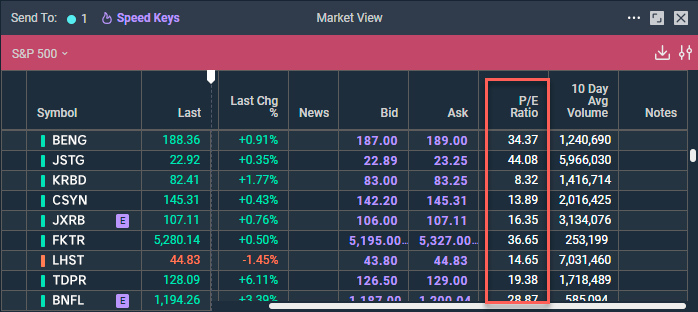
P/E columns additions
View P/E numbers for multiple securities in one convenient location. The new P/E column is now available on our Positions, Watch list, and Market view pages. Add it by selecting the slider icon and choosing “Select Columns.”
Version 191
Market Depth enhancements
We have introduced two enhancements to the Market Depth tool on Power E*TRADE, designed to help provide you with greater efficiency in your trading.
Customizable trade quantities
You can now customize the quick quantity boxes within the Market Depth order ticket, giving you a way to efficiently and quickly place trades.
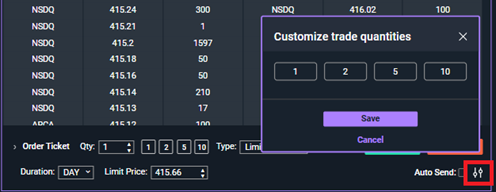
You can also increase the max number of instances of the Market Depth tool from 5 to 8.
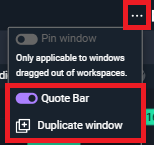
Charts quick actions menu additions
Two new controls have been added to the quick actions menu in the Charts tool.
- Quote Bar Toggle: This feature allows you to hide the slim quote bar, giving you more space to show the contents of your chart.
- Duplicate Window: This feature enables you to conveniently launch additional charts while preserving the settings and customization applied to the original instance.
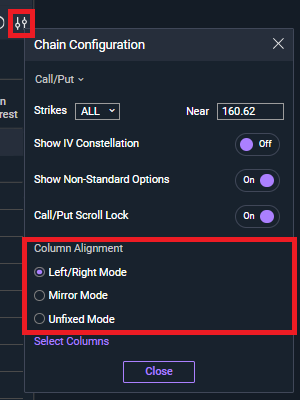
Options Chain modes
We have introduced a new feature that allows users to change their viewing mode within the Options Chain, offering three distinct choices to choose from:
- Left/Right Mode: The call and put sides of the chain of now have the same column order arranged from left to right.
- Mirror Mode: The call and put sides of the chain now have the same column order arranged from inside to outside.
- Unfixed Mode: Any changes made to the column order on one side will not affect the order on the opposite side.
Version 190
Orders tool enhancements
We’ve updated our Orders tool row height to align with spacing found in other tools within the platform, like Positions or Watch lists. This means information in the Orders window will appear more compact, allowing you to see more information without having to adjust the tool size.
Additionally, the quick action menu has been added to Orders. When you left click on a row, a window will appear that includes a list of actions that can be used to manage your order.
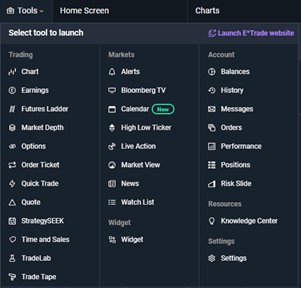
Tools dropdown menu
The tools menu has been enhanced to with new categories, sorting, and net new selections.
Moving forward, tools will be organized by categories, with the list of tools within each category sorted alphabetically. This should help you better locate your desired tool when launching new tools.
We’ve also added new items to the dropdown menu which were previously only available in other areas of the platform. The addition provides a one stop shop for launching tools or accessing features.
Market Depth update
We’ve updated the Trade Ticker feed in our Market Depth tool to now reflect extended hours trade data. This will help you stay informed of trades pre and post market, in addition to regular market hours.
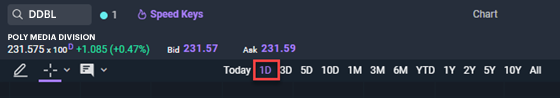
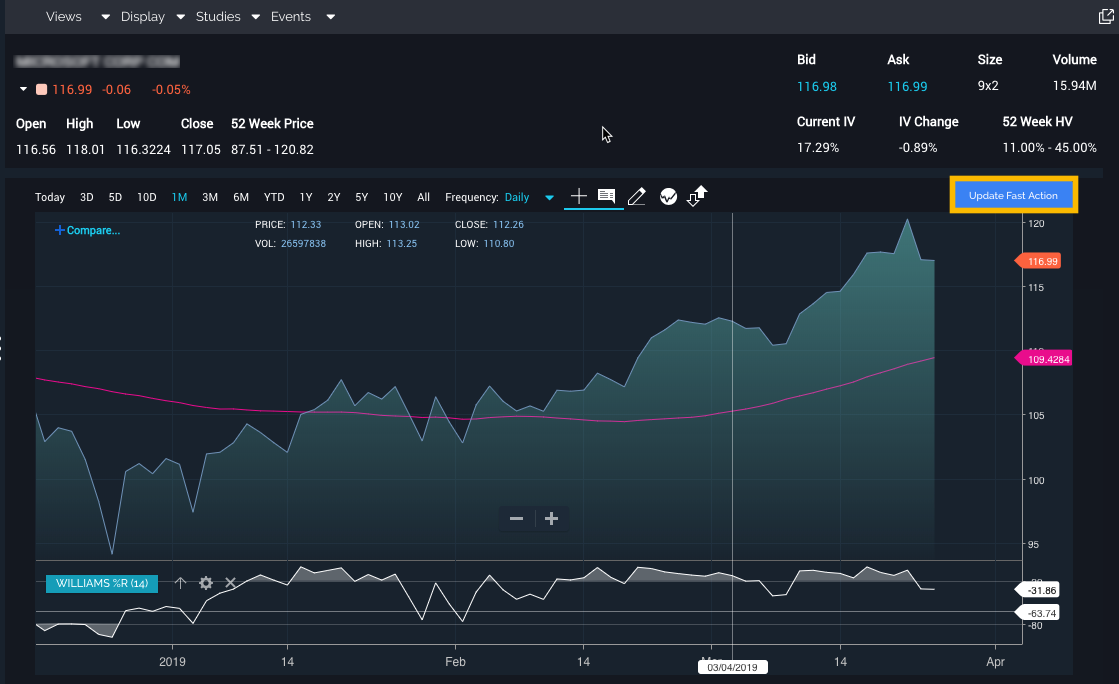
Charts timeframe addition
We’ve added a new 1-day timeframe to the already robust library of choices. The new addition allows you to quickly see the past 24 hours of trading activity on a chart with the 1D timeframe shortcut.
Positions filters persist
Filters added to the Positions page, are locked into place across sessions. This allows you to configure the information you’d like to see within the Positions window. The filter will stay in place until you close the window or update them.
Version 189
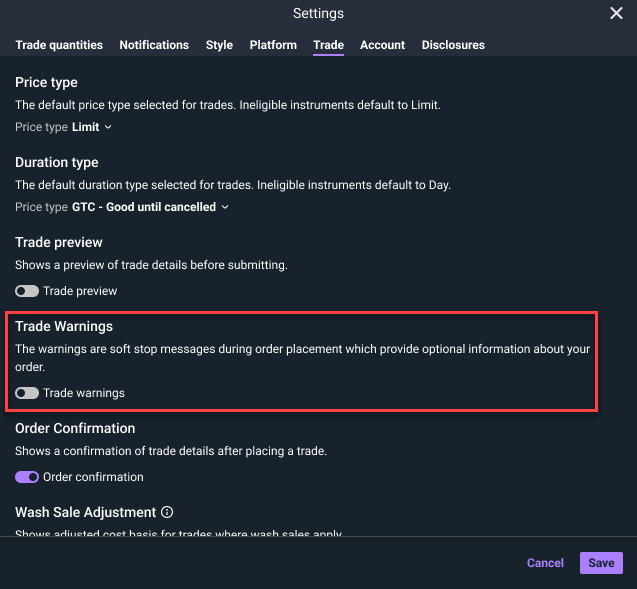
Trade Warnings Setting
The Trade warnings setting allows you control whether you see soft trade warnings during the order placement process. Soft warnings (as opposed to hard warnings, which prevent an order from being placed) provide additional information on your order, dealing in topics such as buying power, existing orders, security restrictions, use of unsettled funds and wash sales, prior to the order being placed.
When a soft warning is triggered, an order will be prompted to the preview stage even when Trade preview is turned off.
Toggling this setting off will prevent non-essential soft warnings from being displayed, preventing the preview stage if auto send is enabled.
To navigate to the Trade Warnings setting, launch the Settings menu by clicking the gear icon in the top right corner of the platform. Within Settings, select the Trade tab and scroll down to Trade Warnings.
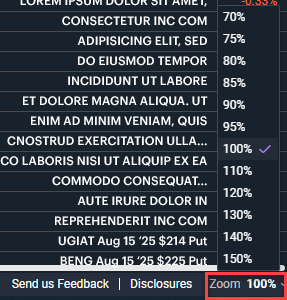
Zoom
Zoom controls have been added and can be found in the footer of the Power E*TRADE Pro. The new feature provides added visual flexibility, allowing you to increase and decrease content size within the platform with a single click. We’ve also introduced expanded levels of zoom, ranging from 70% to 150% in 5-10% increments, giving you more control.
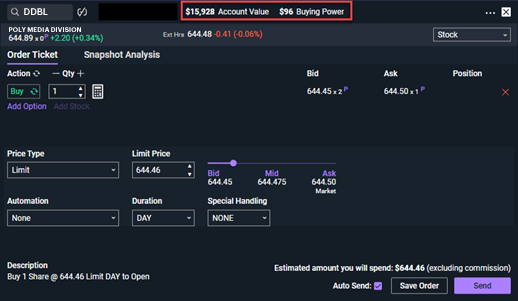
Order ticket enhancements
Stay informed throughout the order placement process with the addition of Account Value and Buying Power, found at the top of our order ticket.
Version 186
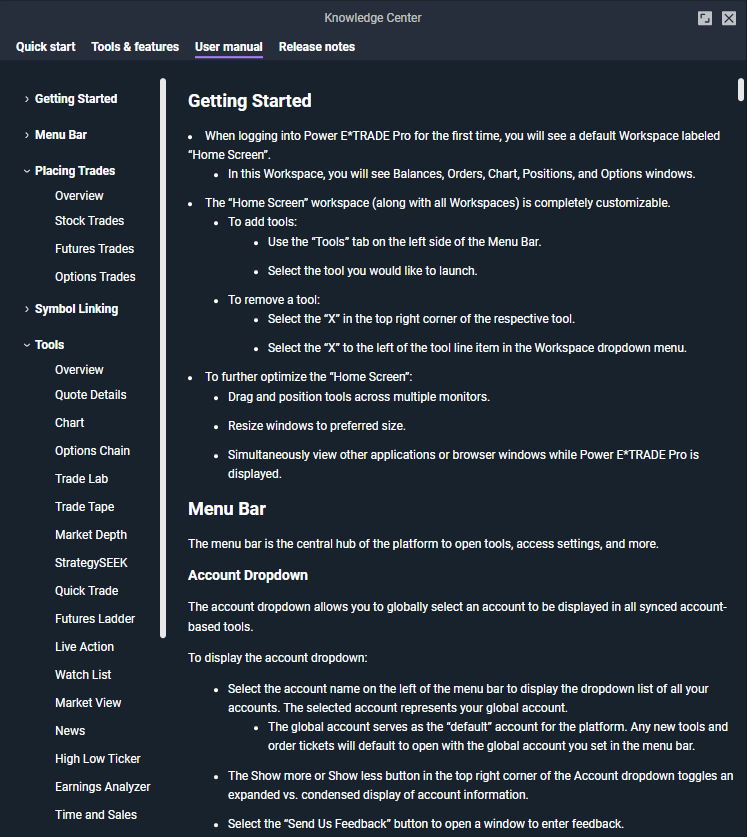
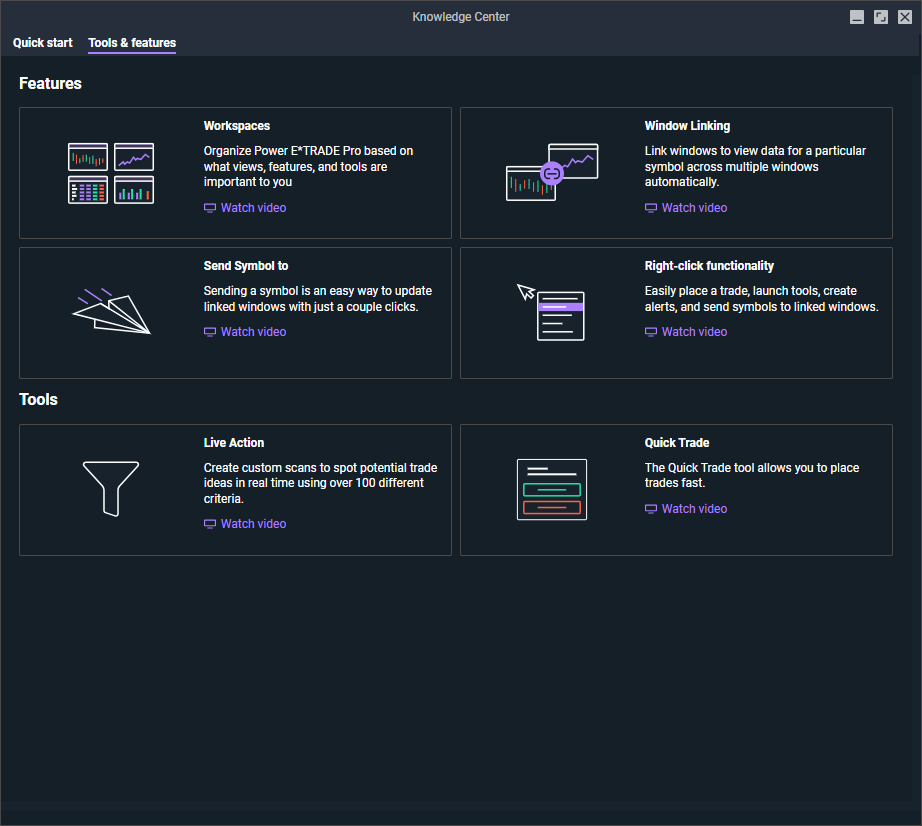
User manual – now available
The User manual provides an in-depth guide on using Power E*TRADE Pro. Whether you have a question about a column header or would like a complete “How to” guide for using our app, the User manual has you covered.
To launch the User manual, click on the light bulb icon in the top right corner of the menu bar to launch the Knowledge Center. In the Knowledge Center, select the User manual tab in the navigation menu. In the User manual, table of contents headers may be expanded to view all associated sub-sections. Clicking on any of these headers will navigate you to the location of the corresponding topic within the User manual.
Version 185
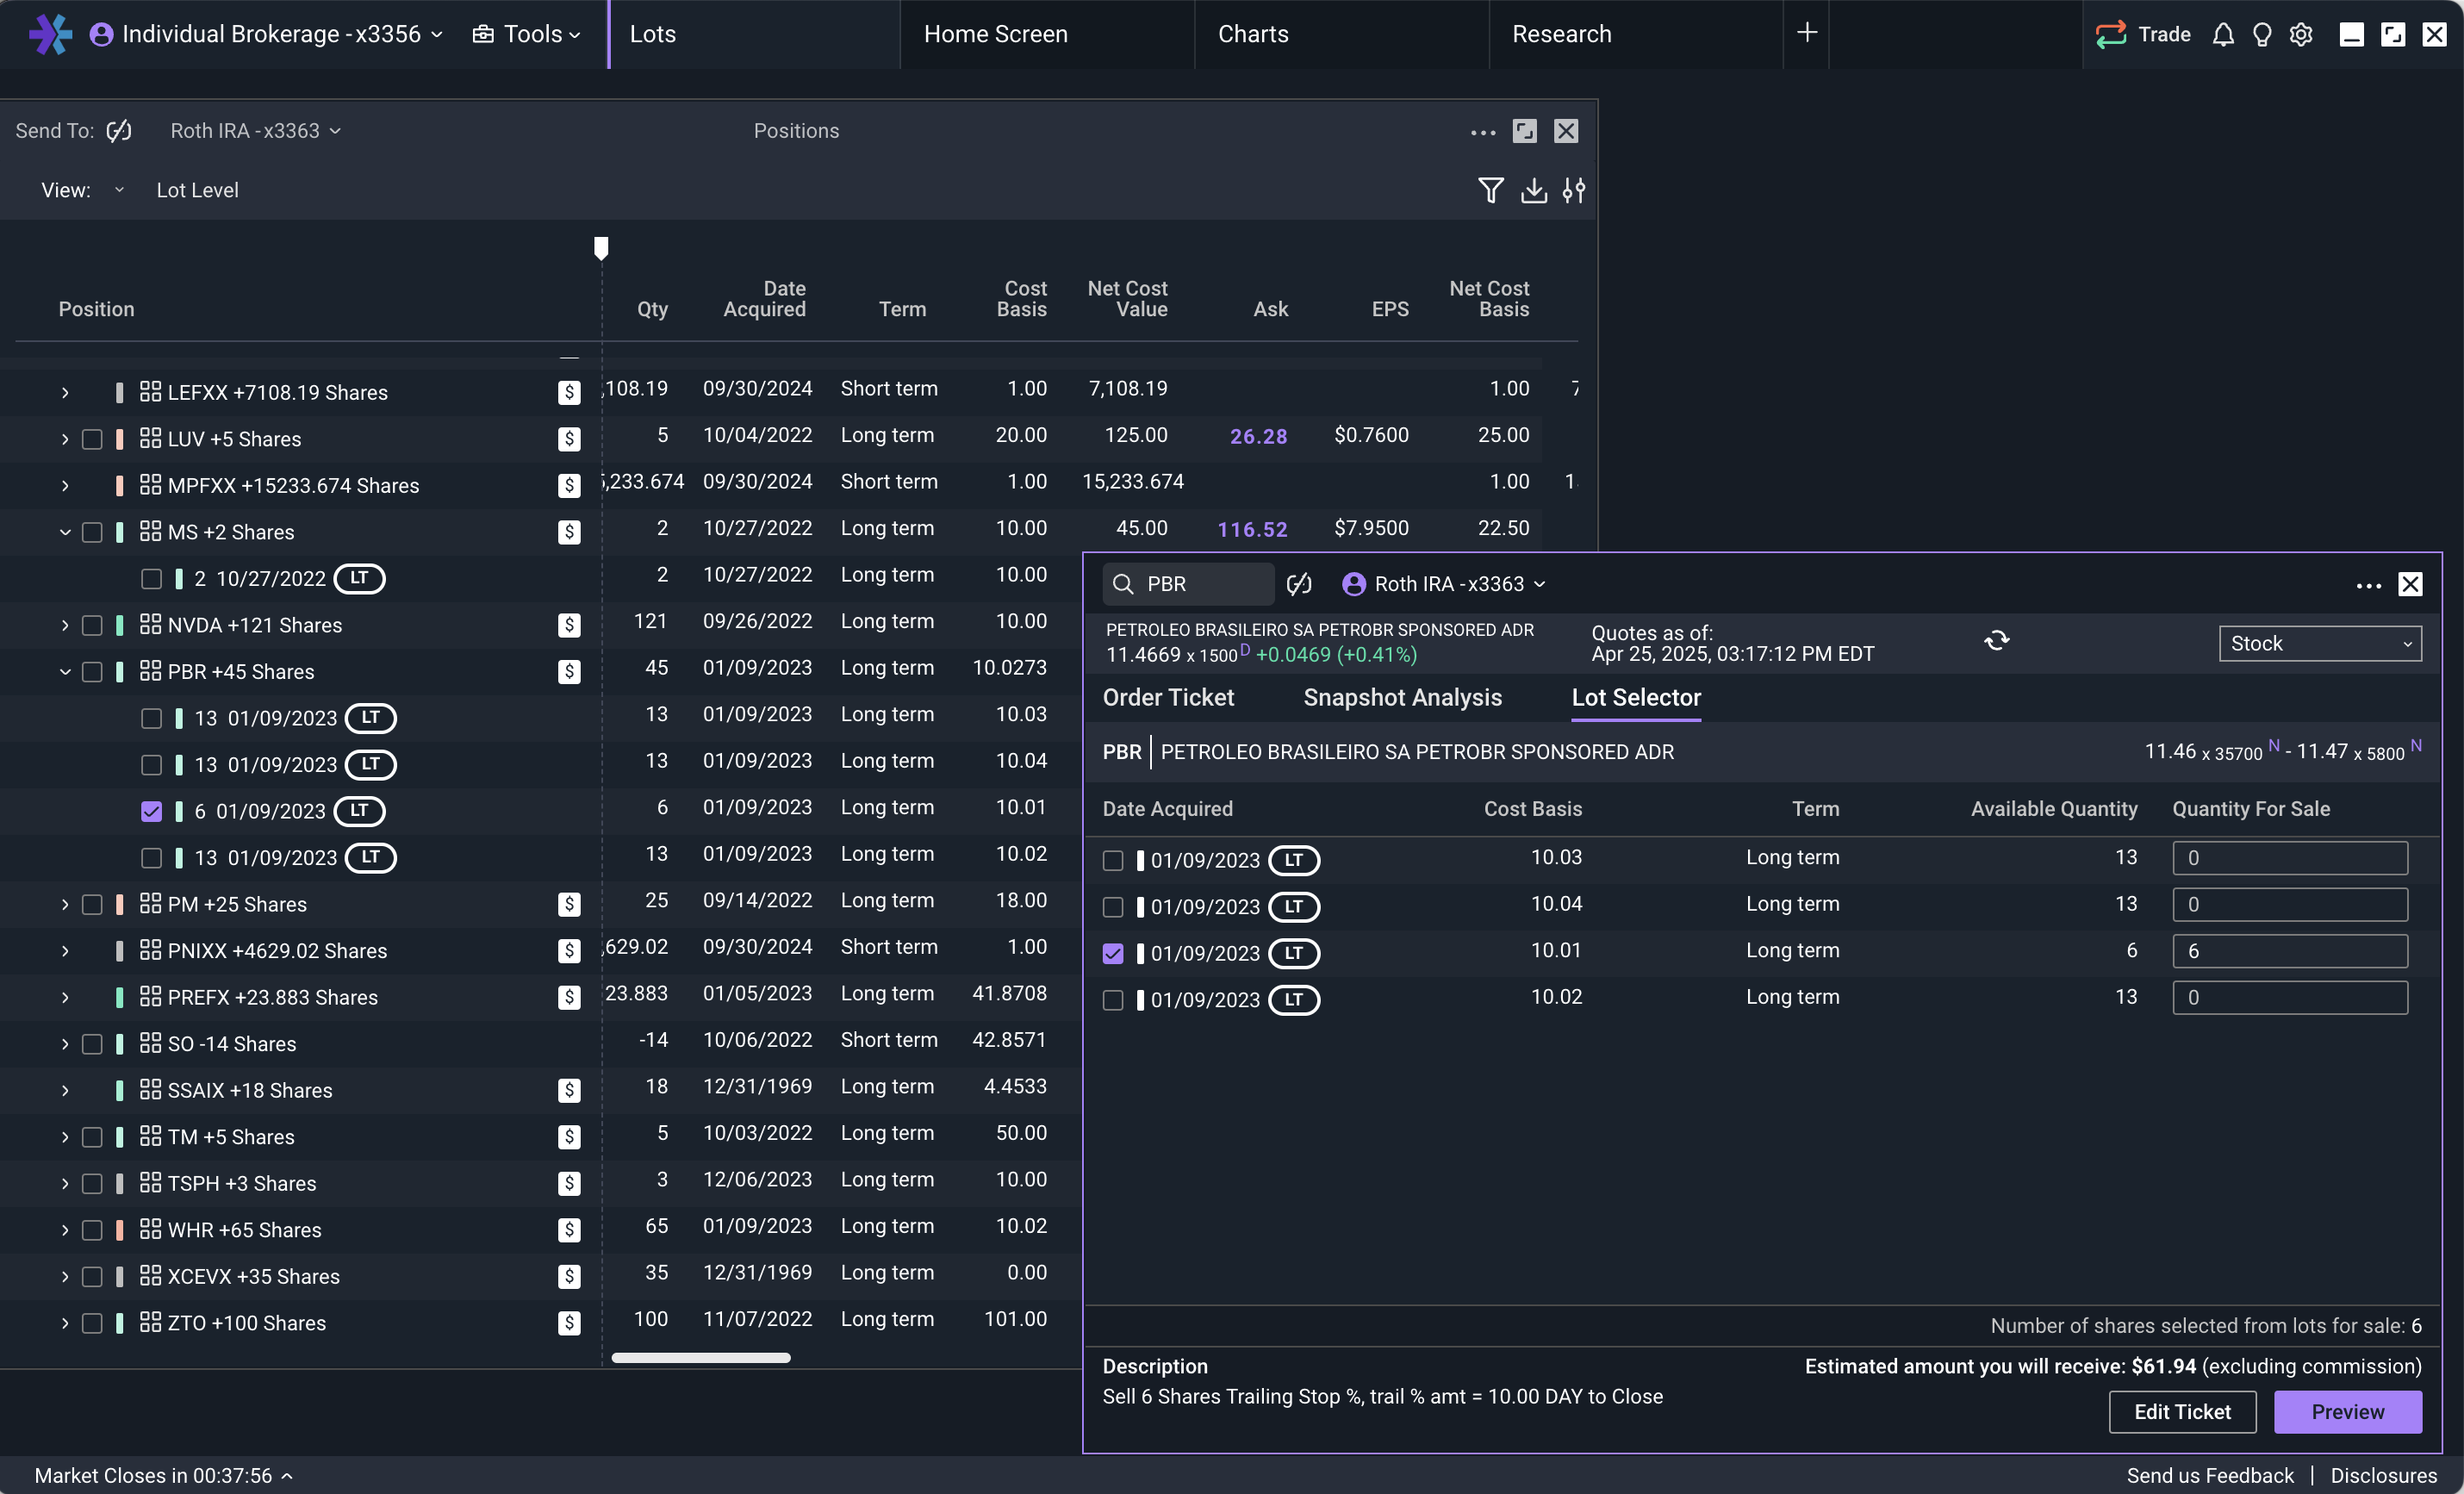
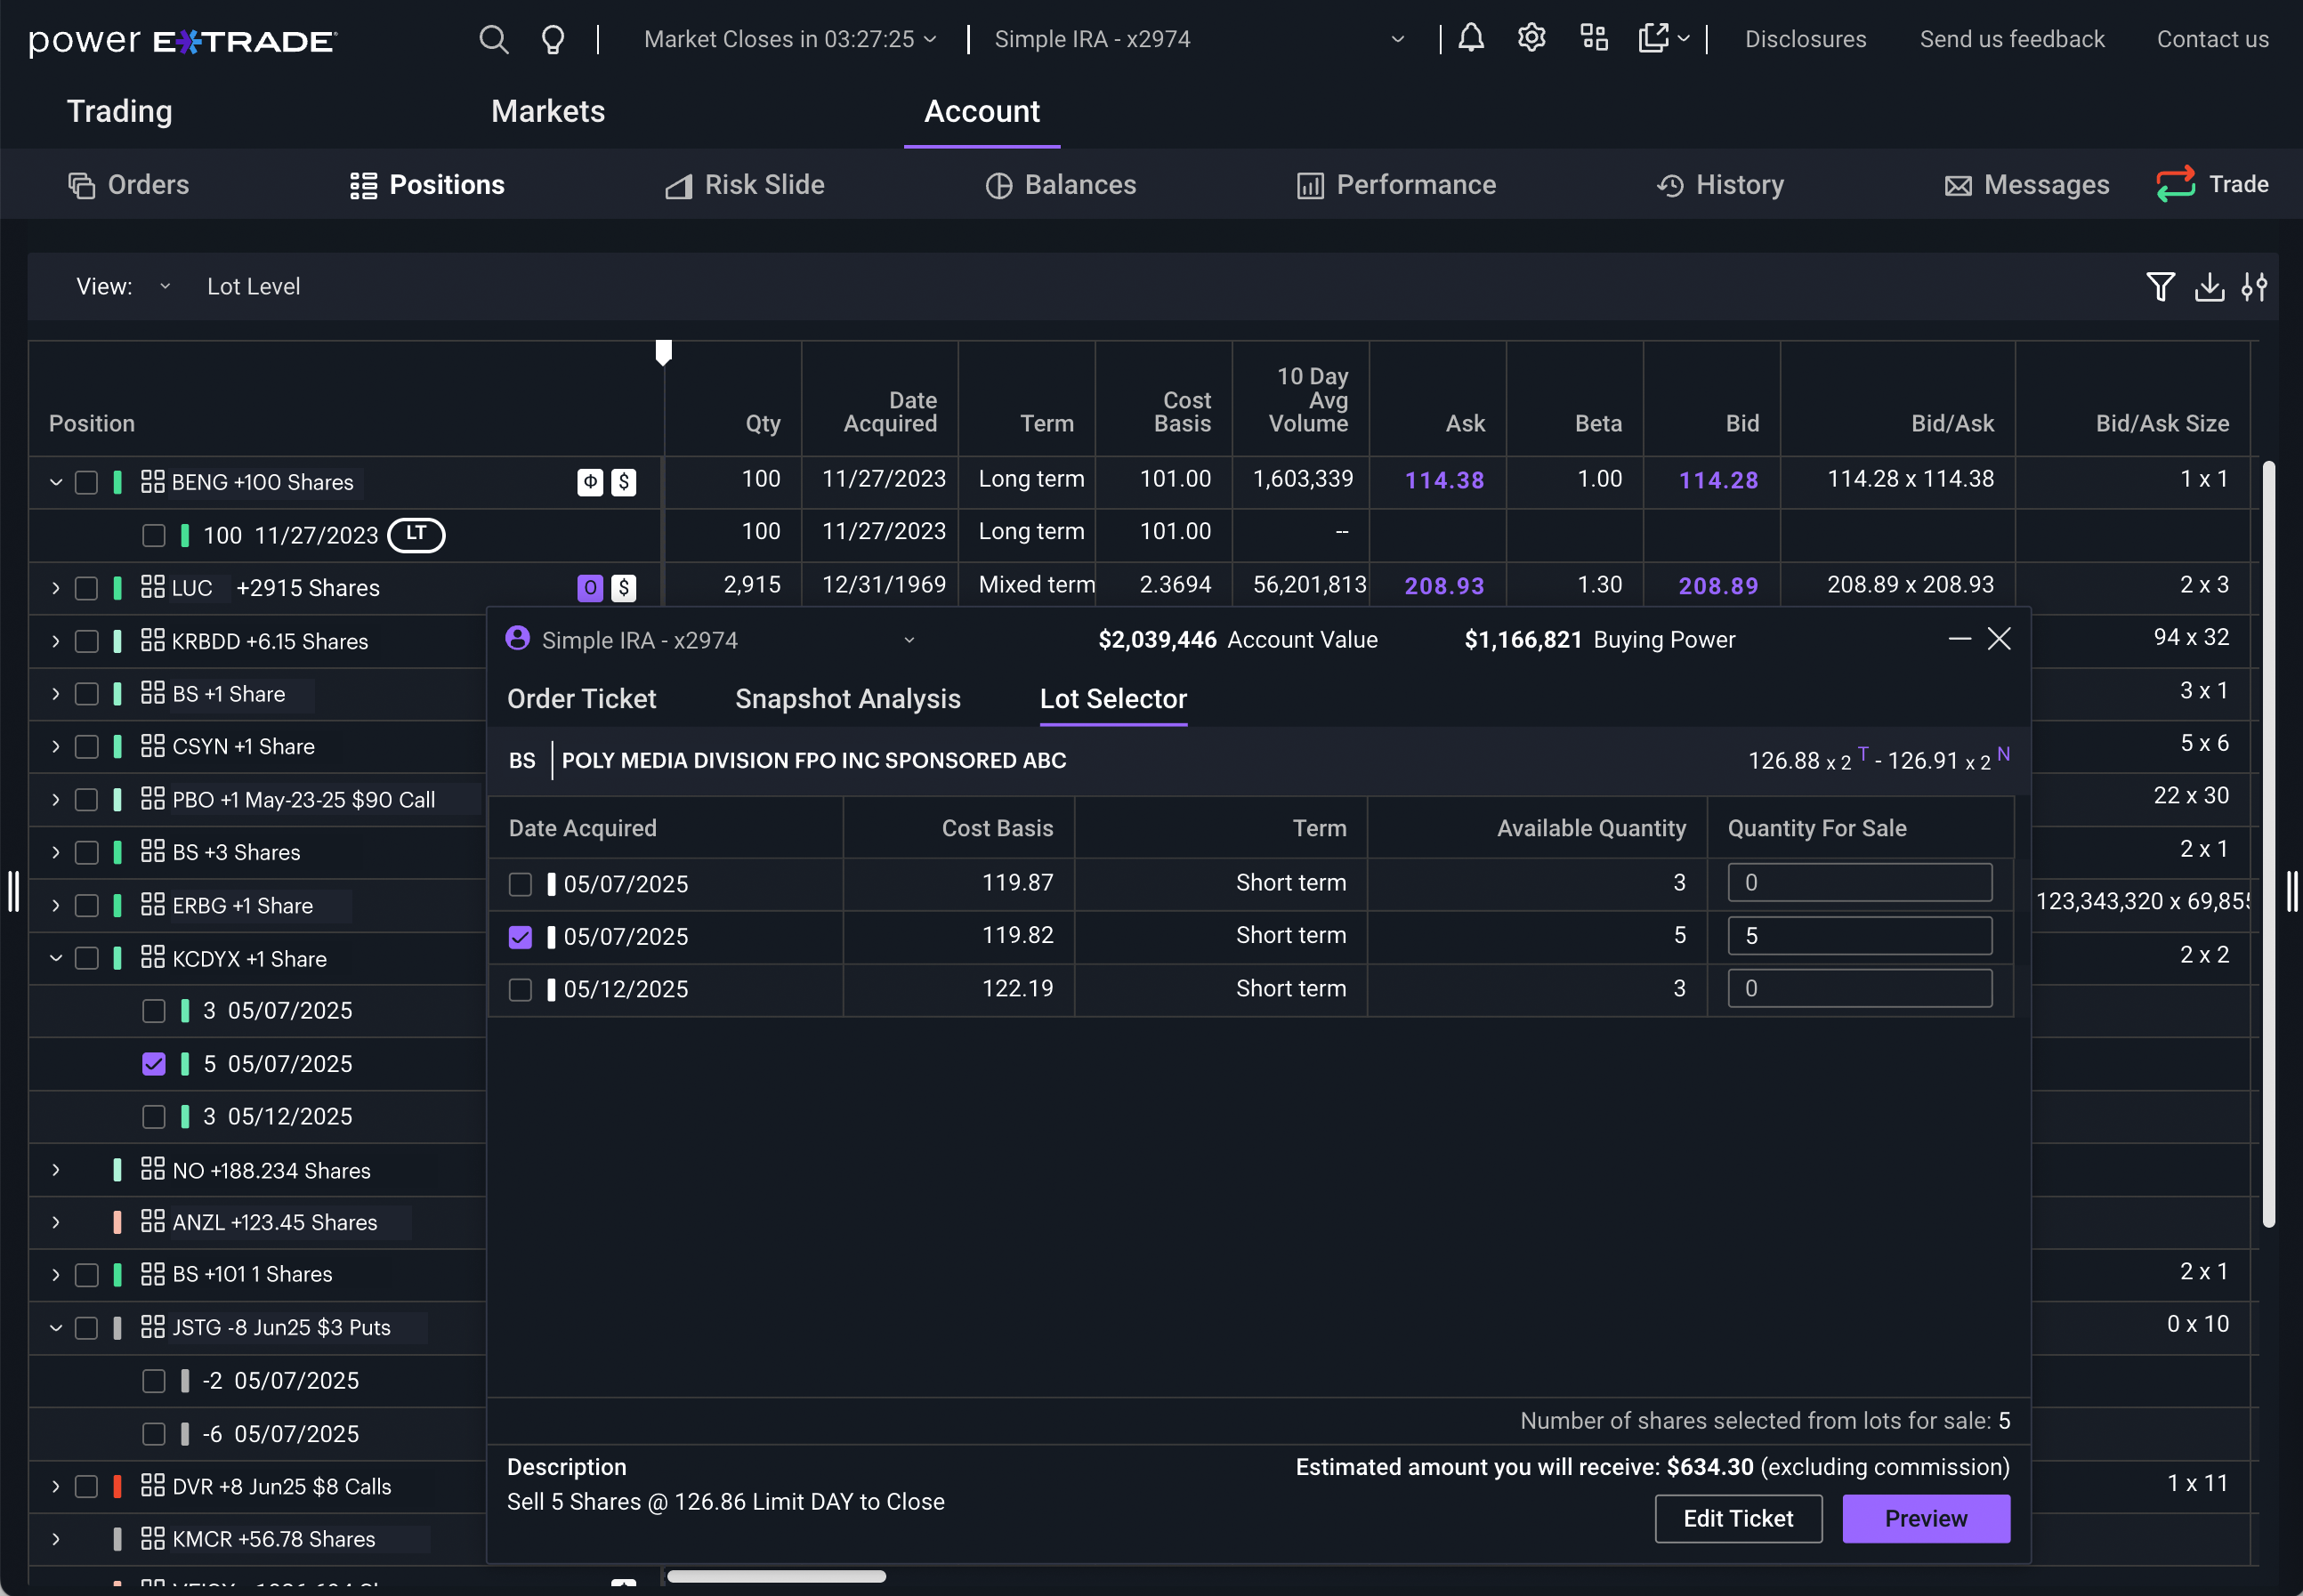
Tax lots on Power E*TRADE Pro
Now you can view tax related information along side your positions and make more informed trading decisions fast. The information will be viewable when a position is made up of multiple lots and will include details like cost basis, acquisition date, and taxable profit/loss.
To view tax lots, simply select Lot Level as your view type in the Position page View dropdown.
Choose specific lots you’d like to trade by checking the corresponding box on the Positions page or in the order ticket from the Lot Selector. This allows you to close a position, harvest losses, and/or preserve long term gains and positions directly in the Power E*TRADE platform.
Please note that Morgan Stanley and its affiliates do not provide tax advice, and you always should consult your own tax advisor regarding your personal circumstances before taking any action that may have tax consequences.
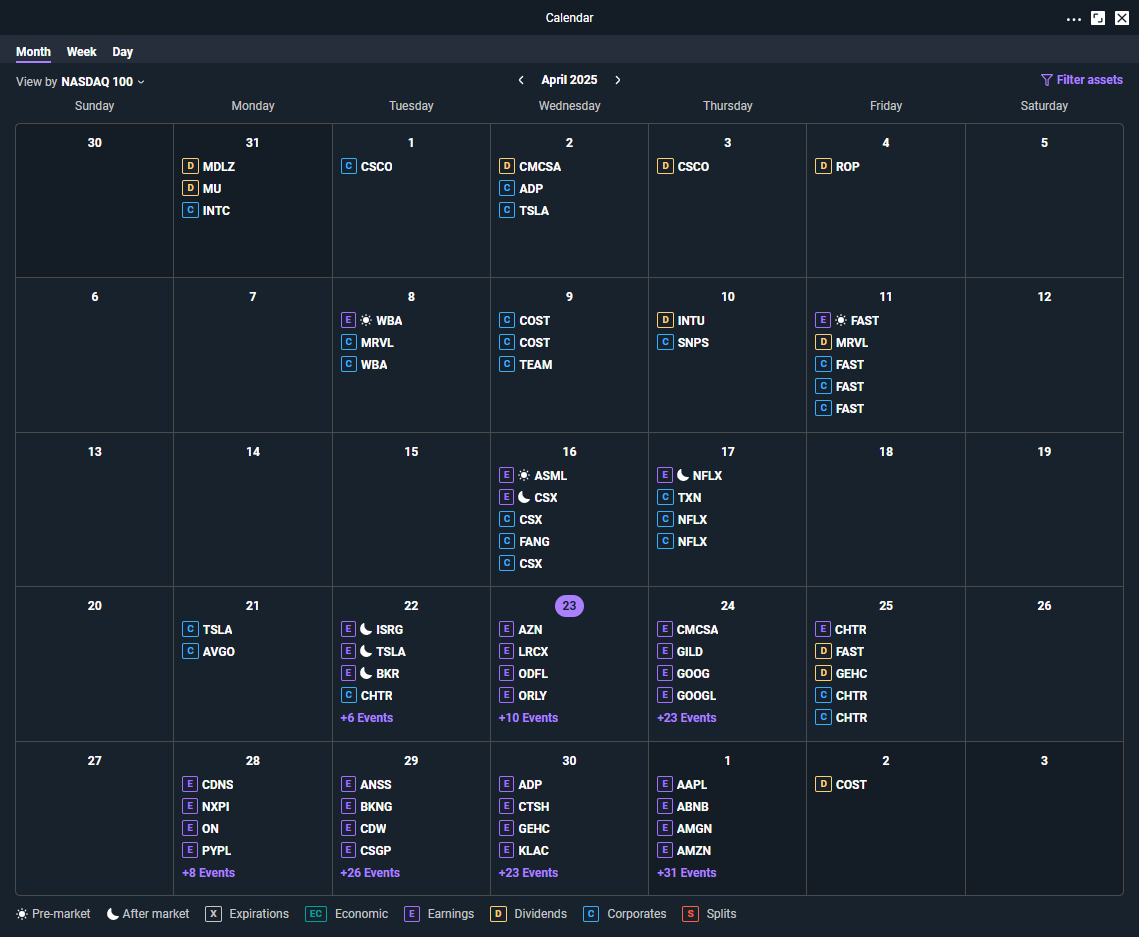
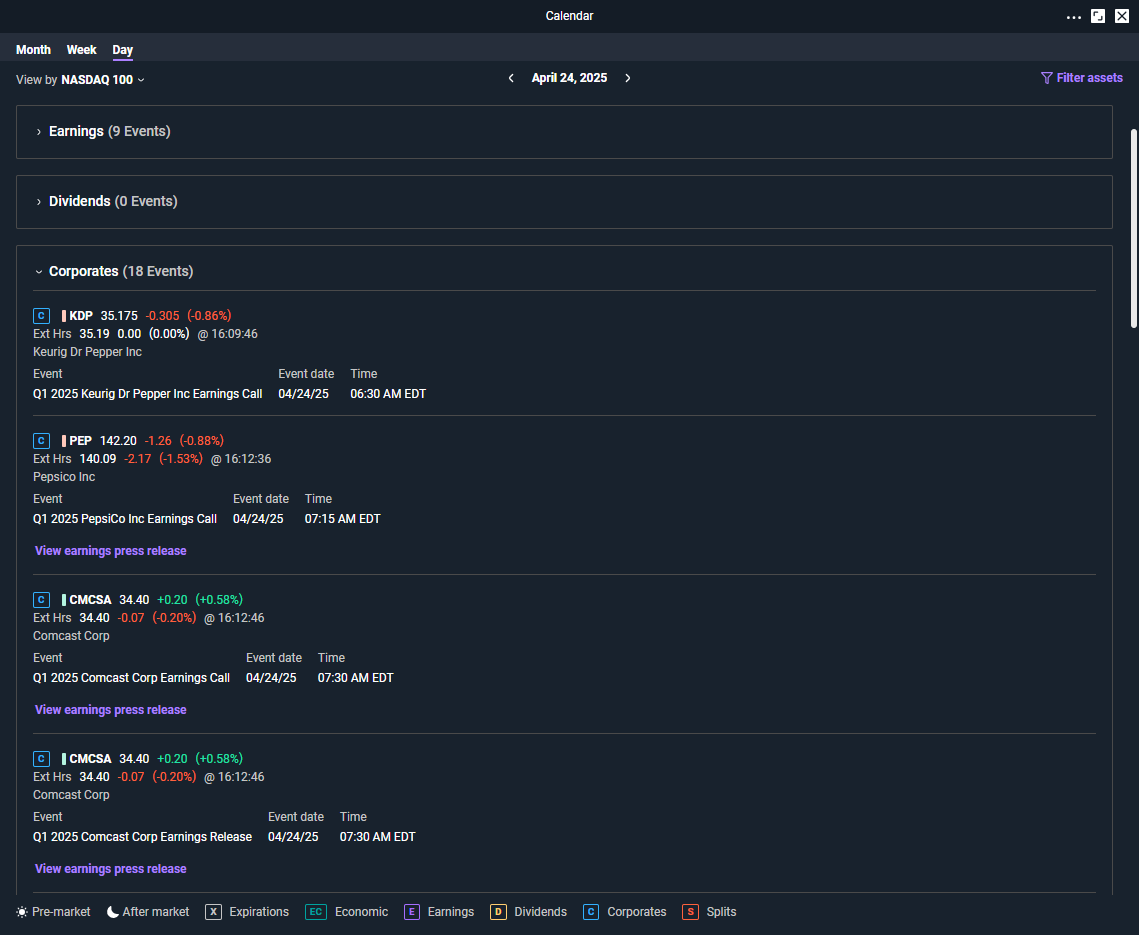
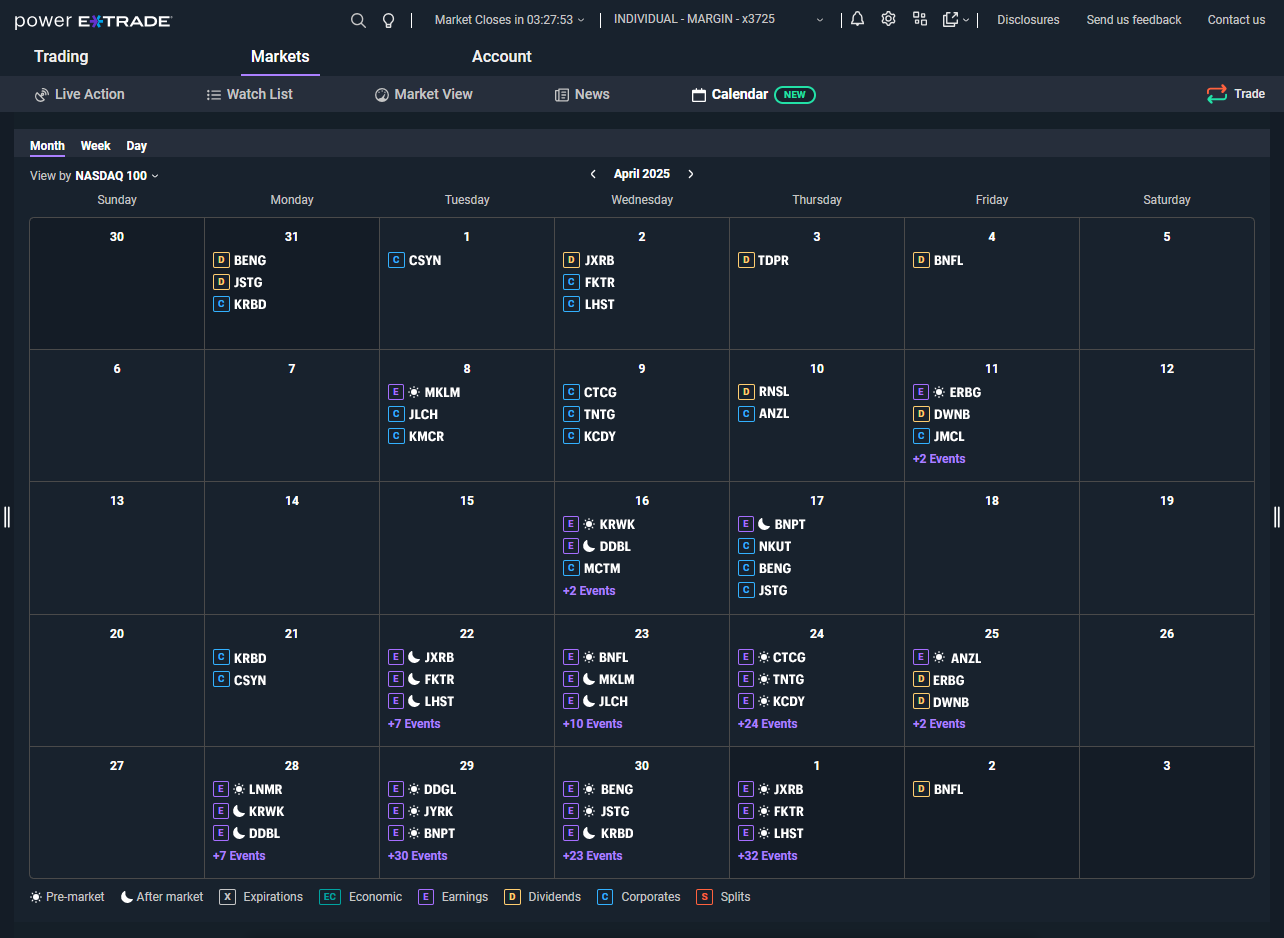
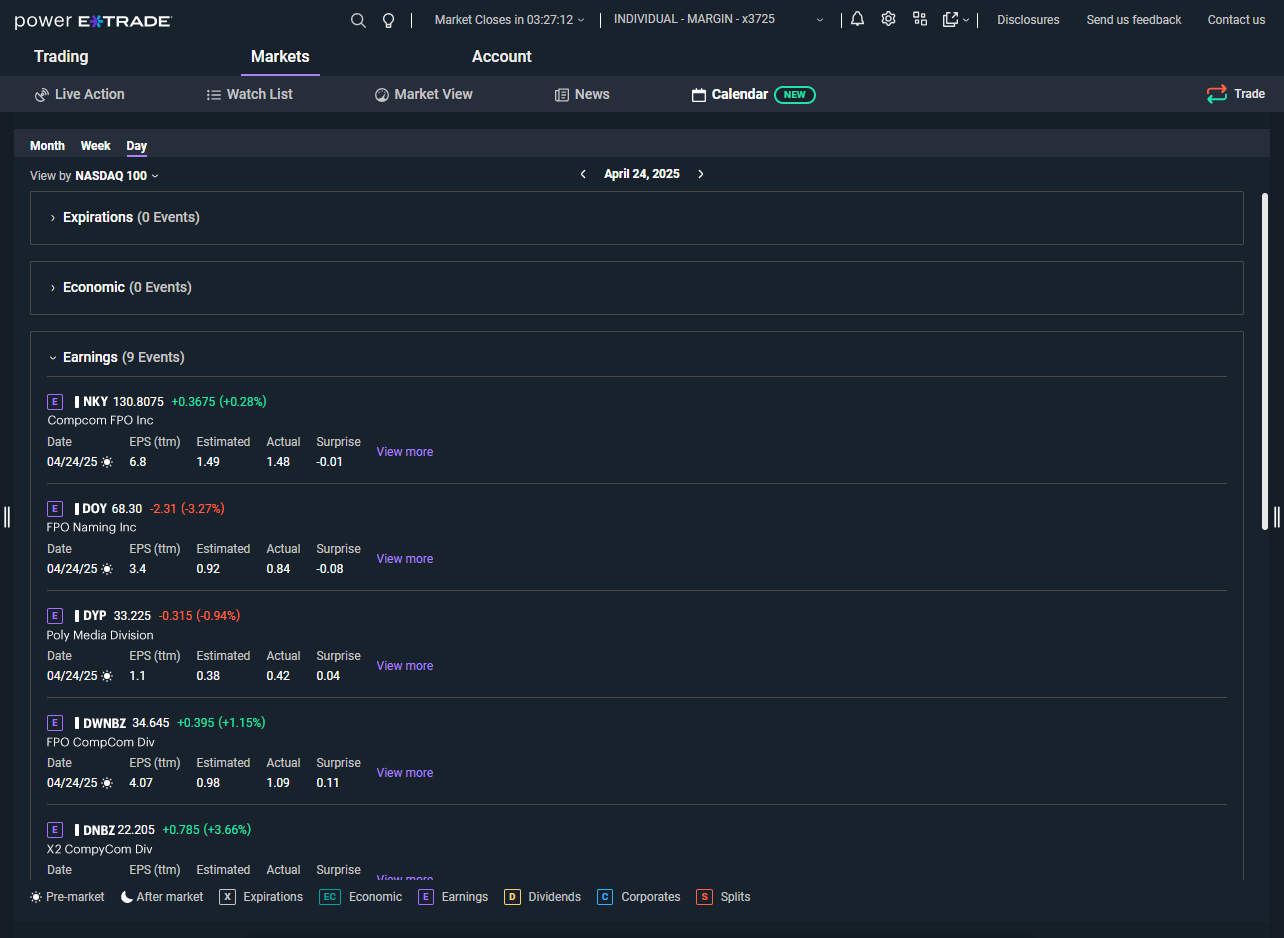
New calendar now available on Power E*TRADE Pro
The new calendar can be launched from the main Tools dropdown and gives you the ability to view a variety of events associated with publicly traded equities, as well as wide host of economic data. Events include earnings, dividends, corporate events, and splits.
For options traders, you may also opt to see expiration dates of options in your portfolio on the same market calendar.
You can customize the calendar to show the total market, specific watch lists, market views, or account specific views. This allows you to visualize events for securities you’re interested in. Additionally, you can choose to view events based on monthly, weekly or daily time frames, with the latter providing with the most granular level details.
 |
 |
Version 182
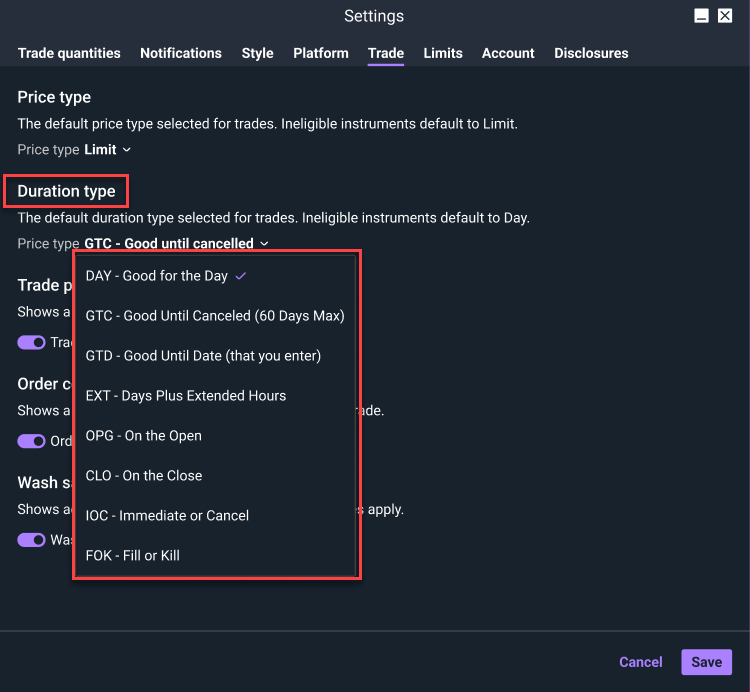
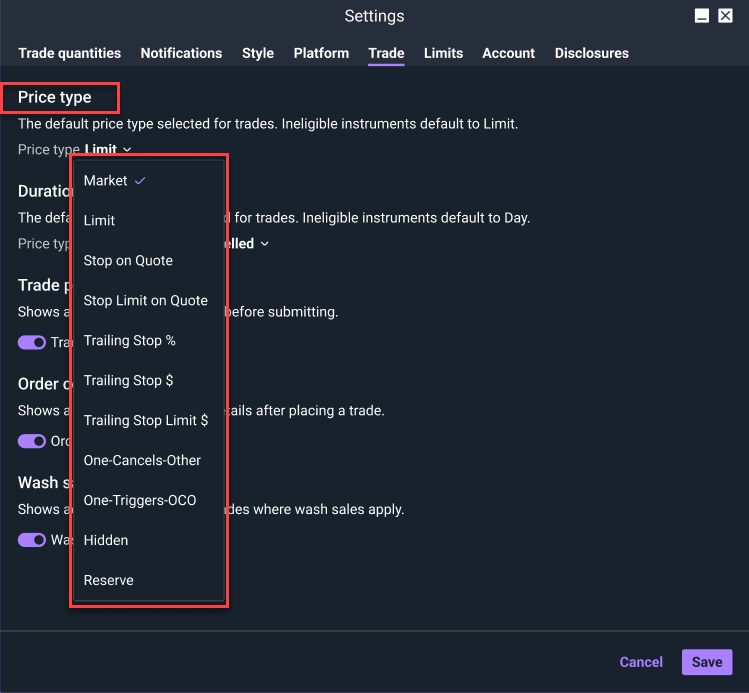
Order ticket default settings now available
Greater order ticket customization is now available. With the release of new order ticket default settings, you can now set Price and Duration types to better streamline order entry.
- Price type allows you to set the default price settings including market, limit, stop on quote, trailing stops, one cancels other (OCO), and more.
- Duration types gives you ability to set the default ticket duration settings including day, good until cancelled (GTC), immediate or kill, fill or kill, and more.
Go to Settings, select Trade in the navigation, then set your Price and Duration types.
 |
 |
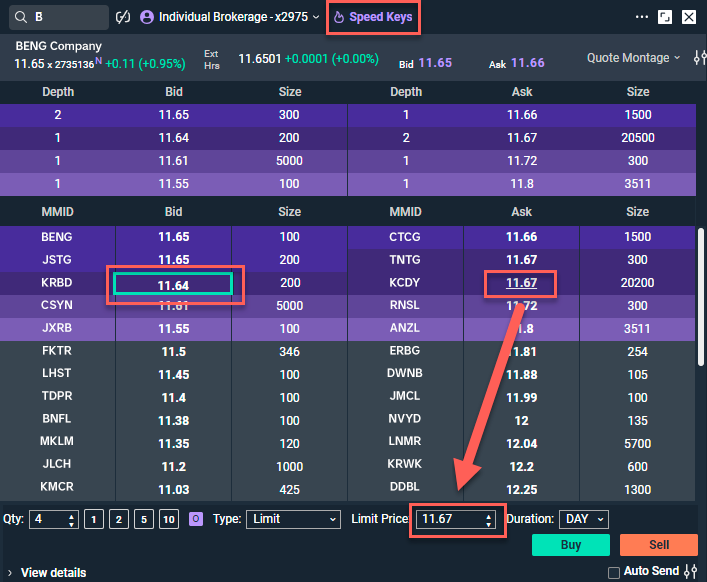
Version 181
Trade faster than ever before using Speed Keys
Speed Keys are a new trading feature that allow you to place trades from your Chart, Watch List, and Market View tools using custom keyboard shortcuts. You can turn on Speed Keys and view your saved keys in the Platform tab of the Settings menu.
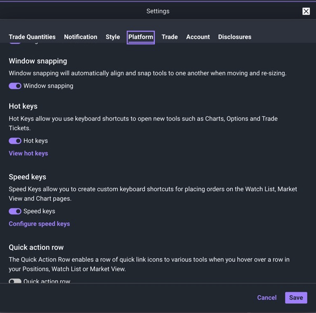
View and create your own Speed Keys by clicking “Configure speed keys” in Platform Settings, or by clicking the “Speed Keys” link anywhere across the platform.
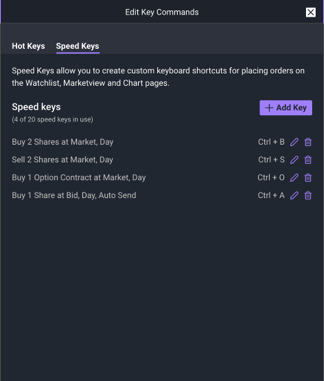
To create new Speed Keys, define a keyboard shortcut and parameters of the trade. You can also specify if you want the Speed Key to skip order preview using the Auto Send toggle.
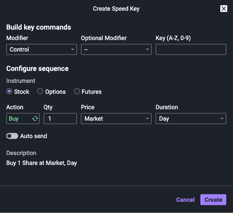
Once your Speed Key is saved, you can navigate to any Chart, Watch List, or Marketview tool and use your Speed Keys to place trades for the symbol selected in the tool.
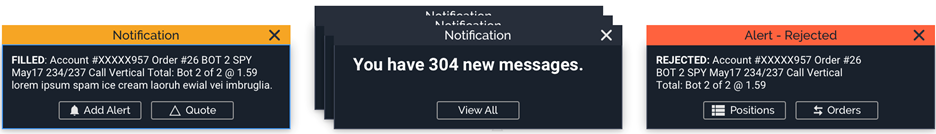
Notifications refresh on Power E*TRADE Pro
We’ve updated price and trade notification messages. These refreshed notifications now align with our general Power E*TRADE Pro design and give us full control over behavior, which will consistently align with selected notification settings.
Up to four notifications now stack vertically from the top down, with a feature which allows these to always display on top of other windows (both in-app as well as with external windows).
Additionally, new buttons have been added to the Price alerts notifications, which allow for shortcuts to the Alerts window and Trade ticket.
Version 175
Application mode now available
With the release of Application mode on Power E*TRADE Pro, you now have two modes to select from.
- Frame mode tools are contained in a single frame for cohesive window management.
- Free-form tools are independent windows that can be placed anywhere.
Application modes are accessible in the primary settings menu by clicking on the gear icon -> Platform tab -> Application mode, then choose between Frame and Free-form modes.
Frame mode
In the newly released Frame mode, the application sits on a digital canvas that can display multiple windows within one frame. The mode provides a traditional application feel, allowing for cohesive window management. You may move the application around as a singular window within a monitor or across monitors for those with multi monitor setups. Additionally, you can drag windows in and out of the frame to visualize multiple windows in one frame or some windows outside the frame.
Free-form mode
With Free-form mode, you have ultimate customization and flexibility. All windows and tools behave independently, allowing for more customized views that can include external applications and windows.
Version 172
In our latest release, we’ve rolled out the new Knowledge Center and the ability to increase or decrease your window size by zooming in and out. The Knowledge Center is a library of educational content on all things Power E*TRADE Pro. The zoom capability lets you customize the size of the content in a way that best meets your needs.
Knowledge Center
The new Knowledge Center provides access to tutorial videos on using Power E*TRADE Pro. Learn how to navigate the platform, customize your Workspaces, execute a Quick Trade, utilize Live Action scans, set up Window Linking, and more.
To launch the Knowledge Center window, click on the light bulb icon in the top right corner of the Menu bar between the Alerts and Settings gear icons.
Zoom In/Out
Our zoom capability has been designed to allow you to increase or decrease the size of content within windows without creating the need to reassemble your workspace.
Apply platform-level zoom (in or out) by holding the Control key and pressing + or –
- Zoom in: Ctrl +
- Zoom out: Ctrl -
- Reset zoom level: Ctrl 0
| Max zoom in: | Max zoom out: |
 |
 |
For illustrative purposes. Not a recommendation.
Version 167
We’ve redesigned our data tables and added customization options to windows based on your feedback. The changes make Watch Lists, Positions, Live Action scan results, and overall data sets fit your needs.
Data table enhancements
Data tables can sometimes be cumbersome to analyze, which is why we’ve given you the ability to reduce the spacing between rows and to add gridlines.
- Compact tables – reduced spacing between rows for broader data views
- Table grid lines – visible grid lines help separate rows and columns within data tables
| Before: | After: |
 |
 |
Window customization
Customization of window navigation bars allows you to better organize your Positions, Watch Lists, and Market View windows.
The feature is controlled on the window level. To add or adjust, simply click on a Positions, Watch Lists, or Market View settings icon, and select “Change Window Color.”
Version 162
Send Symbol To
Send Symbol To is here! This feature allows you to send a symbol to all linked windows with the click of a mouse. To activate this tool, click on the link icon to the right of Send To in the top left corner of your Positions, Watch List, or Market View tools, select the desired link, then left click on a symbol row. This action will highlight the row, indicating the tool is engaged in Send To mode, and any left click or up/down arrow movement will update all linked windows with the highlighted symbol.
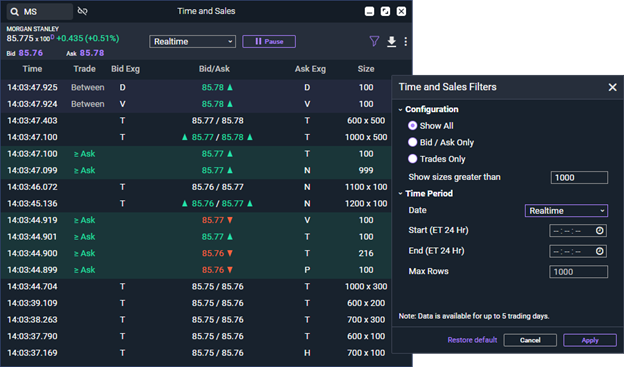
Time and Sales
Monitor real-time and historical bids, asks and trades of stocks and options in a neatly packed, intuitive tool. Use the Time and Sales tool to view real-time trade data as the day unfolds, or comb through historical data for up to 5 trading days down to the millisecond. Refine search results and hone-in on market action with a large host of filters and row highlight capabilities.
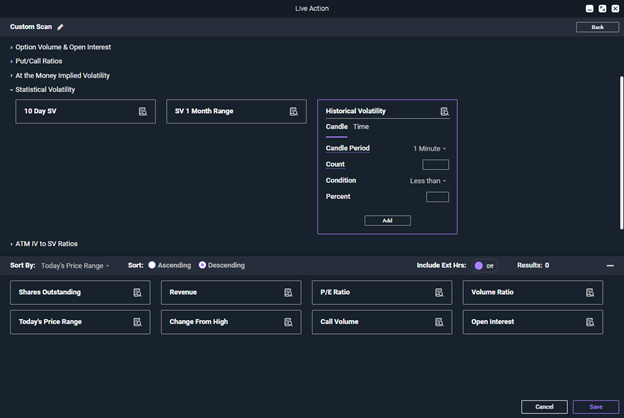
Live Action Custom Scanner
A new and improved scanning experience is now available in our Live Action tool. In addition to the various available pre-defined scans, a vast array of criteria have been integrated allowing you to build your own scans. Package as many (or as few) of these criteria into a single scan, save, and run!
Use the Create Custom Scan button in the upper right corner of the Live Action tool to start building your scans. Once done building, you can access your saved custom scans via the My Scans tab located at the top of the Live Action tool.
Version 200
Positions Widget
You will now maintain your column sorting preferences across sessions within the Positions widget. Once you set a preferred sorting order, this preference will be saved and automatically applied in your next session, providing consistency and saving time.
Live Action
Live Action scans will now persist across sessions. This enhancement ensures that any scans performed using Live Action will be retained, allowing you to continue your work seamlessly without needing to re-initiate scans in subsequent sessions.
Market Depth
Upon tool launch and when switching symbols within the tool, the quantity populated in the order ticket now follows your global quantity setting (instead of defaulting to 1).
Charts
Chart responsiveness has been enhanced to more effectively display data across custom window sizes and layouts.
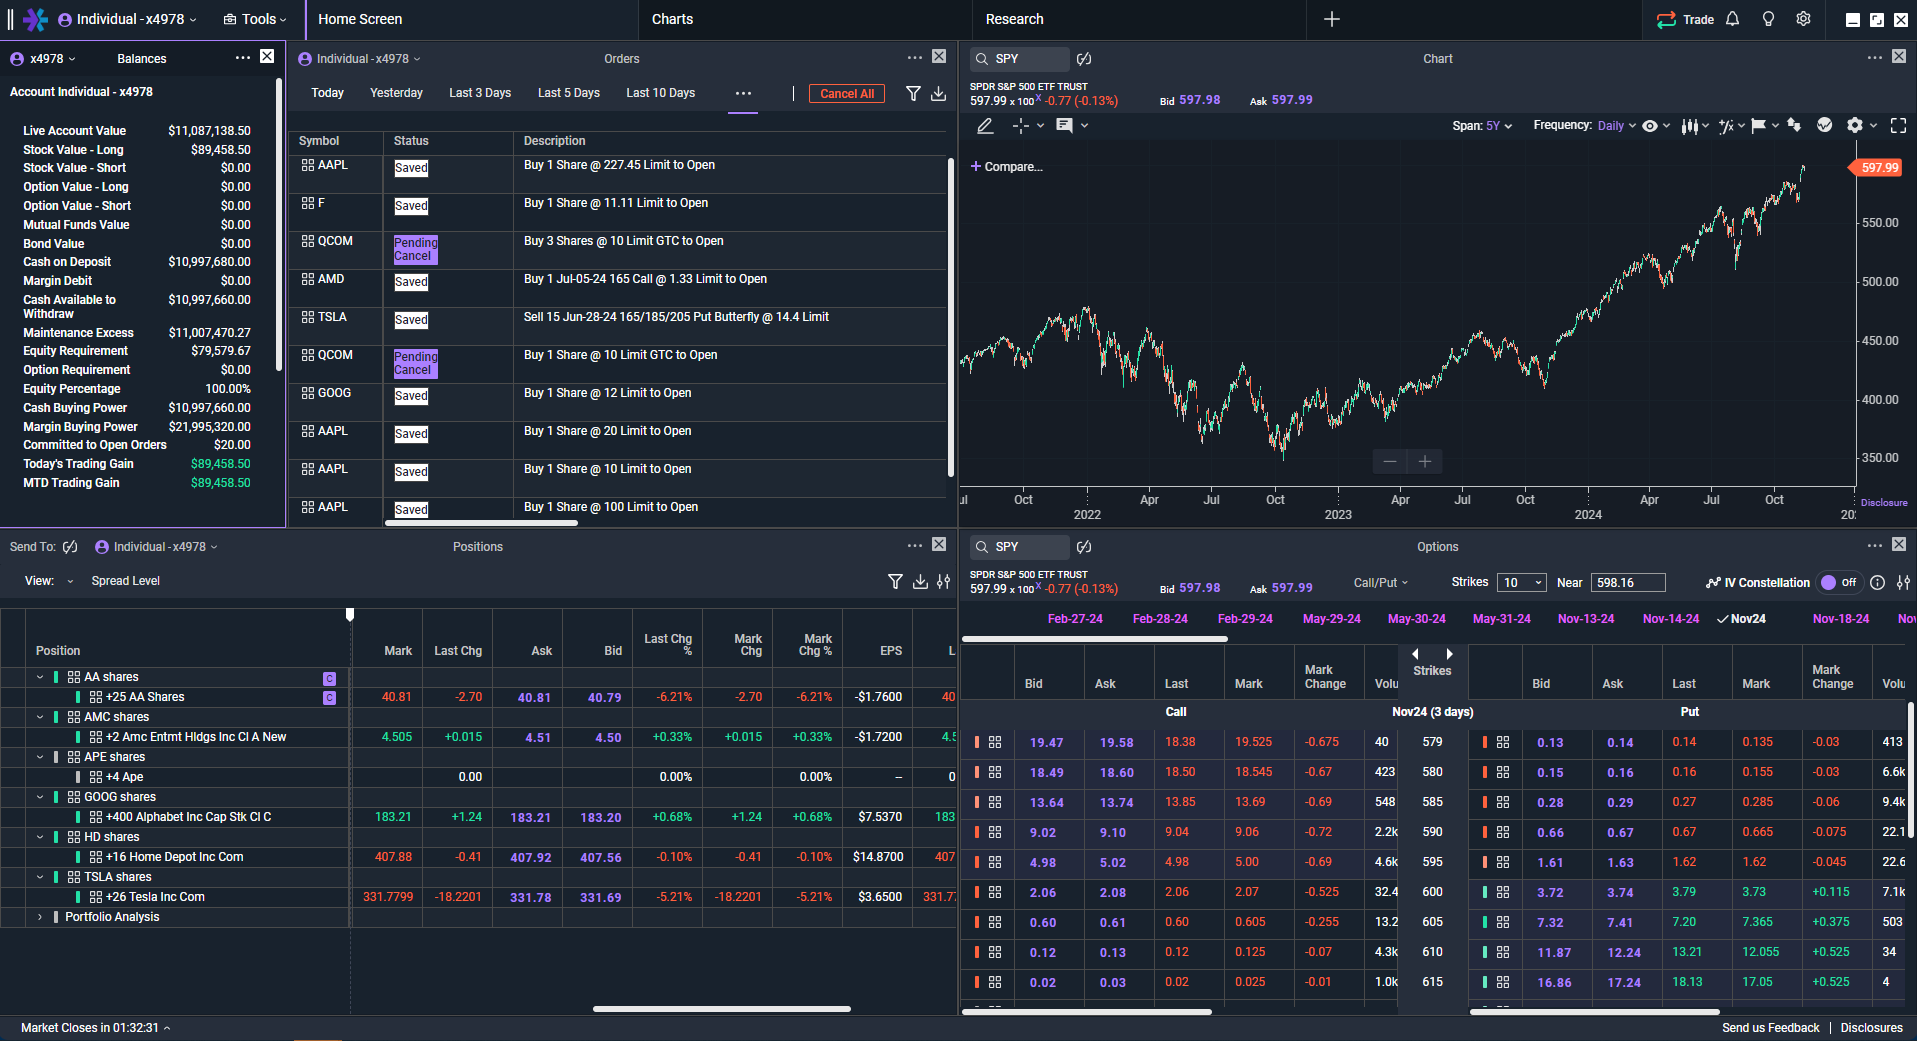
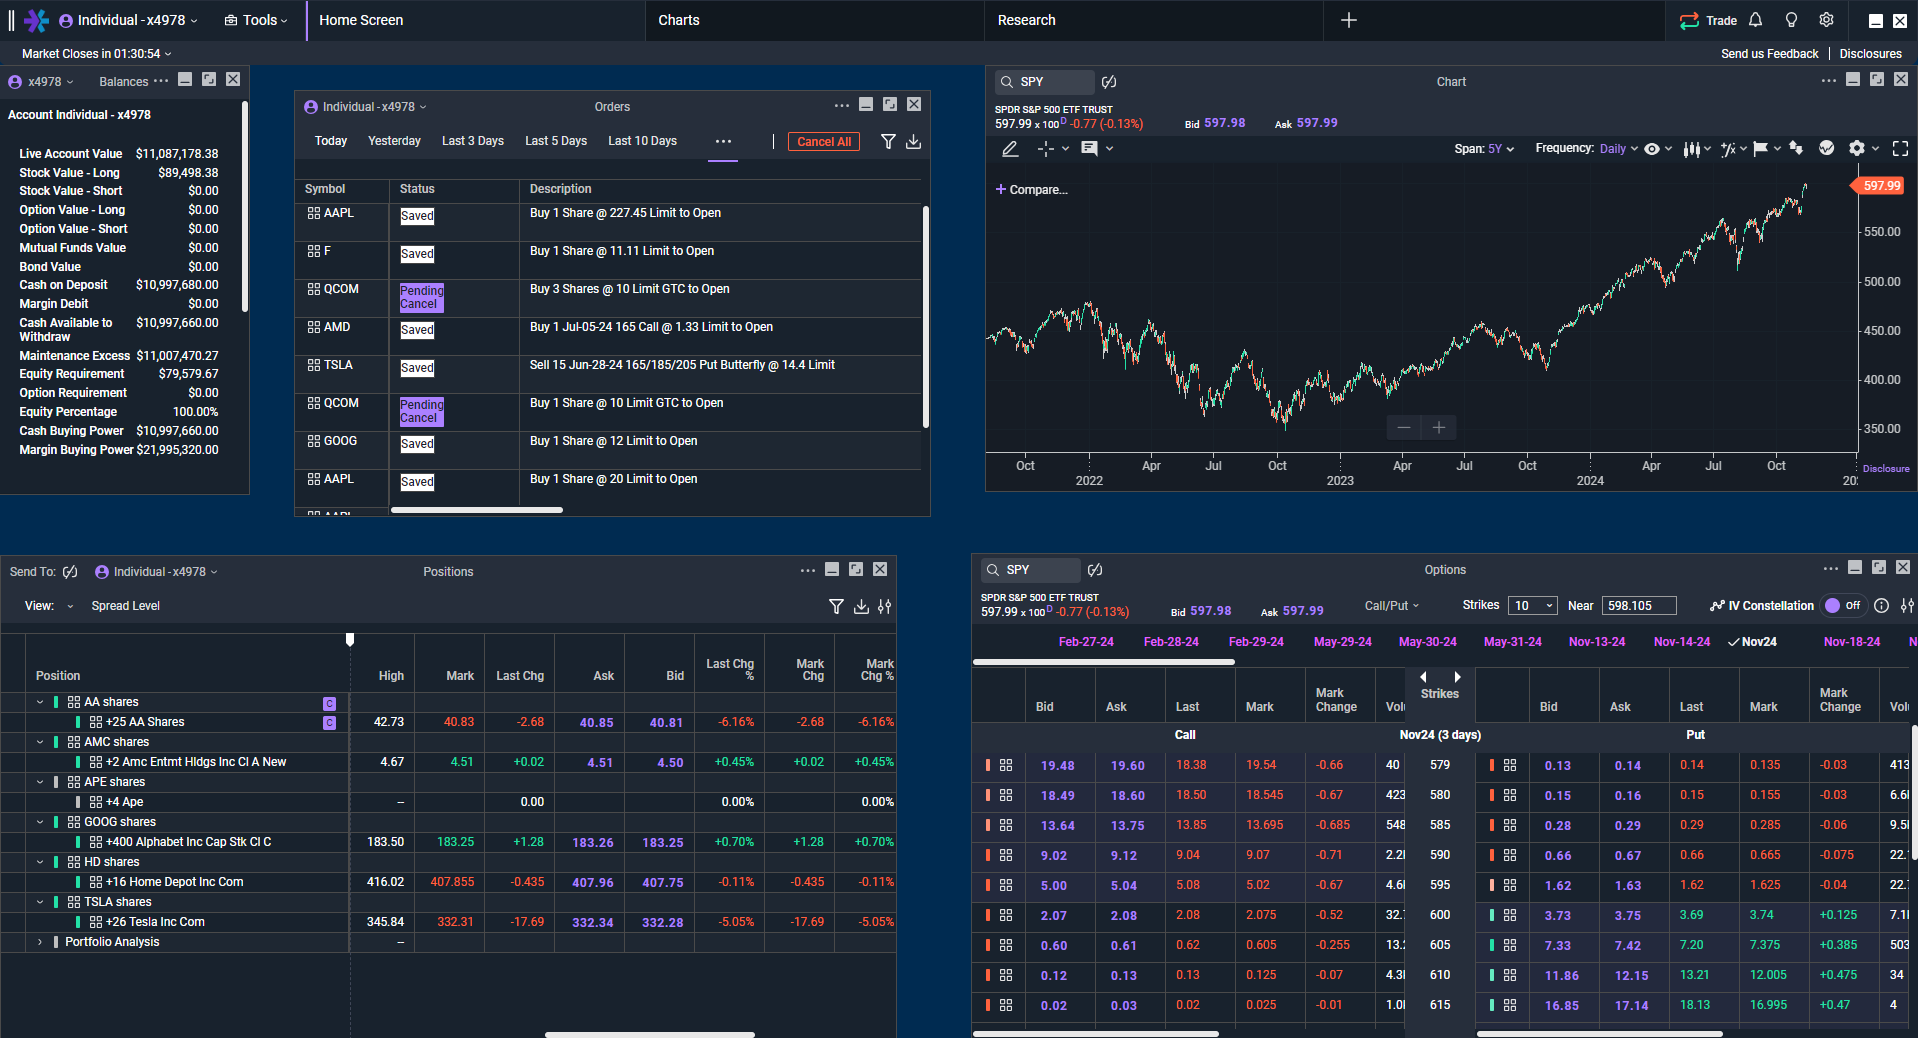
Version 202
Dynamic Sorting – Watch List and Market View
Dynamic Sorting is now available as an optional setting for the Watch List and Market View tools. When enabled, your tables will automatically re-sort at regular intervals based on your selected sort criteria—so the information you care about stays at the top as prices and market data change. This makes your Watch List and Market View easier to scan and helps you spot updates faster.

News Enhancements
The News tool has been enhanced with a refreshed look and improved usability. In addition to visual updates, it now supports symbol linking for quicker navigation to relevant securities. You can also filter news by selecting a specific watchlist or account, making it easier to view headlines tailored to the lists you follow.
For illustration only. News is not up-to-date or a recommendation.
Futures Trading
Futures order tickets now load more quickly and efficiently. This will result in reduced waiting time when opening and interacting with the futures ticket, supporting a smoother order-entry experience.
Charts
Multiple chart enhancements have been made focusing on performance and speed. This will provide faster chart rendering and more responsive interactions.
We have also resolved a chart issue affecting candlestick data for customers in certain time zones.
Previous releases
Version 201
Charts – Volume Study
We have fixed an issue where the volume study was not streaming accurately during extended hours sessions.
Version 200
Positions Widget
You will now maintain your column sorting preferences across sessions within the Positions widget. Once you set a preferred sorting order, this preference will be saved and automatically applied in your next session, providing consistency and saving time.
Live Action
Live Action scans will now persist across sessions. This enhancement ensures that any scans performed using Live Action will be retained, allowing you to continue your work seamlessly without needing to re-initiate scans in subsequent sessions.
Market Depth
Upon tool launch and when switching symbols within the tool, the quantity populated in the order ticket now follows your global quantity setting (instead of defaulting to 1).
Charts
Chart responsiveness has been enhanced to more effectively display data across custom window sizes and layouts.
Version 199
Ticker Tape
Our new Ticker Tape allows six of the most popular symbols to remain visible at all times when the feature is enabled, providing persistent market awareness.
Version 198
Orders Tool Improvements
You can now configure settings and customize visible columns within the Orders tool. This enables a more tailored view of order details based on individual workflows and preferences.
Today’s Realized Gain Field
A new Today’s Realized Gain field to both the Balances tool and the Account widget has been added. This update provides clearer visibility into realized P&L activity for the day, helping you quickly assess performance alongside your existing balance figures.
New Data Table Columns
% of Portfolio
Adds visibility into how each position’s value relates to the overall account value, making it easier to understand portfolio concentration at a glance.
U/L Change %
This column will display the % change of the underlying security, helping you quickly gauge underlying-driven movement without leaving the Positions tool.
Chart Zoom Control
A new setting allows you to turn on/off the on-chart zoom controls to better match your preferred chart interaction experience.
Version 196
Chart Enhancements
Themes: Customize your trading charts with our new Chart Themes feature. You can now personalize color patterns to suit your preferences, enhancing visual clarity and making data interpretation more intuitive.
Previous Close Line: We've added a horizontal line on charts to indicate the security's closing price from the previous trading day. This feature provides a quick reference point for analyzing market trends and making informed trading decisions.
Version 195
Market Depth Enhancements: We’ve expanded the available order types in the Market Depth order ticket to include stop on quote and stop limit on quote orders, providing you with more strategic options to manage your trades effectively.
Expanded PnL Metrics: Dive deeper into your investments with our enhanced Lot level view. Now, you can see the profit/loss amount for individual lots, giving you a clearer picture of your portfolio's performance and making it easier to optimize your tax plan.
Persistent Order Book Filters: Enjoy a seamless trading experience with order book filters that now persist across sessions, saving you time and effort in setting up your preferred views.
Enhanced Notes Experience: We’ve improved the experience for adding notes to data tables, making it easier for you to annotate and organize your insights.
Industry Column Addition: Gain more insights with the new Industry column added to both Market View and Watch List, helping you to better categorize and analyze your list of securities.
Version 194
Extended hours profit/loss streaming
You can now include extended hours changes in your Portfolio by enabling Extended Hours Profit/Loss Streaming in Platform Settings. By enabling this feature, your balances and PnLs across the platform will update around the clock for securities which trade outside of normal market hours.
Chart enhancements
We have upgraded our charts library with several improvements to chart performance and stability. While you may not notice a change on the interface, this sets the stage for further enhancements down the line.
Version 192
Market depth enhancements
We’re thrilled to announce several new features to our Market depth tool, designed to help enhance your trading experience. Enhancements include:
- Open order display: Identify the price of your open orders, now highlighted within the depth table.
- Quick price entry: Left click on a price in the depth table to automatically fill the limit price field in the order ticket.
- Order ticket persistence: Your market depth order ticket settings will now be saved across sessions, preserving your preferred configurations.
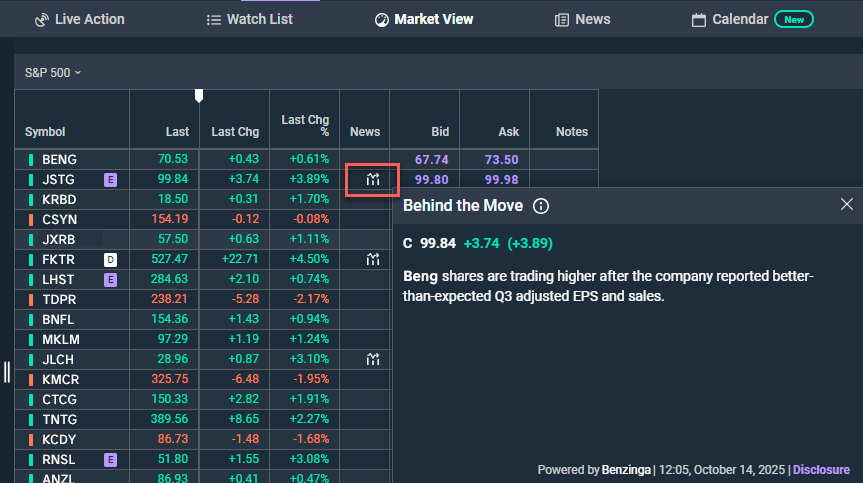
News column on Positions, Watch list & Market View
Stay informed with the new column for News on our Positions and Watch list pages. If a stock experiences significant movement, the Behind the move chip will appear, providing insights into the reasons behind the change.
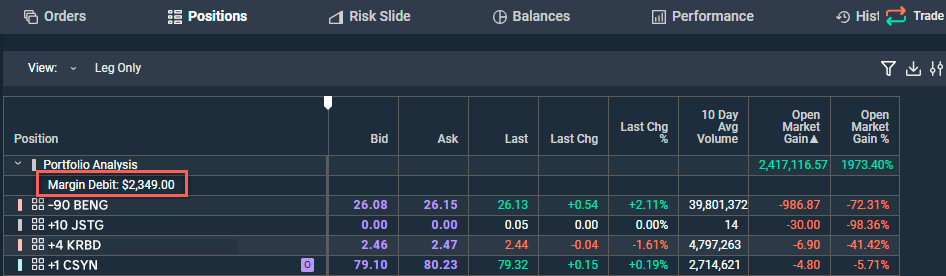
Margin debt on Positions
Now monitor your margin debit balance details directly from the Positions page. Details will be displayed in the Portfolio analysis section for easy access.
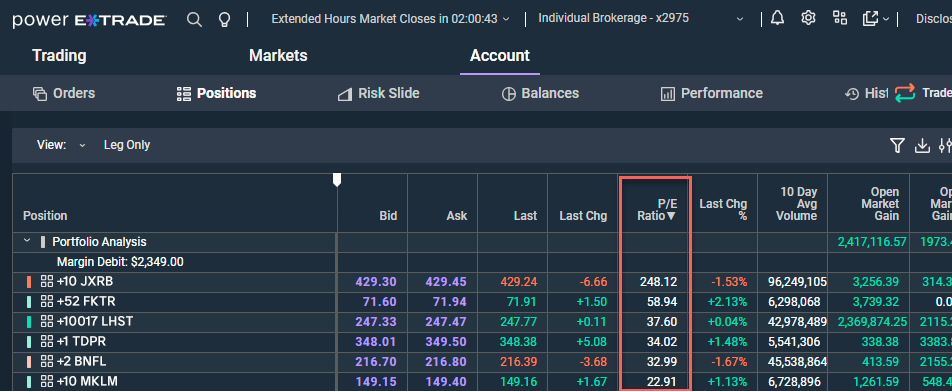
P/E columns additions
View P/E numbers for multiple securities in one convenient location. The new P/E column is now available on our Positions, Watch list, and Market view pages. Add it by selecting the slider icon and choosing “Select Columns.”
Version 191
Market Depth enhancements
We have introduced two enhancements to the Market Depth tool on Power E*TRADE, designed to help provide you with greater efficiency in your trading.
Customizable trade quantities
You can now customize the quick quantity boxes within the Market Depth order ticket, giving you a way to efficiently and quickly place trades.
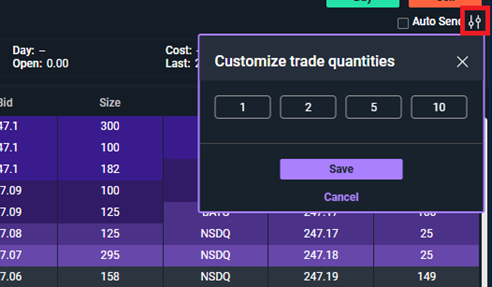
You can also increase the max number of instances of the Market Depth tool from 5 to 8.
Version 190
Orders tool enhancements
We’ve updated our Orders tool row height to align with spacing found in other tools within the platform, like Positions or Watch lists. This means information in the Orders window will appear more compact, allowing you to see more information without having to adjust the tool size.
Additionally, the quick action menu has been added to Orders. When you left click on a row, a window will appear that includes a list of actions that can be used to manage your order.
Market Depth update
We’ve updated the Trade Ticker feed in our Market Depth tool to now reflect extended hours trade data. This will help you stay informed of trades pre and post market, in addition to regular market hours.
Charts timeframe addition
We’ve added a new 1-day timeframe to the already robust library of choices. The new addition allows you to quickly see the past 24 hours of trading activity on a chart with the 1D timeframe shortcut.
Positions filters persist
Filters added to the Positions page, are locked into place across sessions. This allows you to configure the information you’d like to see within the Positions window. The filter will stay in place until you close the window or update them.
Version 189
Trade Warnings Setting
The Trade Warnings setting allows you control whether you see soft trade warnings during the order placement process. Soft warnings provide additional information on your order, dealing in topics such as buying power, existing orders, security restrictions, use of unsettled funds, and wash sales.When a soft warning is triggered, an order will be prompted to the preview stage even when Trade preview is turned off.
Toggling this setting off will prevent non-essential soft warnings from being displayed, preventing the preview stage if auto send is enabled.
To navigate to the Trade Warnings setting, launch the Settings menu by clicking the gear icon in the top right corner of the platform. Within Settings, select the Trade tab and scroll down to Trade Warnings.
Version 185
Tax lots on Power E*TRADE web
Now you can view tax related information along side your positions and make more informed trading decisions fast. The information will be viewable when a position is made up of multiple lots and will include details like cost basis, acquisition date, and taxable profit/loss.
To view tax lots, simply select Lot Level as your view type in the Position page View dropdown.
Choose specific lots you’d like to trade by checking the corresponding box on the Positions page or in the order ticket from the Lot Selector. This allows you to close a position, harvest losses, and/or preserve long term gains and positions directly in the Power E*TRADE platform.
Please note that Morgan Stanley and its affiliates do not provide tax advice, and you always should consult your own tax advisor regarding your personal circumstances before taking any action that may have tax consequences.
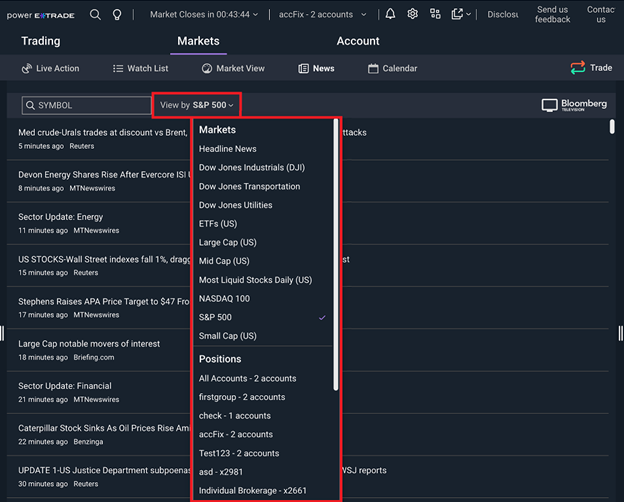
Enhanced calendar on Power E*TRADE web
The new calendar can be viewed from the Markets tab and gives you the ability to view a variety of events associated with publicly traded equities, as well as wide host of economic data. Events include earnings, dividends, corporate events, and splits.
For options traders, you may also opt to see expiration dates of options in your portfolio on the same market calendar.
You can customize the calendar to show the total market, specific watch lists, market views, or account specific views. This allows you to visualize events for securities you’re interested in. Additionally, you can choose to view events based on monthly, weekly or daily time frames, with the latter providing with the most granular level details.
 |
 |
Version 167
We’ve redesigned our data tables and added customization options to windows based on your feedback. The changes make Watch Lists, Positions, Live Action scan results, and overall data sets fit your needs.
Data table enhancements
Data tables can sometimes be cumbersome to analyze, which is why we’ve given you the ability to reduce the spacing between rows and to add gridlines.
- Compact tables – reduced spacing between rows for broader data views
- Table grid lines – visible grid lines help separate rows and columns within data tables
The new features are available across Power E*TRADE platforms and can be enabled by simply going to Settings -> Style.
| Before: | After: |
 |
 |
Version 87
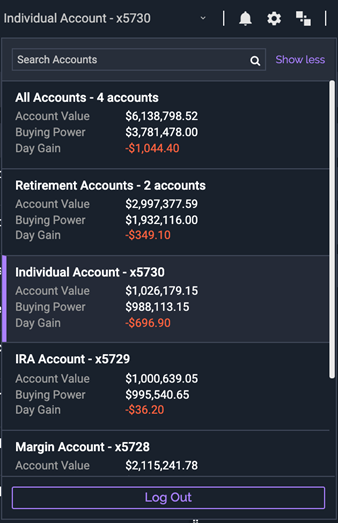
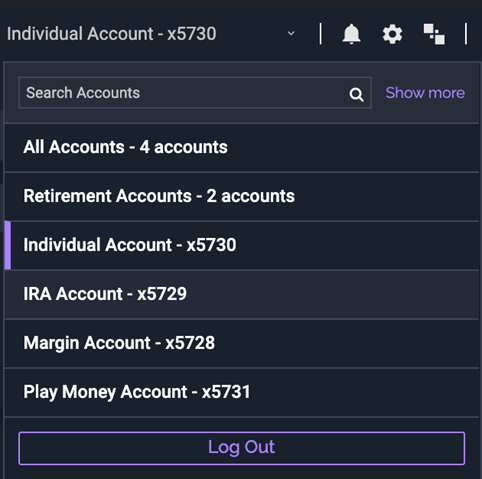
Here at E*TRADE, we think every account and account type is special! However, we’ve noticed that it can be a bit confusing moving between accounts within and between our platforms. We’ve considered many possible solutions to help stem the confusion that can sometimes result when customers switch between accounts on our platforms; we even considered letting you give your accounts human names … but any of us from big families remember the ensuing chaos created by our parents shouting out every child’s name in rapid succession, so we didn’t think that was a winning solution. So, instead, we decided to make an enhancement that would let you see pertinent details on each account, including Account Value, Buying Power, and Daily Gain, in the account dropdown without having to switch between accounts at all.
 |
 |
Version 84
It’s 2020, and though we don’t have the jet packs that numerous sci-fi books and films promised, we do have a constant connection to breaking news anywhere and anytime. In a 24/7 media cycle, however, it can be challenging to keep up with everything vying for our attention. That’s why we’ve decided to give you the power to filter news stories by symbols or watchlists in the News widget to hone in on exactly which key happenings are relevant to you and your portfolio!
In addition to wanting to give you only the most pertinent news articles and allow you to explore the news by symbol, we’ve also decided to be a bit more discerning with when and where we display the “in-the-money” or ITM chip on open options positions. In particular, we’ve decided to stop displaying the ITM chip for non-standard or adjusted options series where ITM status may be determined by the price of the underlier plus an additional cash component—or based on a non-standard multiplier of more or less than the typical 100-share multiplier—both of which may cause the ITM chip to be inaccurately or incorrectly displayed alongside an adjusted option position.
Version 83
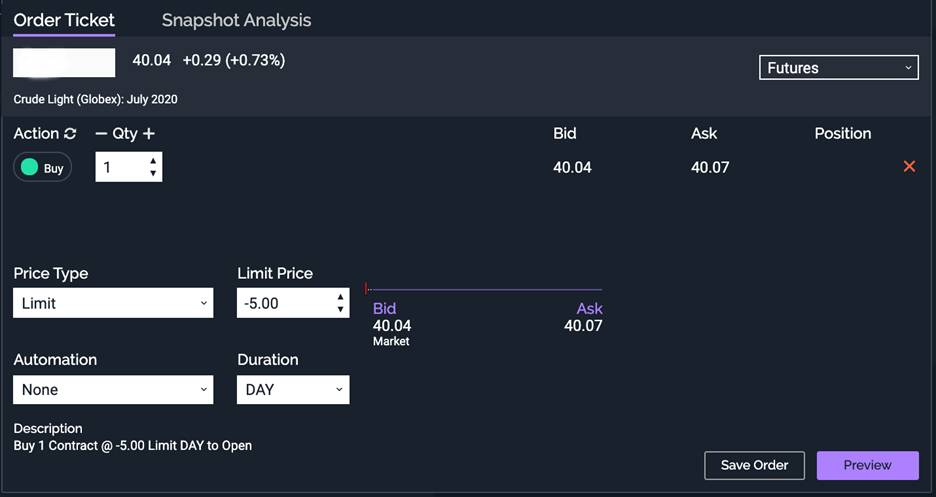
In a move we’d like to consider a big POSITIVE, we now allow negative price limits to be entered on commodities futures order tickets. You can enter negative prices within the order ticket by simply adding a “-” sign before your limit price or by using the arrow keys in the Limit Price field of the order ticket to incrementally reach prices below $0. This is just one change we’ve made to support your trading in these unprecedented times. We’ve also made it possible for you to see the negative fill price where applicable, including on order screens, confirmations, cost basis fields, and other relevant places on the Power E*TRADE platform.
We want you to be able to see the information that interests and aids you the most in your trading and investment decision making. While we continue to add and support more and more column views in Power E*TRADE, we understand that our customers have different preferences and needs regarding data and that more is not necessarily better for everyone all the time. To that end, we’ve enhanced our display options to allow you to customize your data displays including the ability to add or remove data columns from key areas of the platform. Rome’s columns weren’t built in a day—and neither were ours. We look forward to bringing you more columns of valuable information in the near future! Stay tuned!
For those who are new to Power E*TRADE, we’ve added some default columns to get you started. You can, of course, always change your data columns to display whichever columns you rely on to help inform your critical decisions and seize opportunities in the market.
Version 82
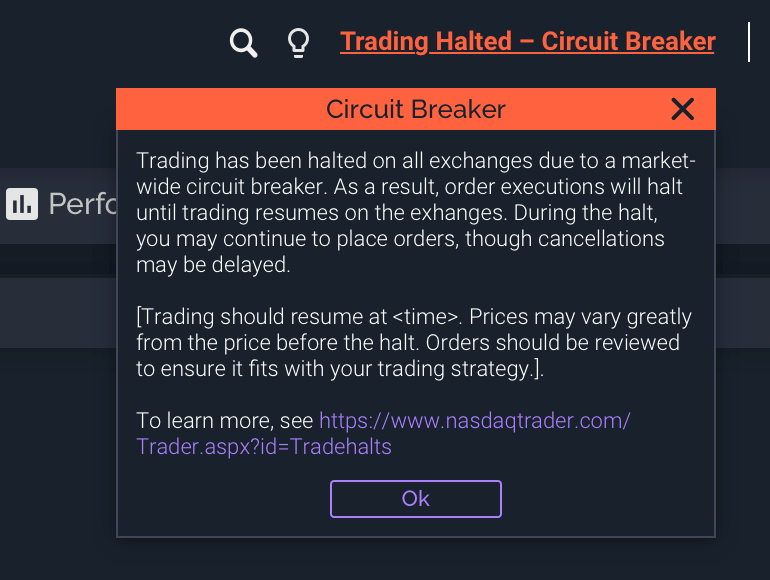
We’ve added some useful features to more readily surface the info you need, when and where you need it. This release includes various messaging enhancements, including an updated trading halt message that will appear underneath the market countdown clock. As always, we will continue to allow orders to be placed during trading halts; however, no orders can be executed during a halt, including anytime you see our halt message.
We’ve enhanced our Risk Slide tool to allow customers to more easily view and distinguish real and simulated positions while sorting data and analyzing potential risk within the tool. You’ll notice now that real and simulated positions will remain separated within the Risk Slide tool even after sorting and resorting positions according to different data fields or within columns.
In addition to making it easier for you to sort and distinguish real and simulated positions within the Risk Slide, we’ve also given Risk Slide a bit of a facelift, and it’s never looked better. We made changes to clarify what the data on the Risk Slide means, including by displaying Actual Percentage and Actual + Simulation P/L in place of Actual and Actual + Simulated Percentage. Actual + Simulation Percentage, which was previously displayed on charts within Risk Slide, was renamed Percentage Move and moved from charts to a data point below Actual & Actual + Simulation P/L above the charts pane.
Version 81
We aren’t dentists, but this release was all about fills and fixes!
We originally created our widget functionality to provide you with glanceable market and portfolio insights without disturbing your core workflows, especially during market hours. In order to help you keep up with your portfolio and positions, we’ve now included the fill price in the string of information you’ll find on each security within your Order widget.
Extending that same thinking, we’ve added functionality to show fill prices within the Order modal. As you click into your positions from the Order widget, the modal appears to show you even more details about the security or position of your choice.
As for fixes, we have made necessary adjustments to ensure you can see the fourth row of text on Actionable Toast notifications in the platform. Unfortunately, our engineers can’t fix your burnt breakfast toast, though—you will have to field that one yourselves.
Version 80
The much-awaited theme of this release would have to be “column work”. And while the theme may conjure thoughts of ancient Rome, we assure you that we have not changed our data displays to provide quotes in Roman numerals … at least not in this release!
We have, however, added an “earnings per share” (EPS) column that can be added to your customizable dashboard display—a highly useful piece of information for any trader, new or advanced.
Additionally, the Notes function, a favorite feature of our well-researched and well-read community of traders, has been enhanced to allow you to more seamlessly access your Notes without disrupting the trading experience or slowing you down. We now show you the full contents of your note when you mouse over the Notes column on your Positions page, Watchlists, Market View, and your widgets.
As for our fixes this release, we have made enhancements to ensure that Selected Dates populated through use of our Date Selector are maintained across functions when navigating within the platform. We also took care of one small bug pertaining to the Up/Down arrows in our order ticket fields to ensure they were functioning properly.
Version 79
You’ll notice we’ve been doing some rearranging with this particular release. A few things may be moved around, so please don’t trip over something on your way through the platform!
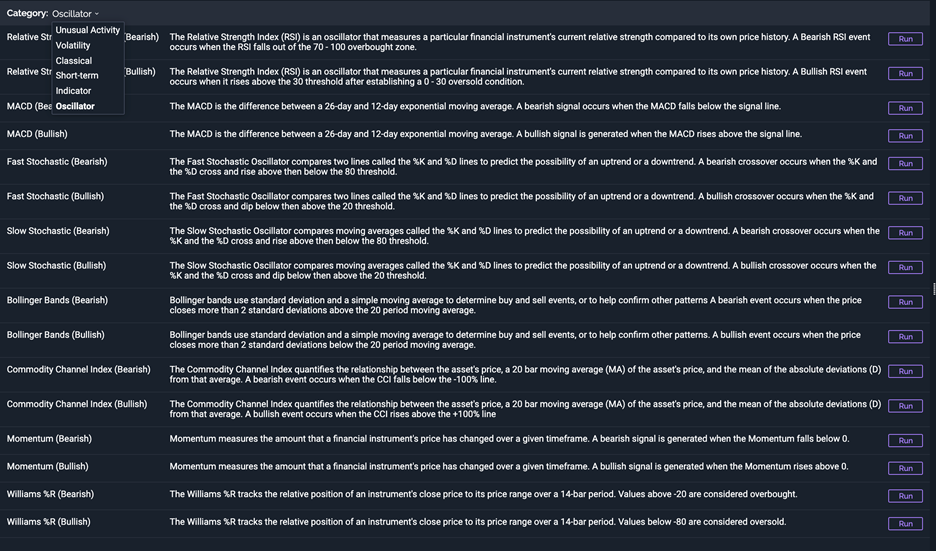
Several enhancements have been made to Power E*TRADE to promote ease of use. We have added several new pre-defined watchlists so you can monitor the futures markets quickly and easily, and we are pleased to announce that we’ve integrated 22 new Indicator and Oscillator Scans into LiveAction. The “Technical” category has also been removed and replaced with three new categories, including Classical.
We had received reports that our comparison charts weren’t streaming and that our application was crashing when clients selected group accounts; both of these issues are now fixed.
Version 78
This release was all about toast notifications, a lovely piece of functionality named for the way they POP UP like hot toast fresh from your toaster.
Before now, toast notifications were informational only and could not be used for actionable items. We are happy to share that we have made an enhancement to include buttons on each toast notification to allow you to navigate to relevant places in our platform based on the notification type and to interact with the notice in a more constructive manner.
We have also made enhancements to extend the Chart Tear Out functionality to Microsoft Edge browser users! If you are an Edge user, or if you are U2’s The Edge, we hope you’ll enjoy using our Chart Tear Out functionality—which allows infinite charts subject to you crashing your Microsoft Edge browser session by having too many windows open at one time to accommodate all of your charts.
A few key remedies to some issues are also worth mentioning. We have fixed any issues with users not being able to add options positions to Watch Lists. We also made fixes to our charts to ensure that our 10-Year daily charts are up-to-date and align with the current day. We did this through feats of software engineering, not time travel—but we are always prepared to warp if needed to ensure a reliable and well-functioning offering for our valued clients. We also noticed the Action menu wasn’t displaying in our Tear Outs, but you should see it now based on our fix!
Version 77
Our team is preparing to create a number of onboarding, educational, and platform tutorial offerings for our user base. These helpful materials can be found under the new lightbulb icon displayed at the top of the Power E*TRADE platform, regardless of how you’ve customized your dashboard.
Please be sure to check this menu often for new functionality walk-throughs and guides to help you get up and running on the platform. Though we can’t show you how to tie a Windsor knot whenever you need it, we can show you some fresh guides on how to use Power E*TRADE effectively!
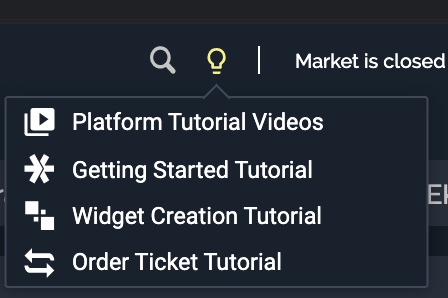
In addition to the lightbulb icon, we’ve added some useful items for new and existing users in the form of Funding and Trading buttons on the Positions page. We know it can be a bit overwhelming to get started on our platform as a new user, so we made it easier by putting quick links to fund your account or begin placing trades from what will be a fresh, empty Positions page for a new user.
After providing so many valuable new pieces of functionality for our new users, we also ensured we took care of a few issues for existing users with some recent bug fixes. We remedied an issue related to lagging data on the Option Chain, as well as some issues we saw with the widgets not being able to scroll cleanly and properly.
Version 76
If you’re anything like us, you have a favorite theme and color scheme within the Power E*TRADE platform. Over here, the team that works on the platform is a little divided on which theme looks best. We are not so divided that we have after-office dance battles a la the Sharks versus Jets in West Side Story—but if it ever comes to that, we will be sure to film it.
No matter which theme you prefer for your trading, we have given you a handy New Theme selector, which appears upon signing on and loading our platform for the first time. This way, you can live preview and select a theme that works well for your preferences.
In addition to this new thematic change, we’ve fixed some key issues that had been popping up with respect to Position page columns displaying and aligning properly and another issue with the zoom functionality on full-screen charts. We also tackled an issue in which futures options symbol inputs led to crashes. All are resolved now!
Version 75
This release has seen us with our heads in the clouds—the Ichimoku Clouds, that is. We’ve released some key bug fixes and also introduced some functionality that is anything but “a total wash.”
We are pleased to announce we’ve added a Wash Sale toggle button to our platform that allows you to choose between displaying wash sale-adjusted data and unadjusted wash sale data on your Positions page.
Regarding bug fixes, we’ve ensured that chart frequency and range changes on charts do not cause intermittent or periodic freezing anymore. We also resolved a bug causing exception errors to be displayed with views of Ichimoku Clouds when users changed futures symbols. Both are now resolved!
Version 74
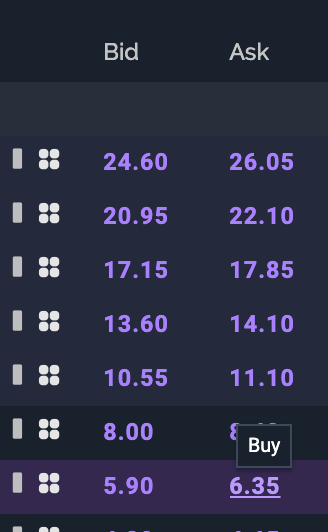
In this release, we made several changes to the platform aimed at enhancing the user experience and promoting ease of use. We are particularly excited about two new enhancements to the platform: a mouseover tooltip definition on Bid/Ask that will reflect “Buy” and “Sell” where applicable, and another whereby you can now see the last four digits of each of your accessible accounts so that you can navigate clearly between your accounts without confusion if you hold multiple accounts at E*TRADE. We feel this will be especially helpful on account dropdowns so that you don’t accidentally dip into the children’s college fund when you meant to invest your fun money in riskier short-term investments. We would hate to see your children matriculating at “Clown College” rather than Princeton due to any unforeseen losses, so we have made it a priority to add more account distinction
In addition to these enhancements, we have made a few bug fixes. Namely, we ensured that the order ticket is now loading properly from the Watch List. We also made certain that any sorting delays you may have been seeing on the Positions page will not bother you any longer.
Version 73
We are pleased to say that, much like St. Nick, we have been making our own lists during this pre-holiday season. Our lists don’t contain the names of any naughty or nice children, but instead we created a Futures Market View predefined lists set. We’ve organized these new data points alphabetically for ease of use and hope you’ll explore them and find them useful.
We haven’t given you a lump of coal in your stocking, but we will be putting a Dividend Amount on the Chip, so that you can see the information at a glance.
We have also added our own version of tinsel to the platform, in the form of improving the Positions Tooltip UX so that the tooltip information is not in the way of your positions details as you mouse over them. We have ALSO made a lovely renovation to the Ladder Bid/Ask colors for our Dark Theme to ensure the colors and styles are consistent across the platform and pleasing to the eye.
In addition to sprucing things up for the holidays, we’ve fixed a few bugs in this release. We fixed the existing issues with the Risk Slide Expiration Chip and fixed the partial fill icon within the widgets, which was previously missing.
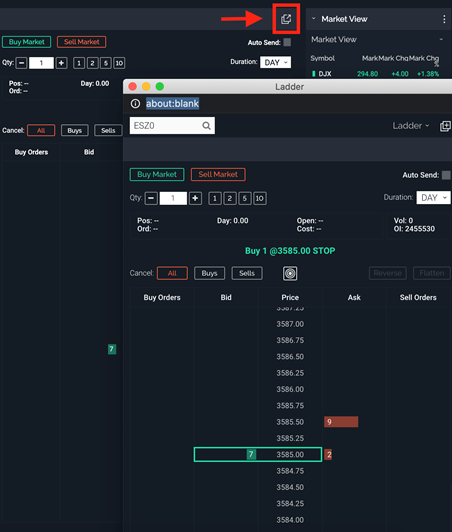
Version 71
The theme of this release is expanding your display and platform configuration choices, and we have a few exciting things to point out in particular! For starters, we have given you the power to tear out the trading Ladder to view the Ladder and other aspects of the platform simultaneously. We’ve also created some expanded full-screen chart functionality. That’s right, we are taking trading charts to the big screen!
On a lighter note (pun intended), we have launched the Light Theme color scheme in Paper Trading for those who wanted a lighter and airier color scheme as the backdrop for their trading platform and workflows.
We are also pleased to report that Technical Analysis is now available on micro futures charts, allowing you to review micro futures data and piece through patterns and analysis to a finer degree for these products.
Though there were many stars in this release, we have a few special guest stars in the form of some bug fixes. We ensured that incorrect price formatting was no longer impacting any futures data displays and remedied the zoom issue within the Snapshot Analysis Risk Graph.
Version 70
It’s nearly Halloween, and we have lots of treats and positively NO TRICKS for you this release.
We are happy to report that we have added a 10-day average volume column for your perusal—so understanding a 10-day volume figure will no longer be like bobbing for apples!
We also fixed formatting on the Bid/Ask size for OTC symbols. We hope this doesn’t give you a fright but instead helps you understand OTC markets and interacting with them a bit better.
We also chased some ghosts out of the woodwork, meaning we fixed some key bugs. First up, we fixed a stop order functionality bug on our Ladder. We also noticed a Saved Orders bug, which caused the platform to crash when Saved Orders were sent to the market. Thankfully, we didn’t need to call in the Ghostbusters this round, as we have our own crew of bug hunters! Happy Halloween!
Version 69
The devil is really in the details over here at E*TRADE, and we are pleased to issue a release that is chock full of enhancements to aid your trading and investment analysis
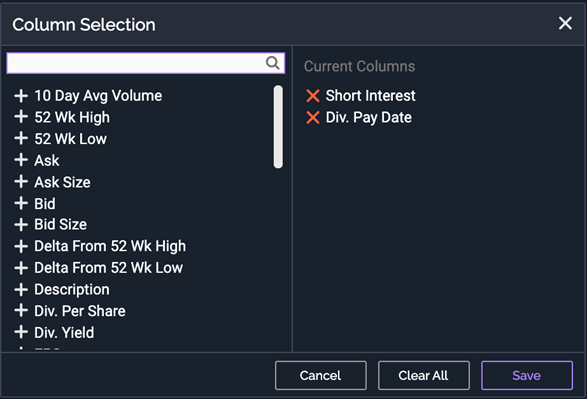
We have added a few new useful columns to the platform, including the Short Interest column and the Dividend Pay Date column.
We completed a few bug fixes as well, as we were seeing some minor issues with our Quick Action Row and are pleased to have resolved this one. We also remedied an issue in which equity and futures positions were not updating after the close. Lastly, we saw that the Confirm window was flashing and causing the platform to crash upon futures order fills. We’ve fixed both the flash and the crash and have the platform back in great working order!
Version 68
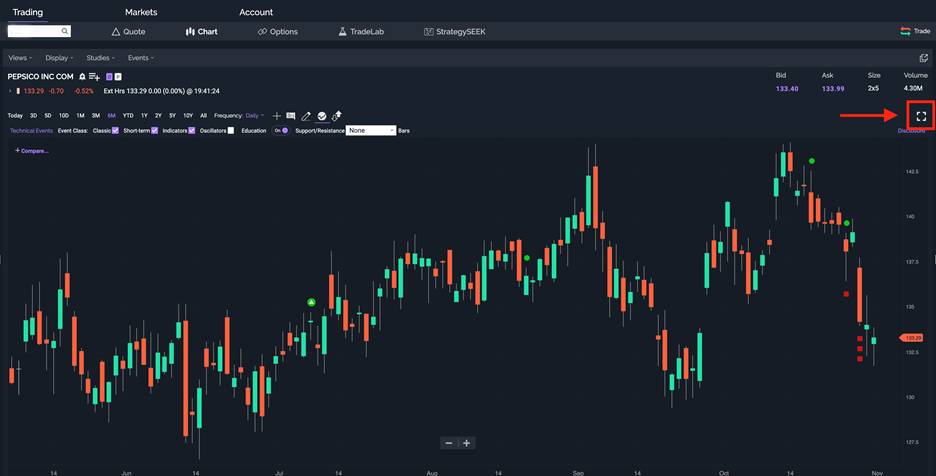
This was one momentous release for us! We are excited to announce we now offer full-screen charts so you can dig into the details with an expanded view and explore data and patterns with greater ease. We see our charts as the sails of our great ship, and, with the ability to go full-screen, we can now extend our sails to navigate deeper waters ... of data that is.
We have also worked out some bug issues, including those that were troubling clients while using our symbol search functionality. We also noticed that Custom Grouping was not being displayed when initially loading our platform, and that the symbol box was cut off on WL/MV. All of these issues are now fully resolved.
Version 67
As the weather cools, we’ve turned our attention to our order book—not just because it’s a favorite read with a warm drink by the fire for us, but because it’s a piece of functionality near and dear to all of our clients. Around here, we think that looking over our order ledger is certainly good reading! A tale of our journey through the markets, complete with twists and turns in price and volume.
This fall we are pleased to announce we’ve given the platform a few necessary revisions. We’ve given attention to the order book and added some necessary filtering enhancements, which you can explore and use to sift through and filter your order book as you like.
We’ve also added an IV Rank Column to WL/MV and even managed to fix a few bugs with the column widths. We have also fixed any sorting issues on the Positions page that had been popping up.
Version 66
The theme of this release was to provide some positive and user-friendly new tweaks in the general platform conventions. You could say we sent the platform to etiquette school so that it would be better behaved. In doing so, we changed up how the clickable areas of the platform—such as the Settings menu organization—operate, ensuring it is intuitive and easy to navigate. We prioritize having a well-mannered Settings menu that listens to your changes and makes the platform operate on its best behavior for you.
We also made changes to Technical Analysis on Charting to make it more informative, a much-needed tweak to that area. After some minor bug fixes, we feel that platform is now a bit more refined and has had its My Fair Lady-esque transformation. We fixed the Market column in our order book for spreads, remedying a small bug in its display. We also made many vital strategy detail fixes within the StrategySEEK suite.
We hope all looks well-groomed and operational for your daily usage!
Version 65
This release was all about ensuring our eye for design stayed sharp! We spruced up some areas of the platform to keep current and visually appealing in addition to offering the most powerful trading tools and functionality possible. We are excited to announce we’ve added a slick new modification to our Custom Widget Mode, which now includes a sleek animation to call attention to your entrance or exit from this mode. We also re-designed our Near field in the Option Chain to be more user-friendly, crisp, and clear.
In addition to these new design enhancements, we found time to fix a few bugs while we were at it! We remedied a minimum tick increment issue on our order ticket and fixed an issue with the display snap quote data on the delayed quote version of the platform. Neither will bother you anymore, and we hope you enjoy the new sleeker design sensibilities and animations we’ve implemented in this release.
Version 64
This version features two tools which we’ve already grown to love and hope you will as well.
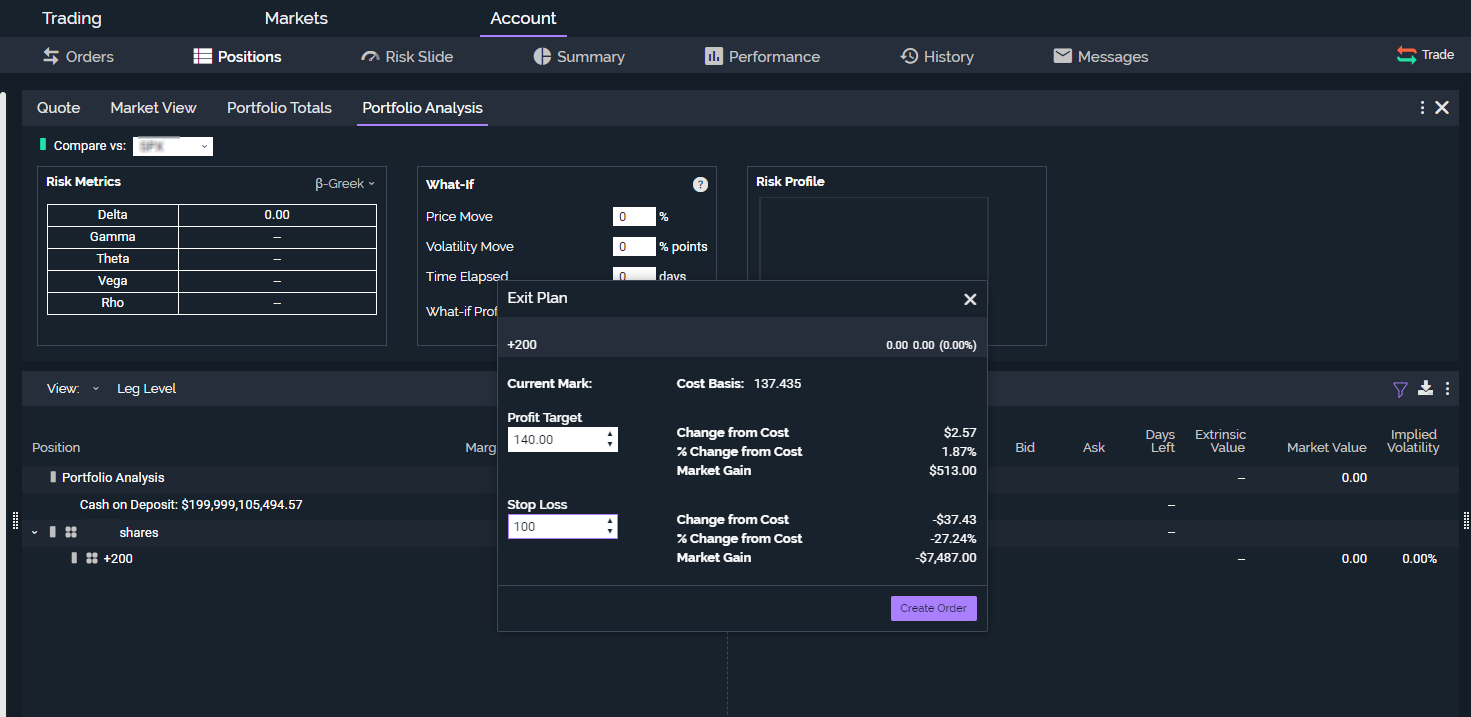
Exit Plan
- Easily create an exit strategy for open positions to help reduce future downside risk and/or lock in potential market gains.
- Just click on an existing position, select “Exit Plan,” enter your profit target and stop loss amount, and adjust as necessary.
- If the stock hits one of your price targets, your position will automatically be exited and the other order will be canceled.
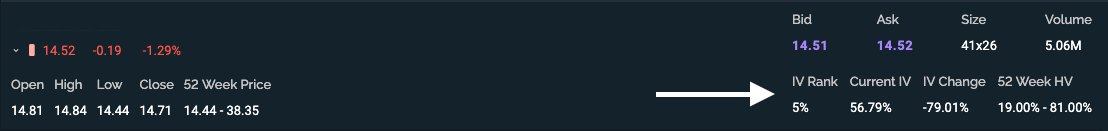
IV rank on the Quote bar and Positions tab
- This number gives an idea of the relative level of volatility for a security. It’ll show up on the universal Quote bar on the Trading tab. You can also add it as a column on the Positions tab.
Version 63
We want to be up front with you.
Don’t worry, this isn’t a break-up text. We actually think things are going great between us. So great that we want to make sure you have everything you need to trade effectively. With that in mind, this release focuses primarily on dishing up information exactly where you’re looking for it.
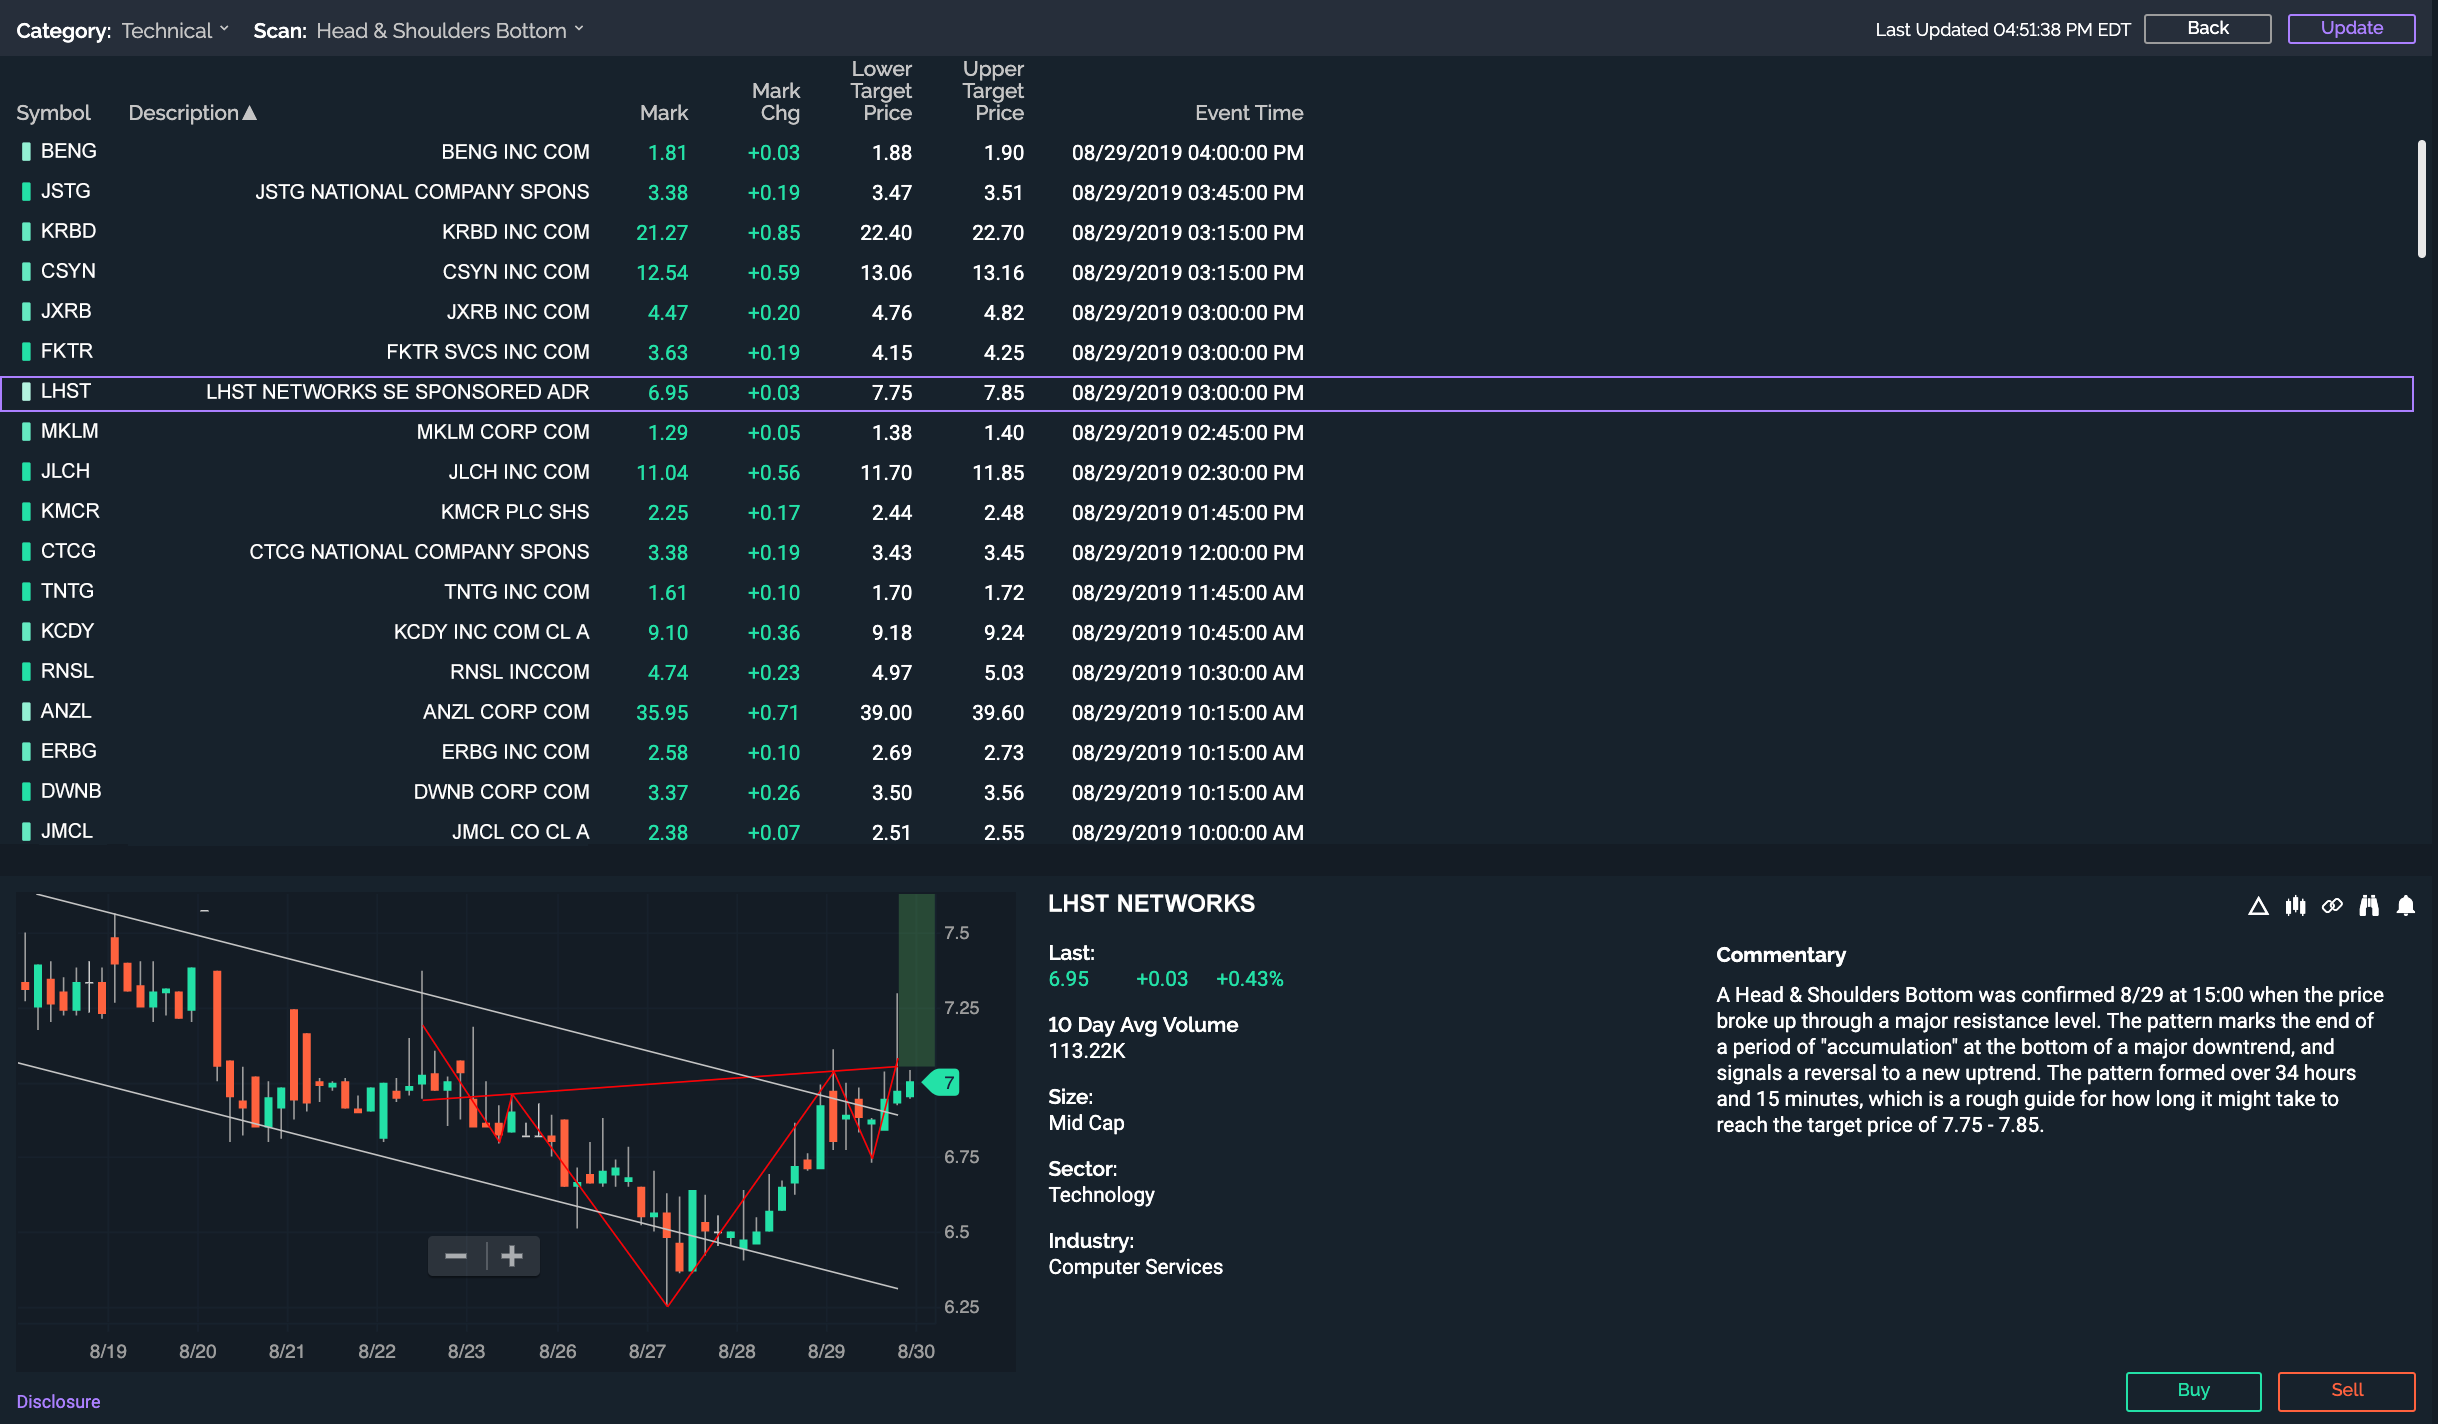
Live Action detail panel enhancements
- The Live Action page is now a one-stop shop for traders looking to scan the market for events and opportunities.
- View the Live Action detail panel directly beneath your scan results.
- This new panel provides valuable company information, and technical scans will be accompanied by charts and event-specific commentary to describe the patterns.
Version 60
Dark navy color scheme
We’ve enhanced the Power E*TRADE interface to deliver a cleaner look! The dark navy theme makes it easier for you to navigate the platform. Check out the new design below.
More data columns
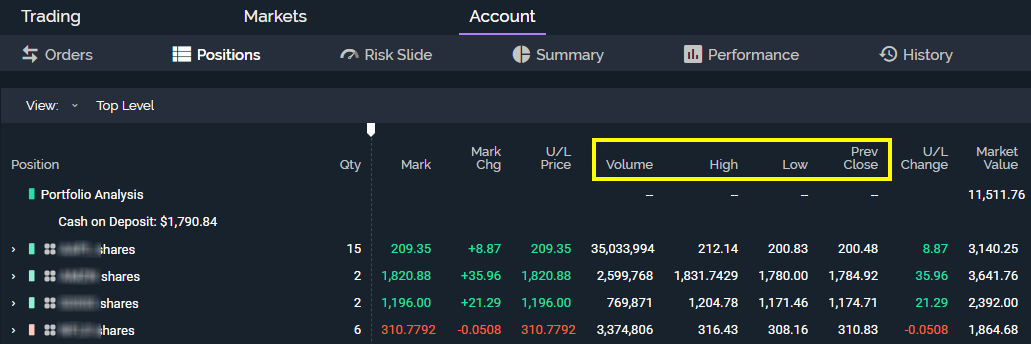
We’ve incorporated columns from E*TRADE Pro into Power E*TRADE so our platforms align seamlessly allowing you to get better scope of your portfolio. Remember, you can customize your columns on the Positions tab.
- Navigate to the Positions tab
- Tap the three dots icon in the upper right-hand side and click “Select Columns
- Add Volume, High, Low, and Previous Close to view on your Positions tab
Version 55
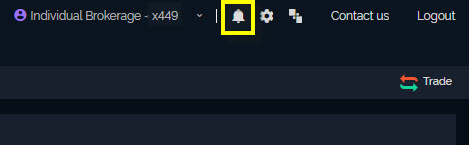
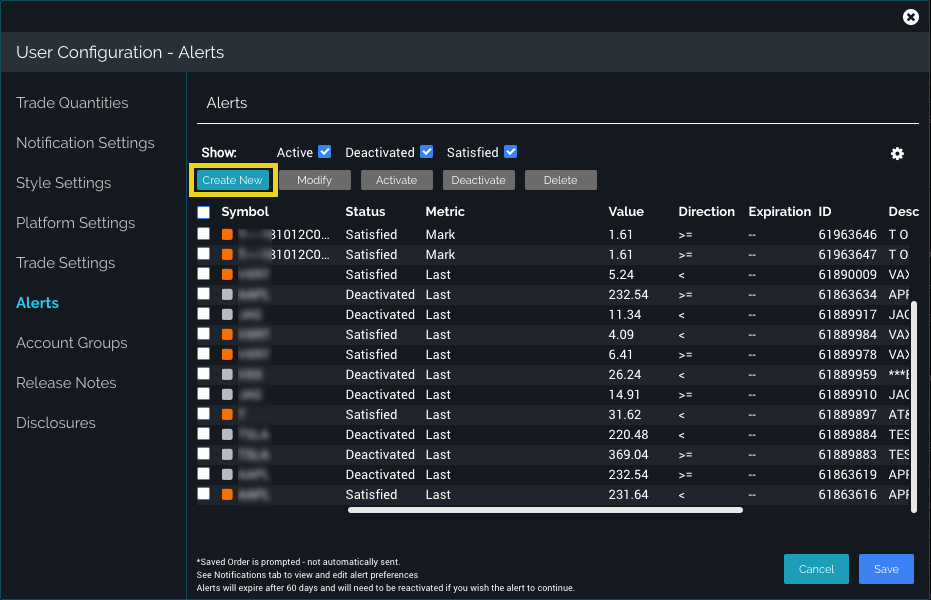
Alert Manager
The Alert Manager has been the destination for you to maintain a close eye on your potential trades. The upgraded Alert Manager now streamlines your experience for quicker, more specific alert-setting. Alerts can be as simple as flagging a stock’s price movement or as complex as building a multiple-leg option strategy alert. Craft your strategy in the Alert Manager and you’ll be in better position to act on your trades.
- Click the Bell in the top-right of the page to access Alert Manager
- Quick alerts: Enter a ticker and specify the requirements for your alert
- Click Activate to add the alert – then the tracking begins
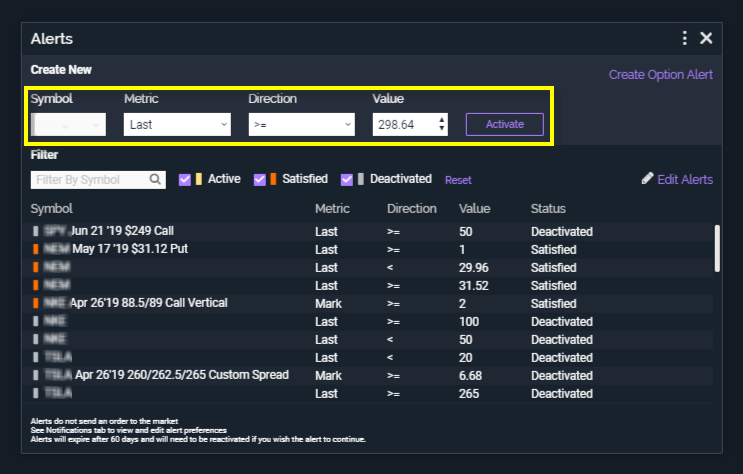
- From here you can click on Preview to review your trade and press Send to send the order to the street.
- If you want more detail prior to previewing the order, just click the plus sign to maximize the order ticket.
- Choose your filters to better sort your alerts by equity or status
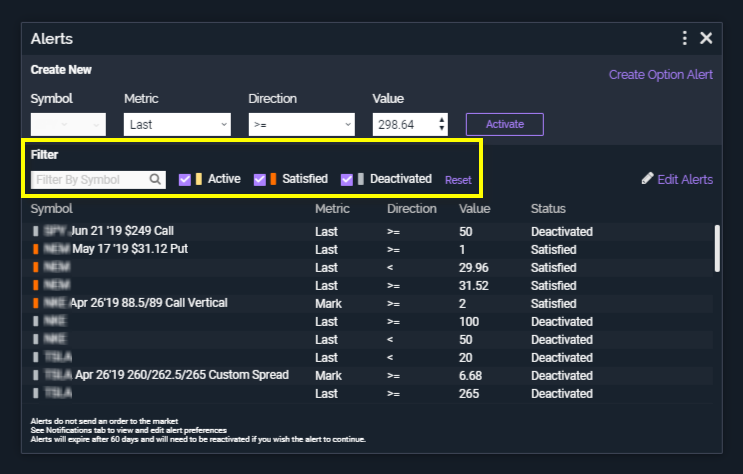
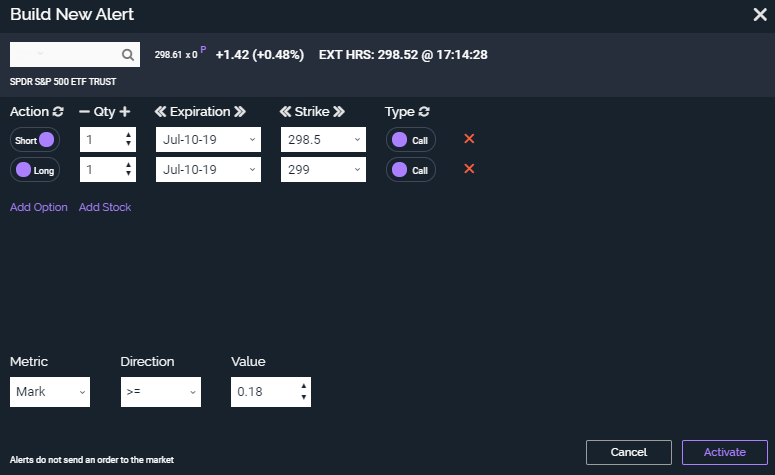
Options Spread Alerts
We understand that your alert needs may not end with stock movement notifications. The new Option Alert center lets you easily construct an option spread and specify when to be alerted. Follow these steps for a walkthrough of this new addition to our web platform:
- In the Alert Manager, click in the top-right of the window to “Create Option Alert”
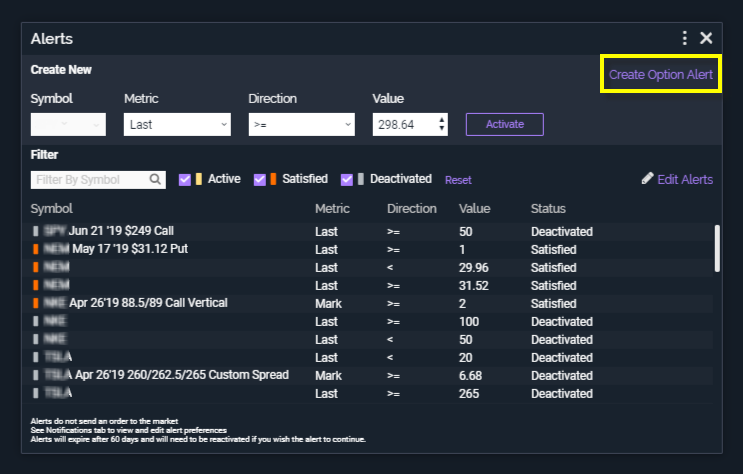
- Create a single-leg options alert or add multiple legs to track your strategy
- Customize your alert at a price point and be ready for your next trade
Charts
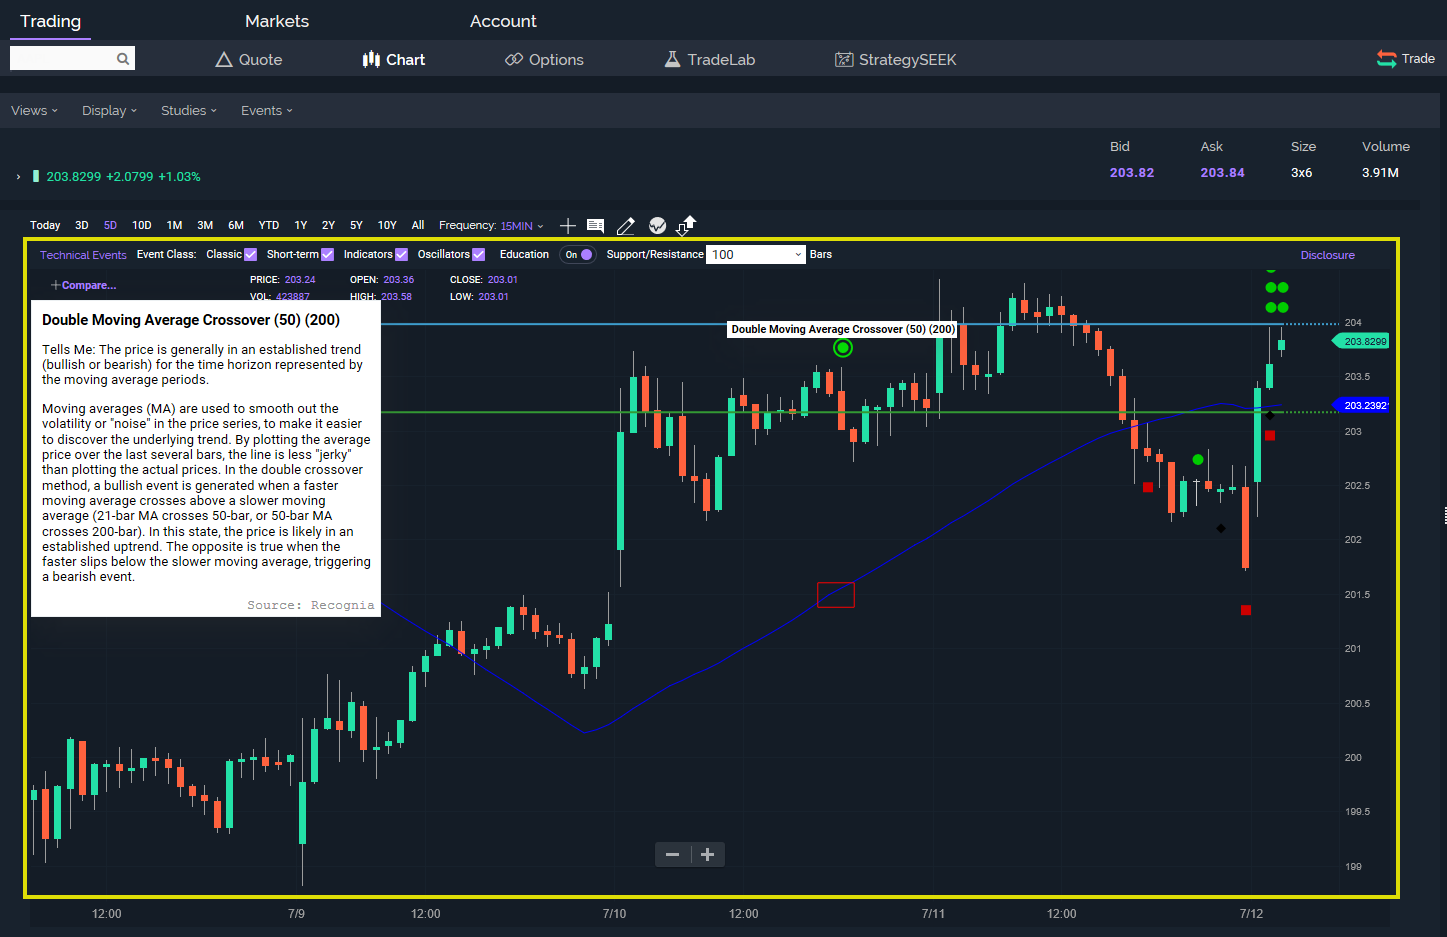
Charts are one of the easiest and most useful ways to analyze securities. Charting on the platform has already been customizable and efficient, but sometimes it takes a more detailed approach to plan your investment goals. That’s why we’ve incorporated the Recognia Plugin, which offers a technical view of charts. Recognia will display important metrics and explain to you what it might mean going forward. Soon enough, you’ll be an expert on the security.
- Toggle the “Frequency” on the Chart to 15min for intraday events or Daily for longer term events
- Click the circular chart icon to access the Recognia Plugin
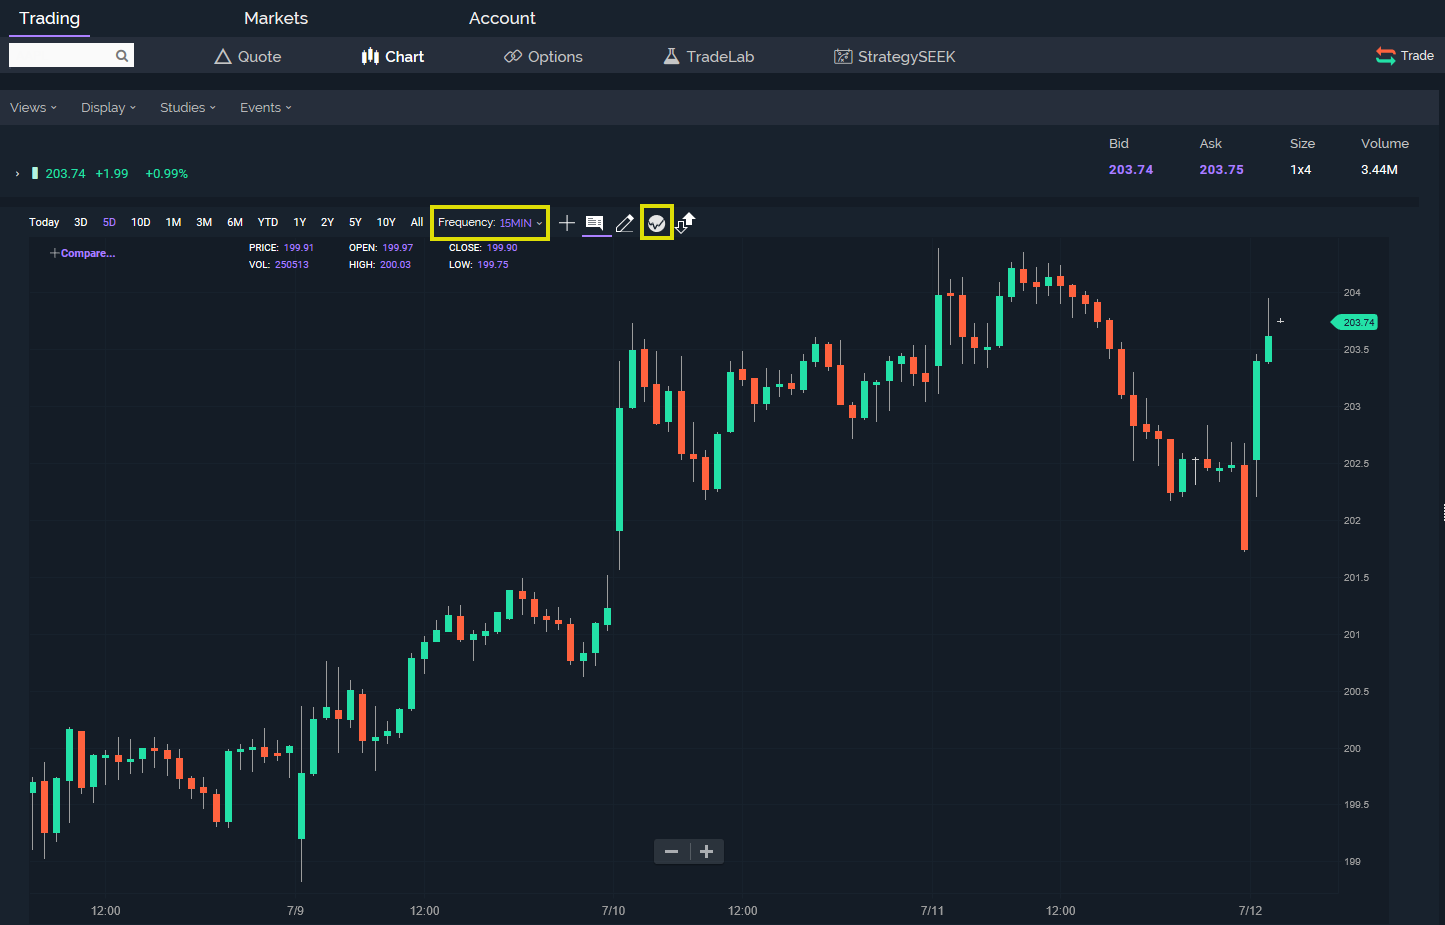
- From here you can click through the metric points Recognia displays
- Hover your mouse over a mark and read the explanation for its use
- Use the info to have a better understanding of your next trade
Version 13.0
Alert customizations
If the trick to independent investing is taking action at the right time, then half the game is staying informed. This is why we continue to focus on our alerts capability. In this release, we added the ability to control how you receive alerts.
- You can configure your Notification Settings in the User Configuration menu when you click on the gear in the top right of your trading platform.
- For filled orders and price alerts, you can choose the sound, length of display, and whether to receive an email or mobile push notification.
Chart enhancements
Technical analysis: Some investors cannot go 15 minutes without talking about the resistance levels of the strength index on their third favorite oscillator, while others just want to glance at a chart before placing an order. No matter which type of investor you are, we want to make sure our charts are as simple as possible to use.
- Now when you choose your Display or Event , we will have a check mark next to the type that you select.
- This will work for all our chart types; candle, bar, colored bar, hollow candle, mountain, baseline delta, Heikin-Ashi, wave, and scatterplot
- This same display is on all of our chart events; dividends, earnings, open cost basis, open orders, splits, and trade history
- This also applies to the events, data points, and indicators for our Visual Earnings tools; Miss/Beat: EPS, Miss/Beat: REV, Data Table, Price Horizon: EPS, Price Horizon: REV, and Historical
Version 54
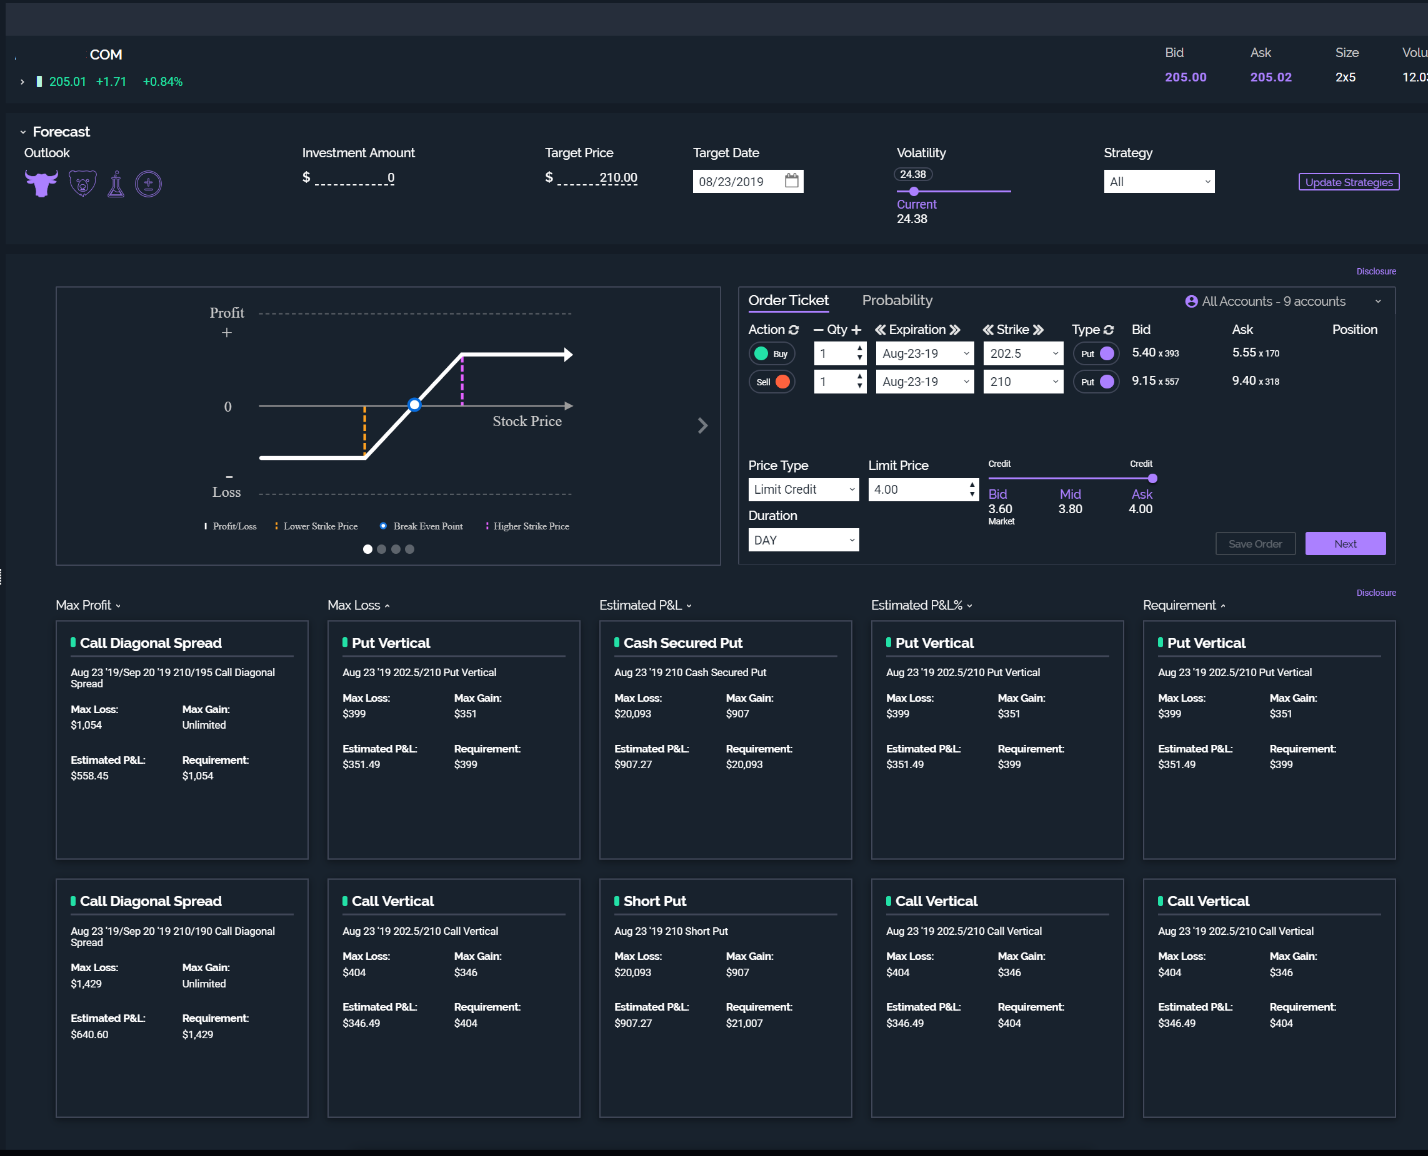
StrategySEEK
Want to trade options but not sure where to start? Our new StrategySEEK tool lets you analyze strategies in an intuitive way. Whether you’re bullish, bearish, or expect volatility or stability, options may help you prepare for what’s next—and StrategySEEK can uncover which options strategy may be the right solution for you in all types of markets. The tool is designed to help you find strategies that align with your market point of view based on where you think the market may be heading. Each strategy is accompanied by a graph, an explanation, and key price points, such as max gain/loss.
How do you place the order? Simply click on one of the strategies, and StrategySEEK automatically updates your ticket accordingly.
- StrategySEEK is found unde the Trading tab.
- Choose your outlook on the market and follow the step-by-step process to lay out your investment criteria
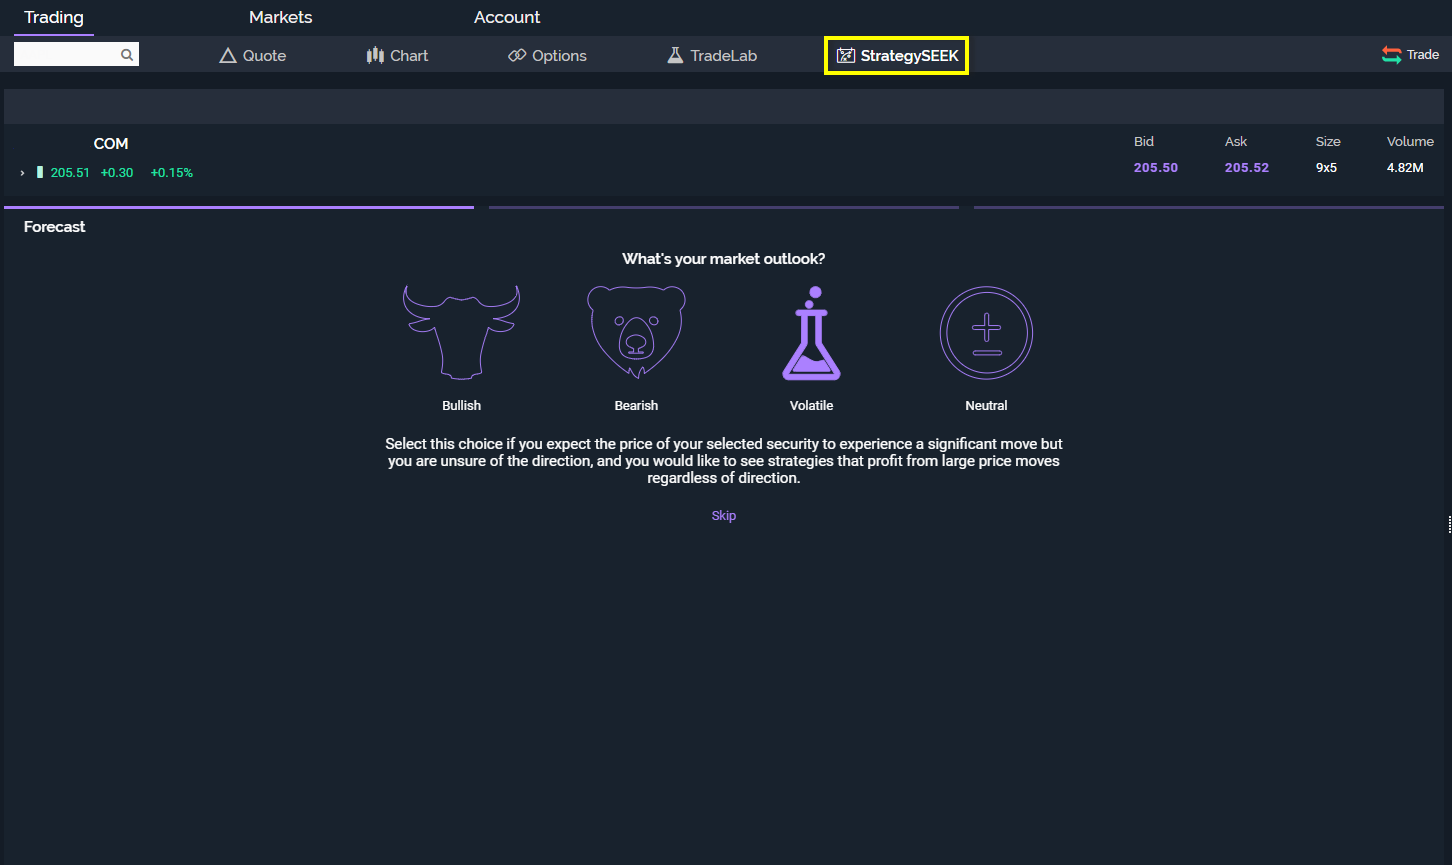
- You will then be navigated to the results of the search where you can compare strategies, easily view price movement probabilities, and place trades directly from the tool.
- You can also tweak your investment criteria and re-run the tool to try out different options strategies.
Version 52
Auto-minimize Option Order ticket
If you are an option spread builder then you probably already like how we allow you to click, drag, and drop option legs to build trades. You might even want us to mention how much you love that the details for the trade (Max Profit, Max Loss, Delta…) update as you drop the leg.
Well, now we are introducing the ability to remove an entire step from this process. There is now a setting to Auto-Minimize your order ticket when you start building your option spread.
- From the Options page under the Trading tab click on the gear icon in the top right and select Auto-Minimize.
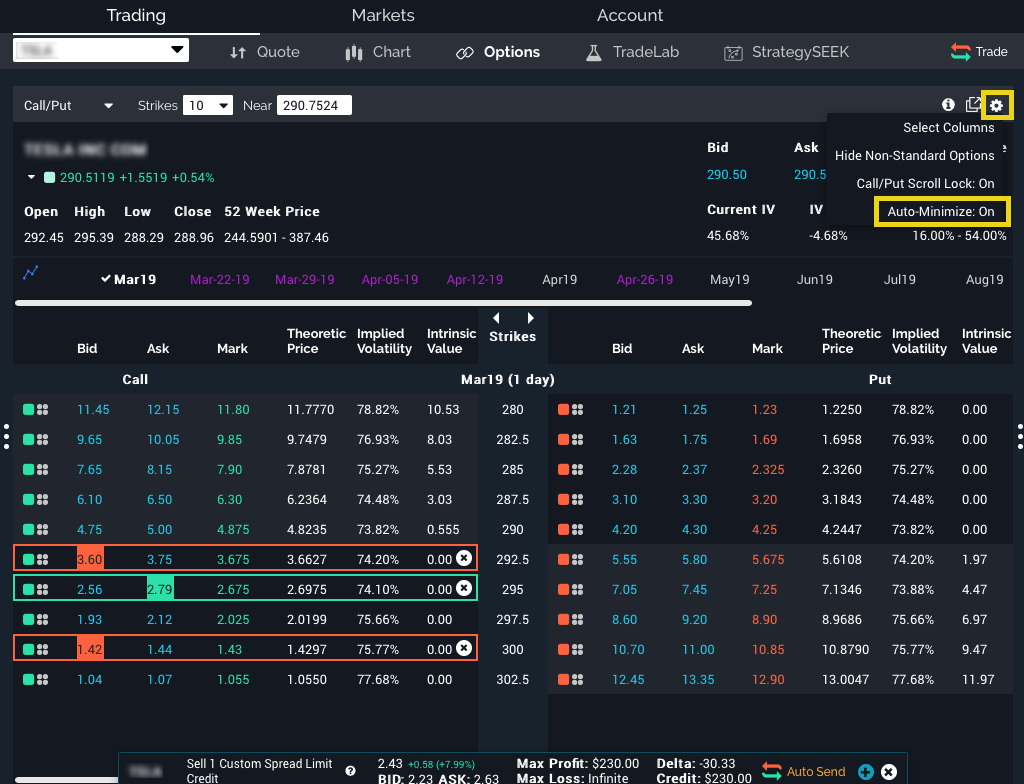
- Auto-minimizing your order ticket means it will not pop up in front of your option chain while you are building your trade.
- The important details of the order will be displayed in this minimized view.
- From here you can click on Preview to review your trade and press Send to send the order to the street.
- If you want more detail prior to previewing the order, just click the plus sign to maximize the order ticket.
Cleaning up the trader experience
Some of the platform pop up menu’s were confusing to close, so we added an "x" icon. Now, the Action Menu window (the menu that is shown when you click on a symbol or specific option) has the "x" at the top right. Click on this to close the window.
We also made the Symbol Entry box slightly wider. This aligns it with the design of the overall platform (and just makes it easy to type in).
Version 50
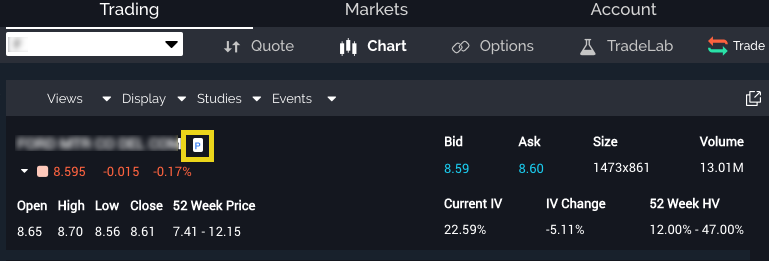
Position chip
We want to make sure that you never have to question whether you have a position in an underlying or not, so all the pages under the Trading tab now contain the Position chip. This little "P" icon informs you that you have a position and, with a hover over, gives details about that position.
Settings
Once you set the look and feel of your platform, we want to make sure those settings are saved. Moving forward with this effort, we are now saving the Near Field in your option chain and making the default Futures Option trade increment one contract.
Fast is good, faster is better
We made some small changes that have big effects. Now the Trade Lab tools that live under the Trading tab react much more quickly. This means that your Risk Profile and your Spectral Analysis tools load approximately three times faster than before.
Version 49
Chart view
Charting was recently voted traders' favorite pastime in an office water cooler poll. Riding high on this topical buzz, we decided to make our charts a little more useful. Now you can save the Display and any Study added to the chart for quick viewing.
- The new Views dropdown menu is located at the top left of your chart.
- Set your Display and add the Studies you need.
- From here you can click on the Views menu, type in the name of your New View, and save.
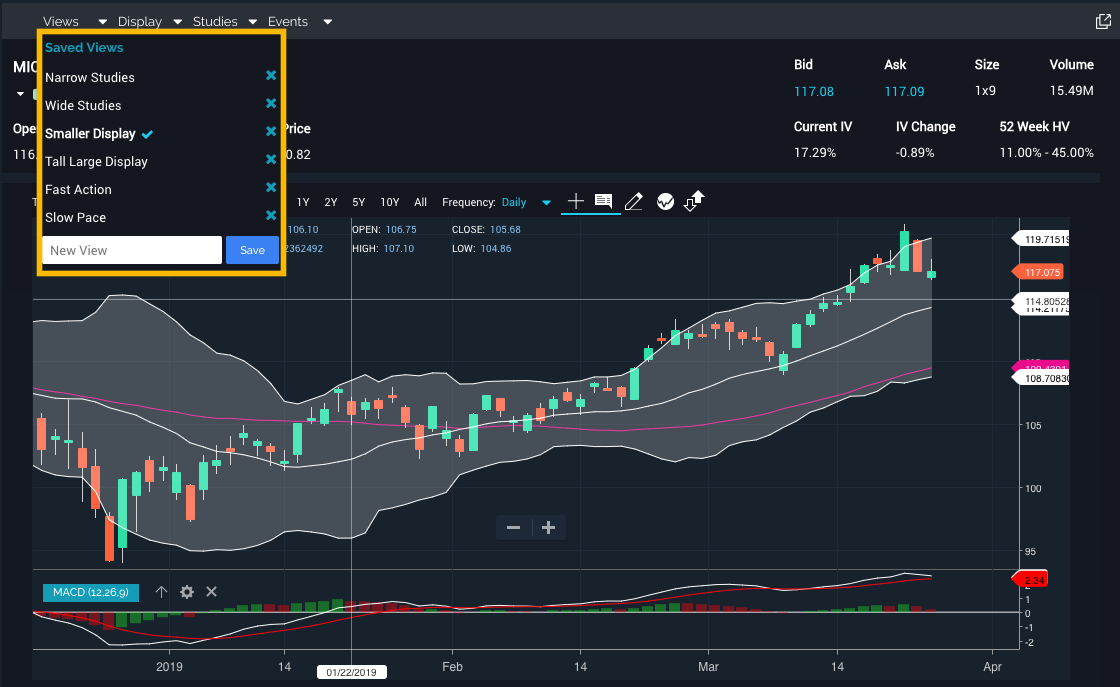
- Your View will be stored uniquely to your user, so you can pull up your Chart Views wherever you choose to log on.
- You can save up to 10 Views
- If you make a change while on one of your existing Views, you will be prompted to update that View. If you do not want to add the change to the existing View, click on Views and you can simply create a new View.
- Deleting a View is as simple as loading a View; from the Views drop-down menu you will see a small "x" next to the name.
Version 48
Risk Slide updates
If we told you once, we have told you approximately 11 times: To understand trading is to understand your risks. We are therefore continuing our effort to simplify the Risk Slide tool. With this update, we have made reading the tool more intuitive.
- The View menu now allows you to choose the exact name of the output you see.
- P&L shows the dollar amount you would gain or lose at the given percentage market move.
- Percent shows you the percentage of the overall Account Value you would gain or lose given the percentage market move.
- Acct Mkt Value shows you the actual Account Value at those given market moves.
- Range leaves nothing to be decoded. The percentage amount is what percentage change is shown and at what intervals.
- In the example, "10% By 2" shows the Risk Slide columns down and up by 10% at intervals of 8, 6, 4, 2, and 0.
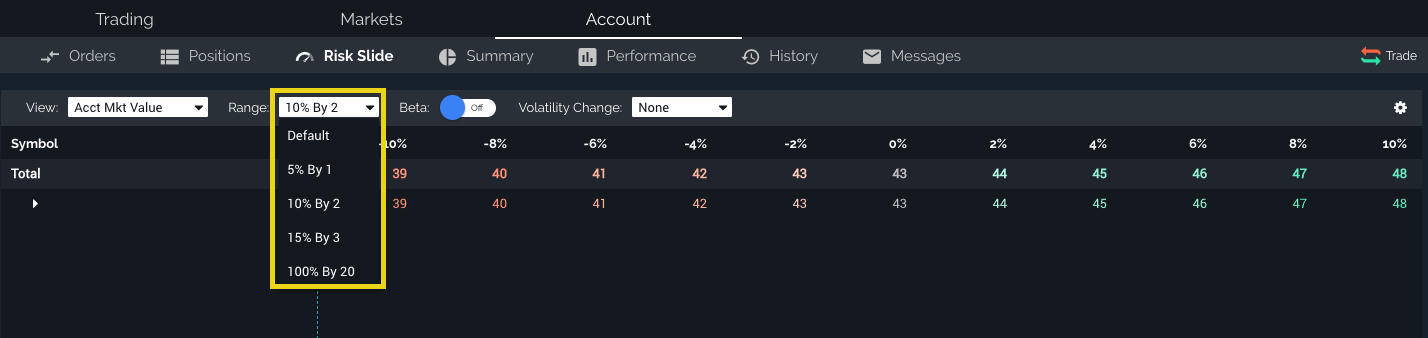
- In the example, "10% By 2" shows the Risk Slide columns down and up by 10% at intervals of 8, 6, 4, 2, and 0.
Holiday cleaning
We fixed a bug so that every time you delete a drawing, that drawing will remain deleted. Sometimes cleaning is pretty easy.
Version 47
Customizable widgets
Widgets are to the trading platform what honey is to the beehive: the sweet, sticky goodness that all the humans love. These widgets show you things like account info, watch lists, live news, and much more. Instead of just being able to arrange where the existing widgets are shown, you can now add, remove, and duplicate any of the widgets you have available.
- To customize your widgets, click on the Customize Widget icon in the top right of the platform.
- You are now in the customize mode.
- At the top of either side panel is a blank widget with a plus sign that you can click to add a new widget.
- Once you click the plus sign, you will see all of the widgets you can add.
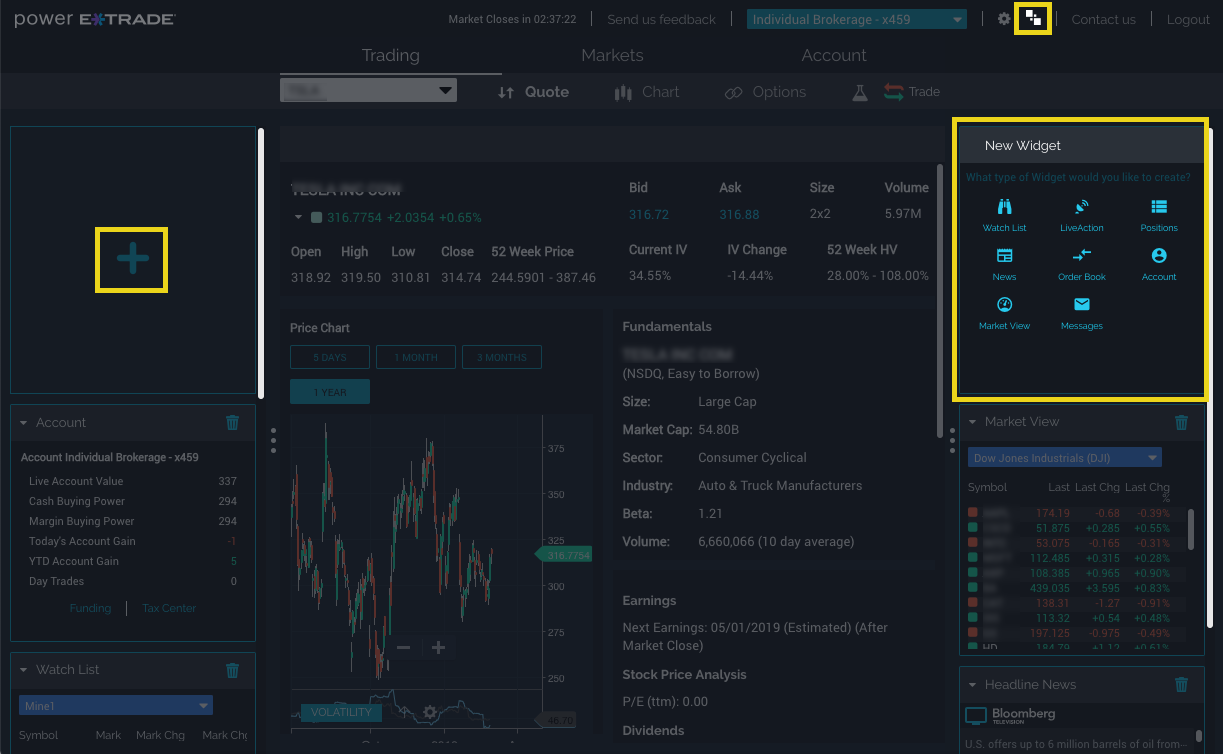
- After your widgets are added you can drag and drop them to reposition where you please.
- Deleting a widget from your layout is just as simple: While in customize mode, click on the little garbage can icon, and you will be asked if you are sure you want to delete.
LiveAction widget
Our LiveAction scanner contains a wealth of ideas. But with the LiveAction page a click or two away, these ideas aren't always readily available. To keep the ideas flowing, we are introducing the LiveAction Widget.
- To add the new widget, open the Customize Widget menu discussed above and add a new widget.
- From the list of available widgets, you will see the new LiveAction widget icon.
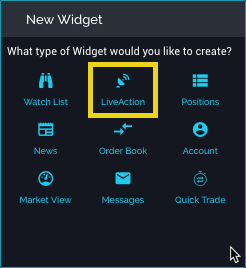
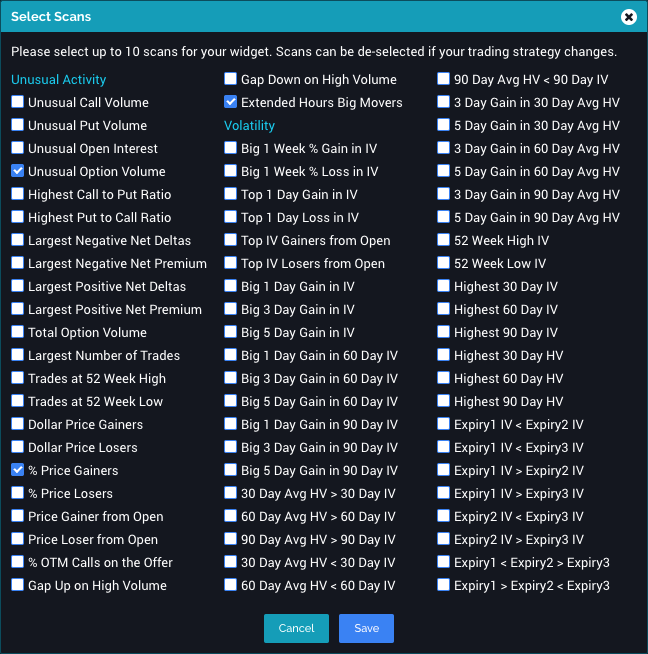
- After you choose the LiveAction widget and exit customize widget mode, you will see three of the most popular LiveAction scans.
- Though you are shown three scans by default, there is a list of 67 from which to choose. Click on the settings gear and choose Select Scans to see the whole list.
- These scans update automatically every 30 minutes by default. This refresh rate can be edited in the settings as well.
Futures order history
Our Orders page under the Account tab can be viewed in many different ways, and we wanted to make sure it works as expected for each tradable product. Now when viewing your futures orders, "Today" is defined as the day the product next trades. So if the product opens at 6 p.m. ET, that is the start of the day, and the Orders page will reflect that.
Version 46
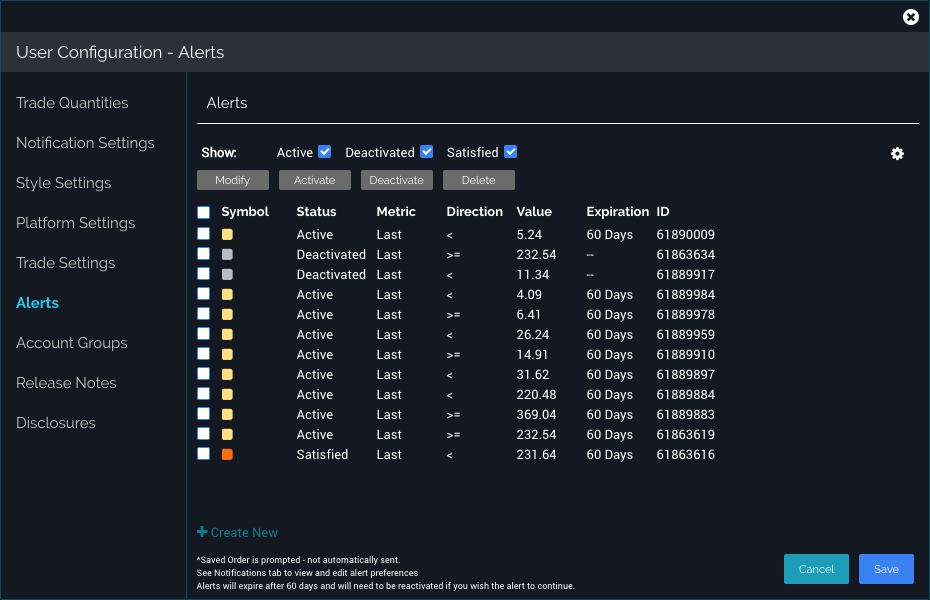
Creating alerts from the Alerts Manager
Managing alerts you have created in the past is a helpful practice. Your alerts were set with a purpose, and a periodic refresher of that purpose can help keep your investment goals on track. Now you can create new alerts right from the Alerts Manager.
- The Alerts Manager is found in the User Configuration window that is brought up by clicking the gear button at the top right of the page.
- From the Alerts page you have the ability to Modify, Activate, Deactivate, and Delete.
- And now Create.
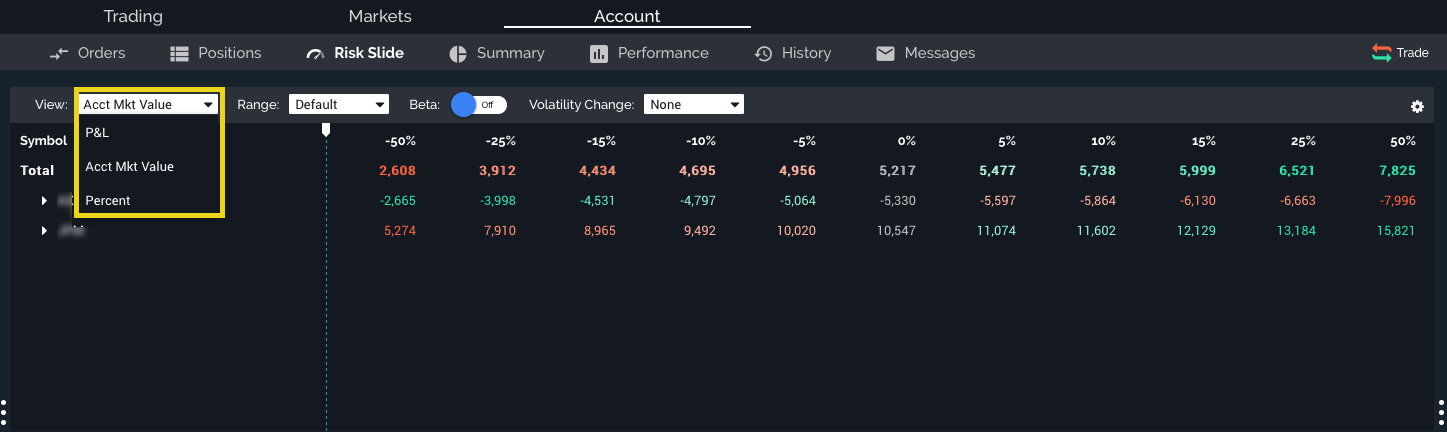
Risk Slide improvements
Because understanding the risks of investing is of the highest importance, we keep our Risk Slide tool at the forefront of our priority list. With this release, we added the ability to see your theoretical Account Value change as securities in your account change in value.
- From your Account tab choose the Risk Slide
- At the top left you will find a View menu with the choice of Acct Mkt Value
- This value displays your overall account value if the given underlying moves by the amount indicated at the top of the column
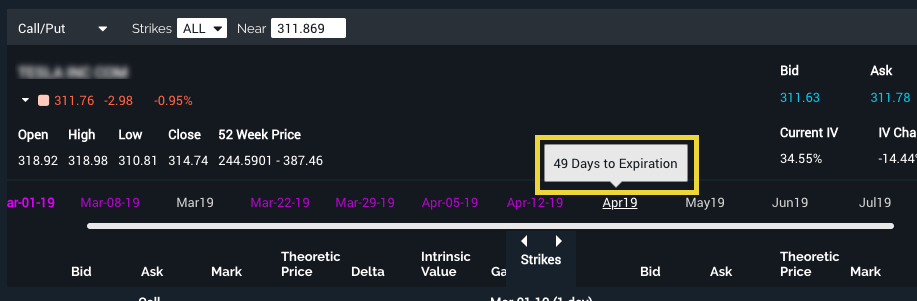
Option Chain transparency
- Quickly see the days left until any given option series expires. Once you are on the option chain, hover over an option expiration, and you will see a pop-up message with the number of days until the options expire.
Version 44
Risk Slide
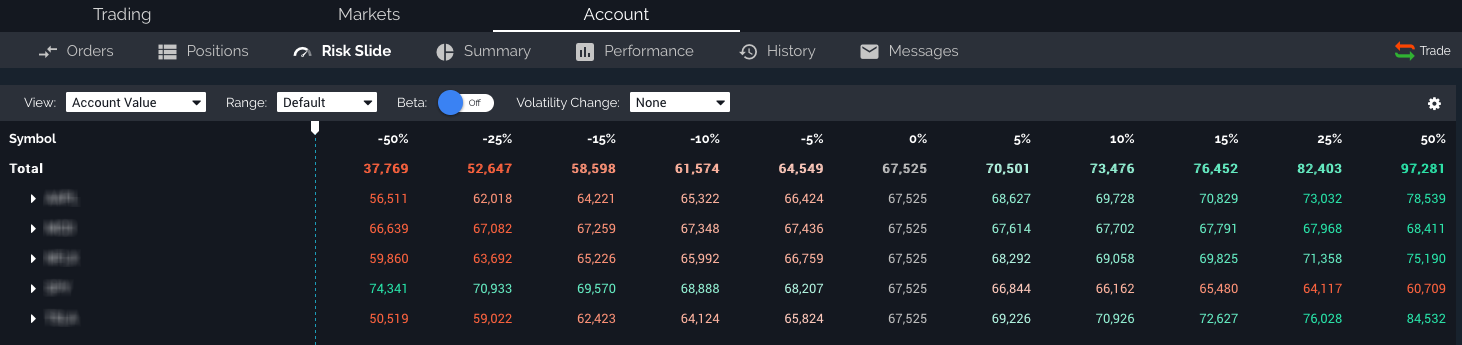
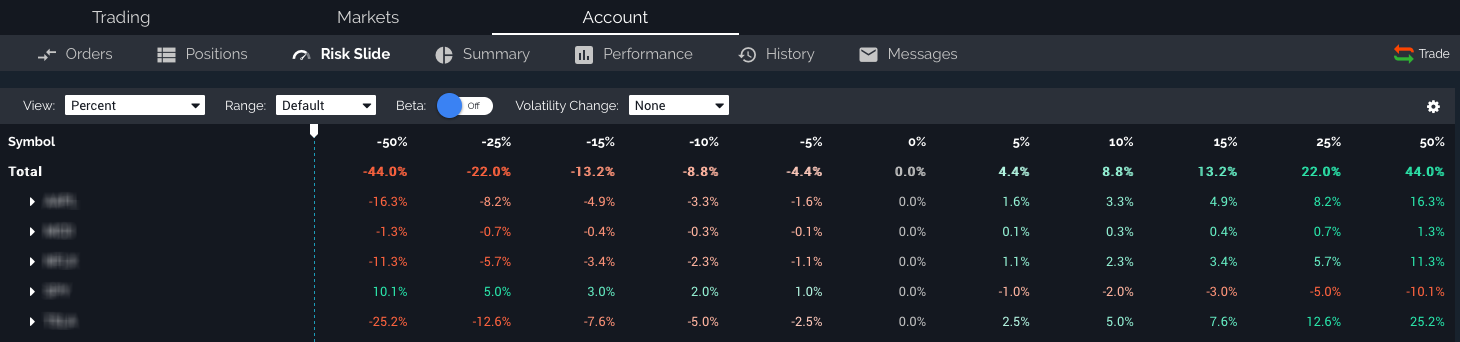
Our Risk Slide tool allows you to visualize how market events or changes in volatility may impact positions in your portfolio and view potential P&L numerically and graphically based on potential market scenarios such as different movements in the S&P 500®. With this release you can now see those profit and loss numbers through a couple different lenses. The two new views we have added to the Risk Slide are "Account Value" and "Percent."
- The Risk Slide is found under your "Account" tab.
- This is where you will find a table displaying profit and loss numbers at different points indicated by the column headers.
- The "View" can be changed at the top left from the default P&L to Account Value or Percent.
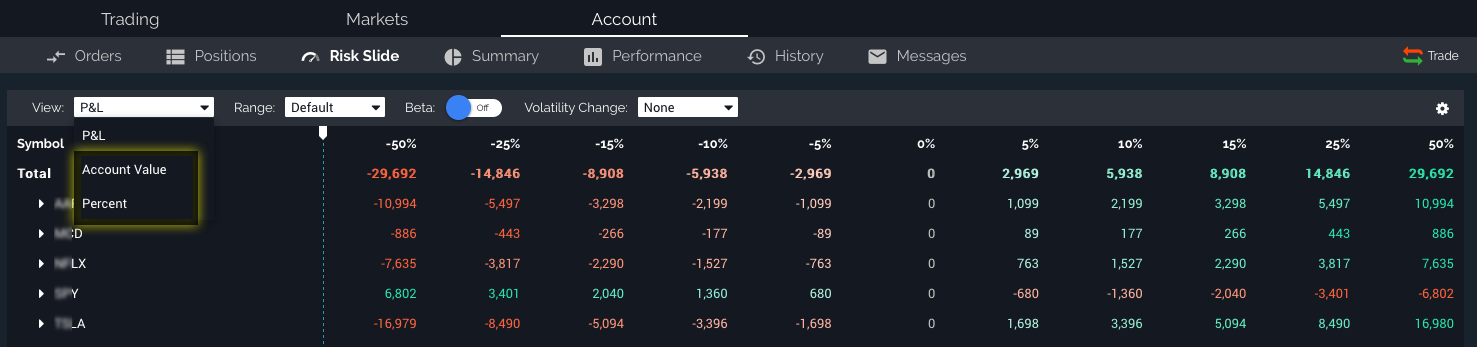
- Account Value displays the value for your entire account as the underlying symbol in your portfolio moves up and down the slide.
- Percent is the percentage change for that same account value.
Row Highlighting
Lists are important for keeping track of your trading. Whether it is an order book or a Watch List of symbols, alerts, or position data, your trading day is likely full of navigating lists. With this in mind, we decided to give your eyes a little relief with the addition of row highlights. Now you will see different shading for alternating rows for all of your lists.
- Row Highlighting (or Zebra Striping for the hipsters) will change the rows of your lists to alternating colors.
- This is a global setting, so once enabled it will affect your entire platform.
- The Row Highlighting setting can be found in your User Configuration under "Style."

News Page Expansion
We are also not done expanding our "News" tools yet. As we are making our News page more helpful and more idea-driven, we are also trying to make it easier to read. We have drastically reduced the size of each row on the page, so now you can see twice as many news headlines at a glance.
- This feature’s beauty lies in its simplicity. Just navigate to the "Markets" tab, and choose the "News" page.
- All of the news headlines are now one row in height.
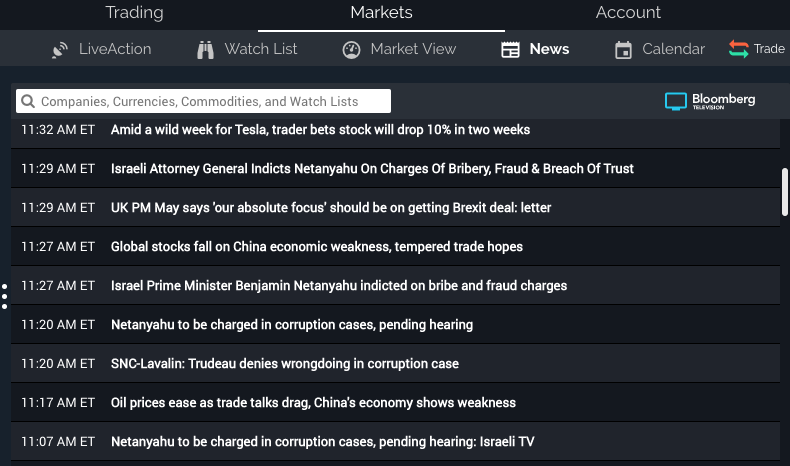
- To see more details, hover over the headline, and it will expand.
- Click on the headline to pop out the full article.
Version 43
Chart alerting
One of the reasons that traders use charts is to help them pick the right price points or points of interest for their investment objectives. We want these points of interest to be more than fleeting feelings wonder. Now you can easily set alerts at any point by clicking on Chart and choosing the alert bell. Once activated, these alerts are stored on our servers so we will let you know when the condition is met, regardless if you are logged on or not.
- Activate Chart Trading at the top of your chart.
- Click on any point on the chart, and you will see three choices, including an alert bell:
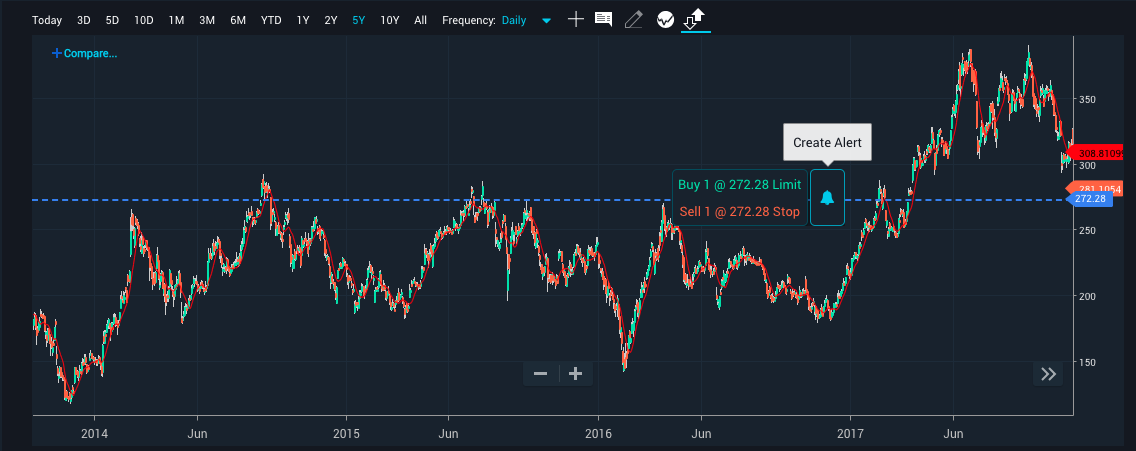
- Clicking the alert bell will bring up the Alert Creation window:
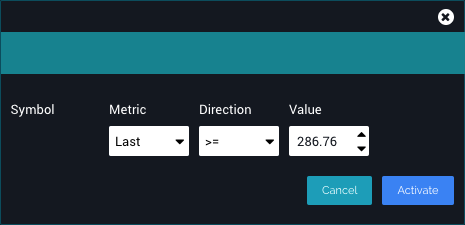
- Creating an alert follows similar logic to placing orders: Picking a price below the current market will default the alert to the "less than" direction, and picking a price above will default the direction to "greater or equal to."
- Clicking "activate" will send the alert to our servers and you will be notified.
- As always, your alerts can be managed within the alerts section of the User Configuration menu
News on your positions
We have expanded the ability to search news out a bit further. Now you can filter out the news to see the stories that are relevant to your positions. This will allow you to browse news that is focused solely on your portfolio. You can also now type in the name of any Watch List you have created to search for the list by name.
- The news filter is shown on the top of your News page under the Markets tab.
- This filter will allow you to search for symbols, company names, commodities, and even watch lists
- Clicking on the data entry box will display the most recent symbols, lists, as well as positions and headline news.
- A single click on "positions" will load the news filter in such a manner that only the article tagged with your underlying symbols are shown
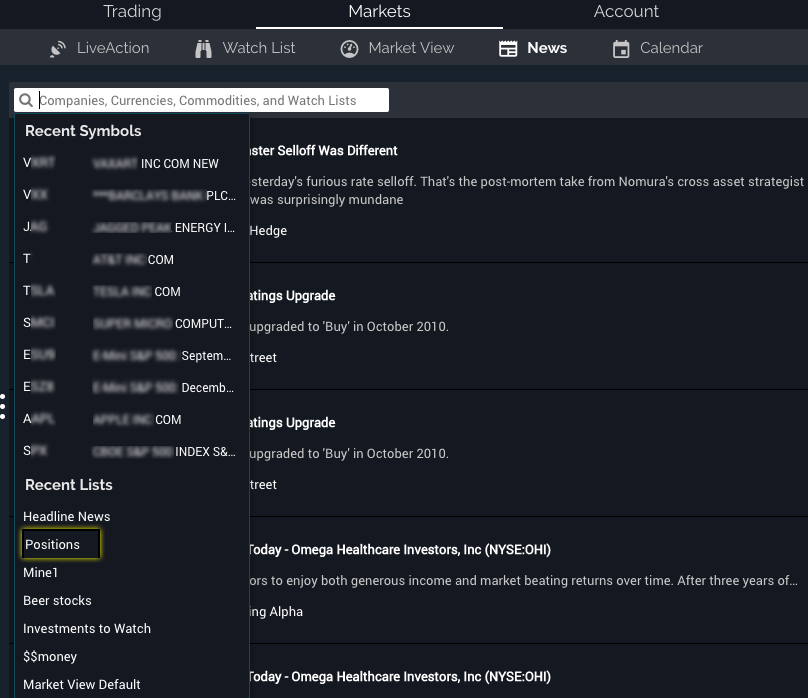
- Clicking on "Headline News" from the list will change the display be to show all of the most recent news as if there are no filters applied
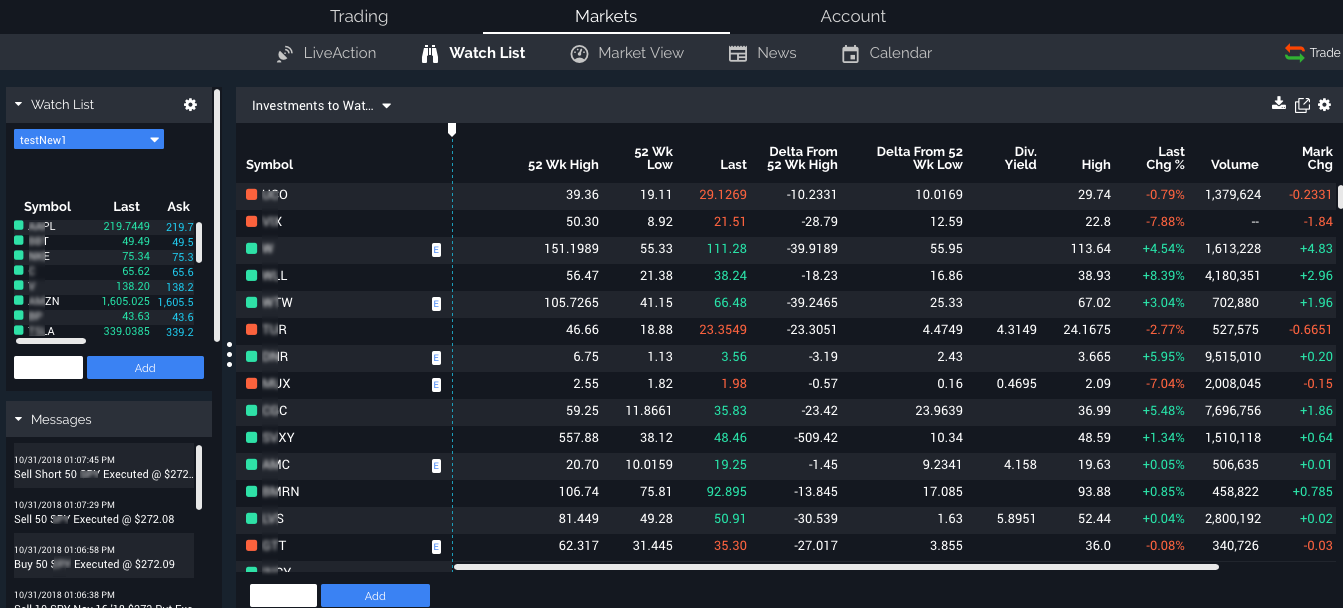
Delta from 52 week high/low watch list columns
The more data points, the merrier. It’s an old saying that we like to use to pressure our data providers, and once in a while, our persistent pestering pays off. Our hope is that you notice a consistent theme going forward as you will continue to see new helpful data points available. First up is Delta from 52 week high and Delta from 52 week low.
- As with all of your Watch List columns, these columns are added and removed from the gear at the top right-hand corner of your Watch List page under the Markets tab.
- From the gear menu, click "Select Columns".
- You will see the new columns titled "Delta From 52 Wk High" and "Delta From 52 Wk Low"
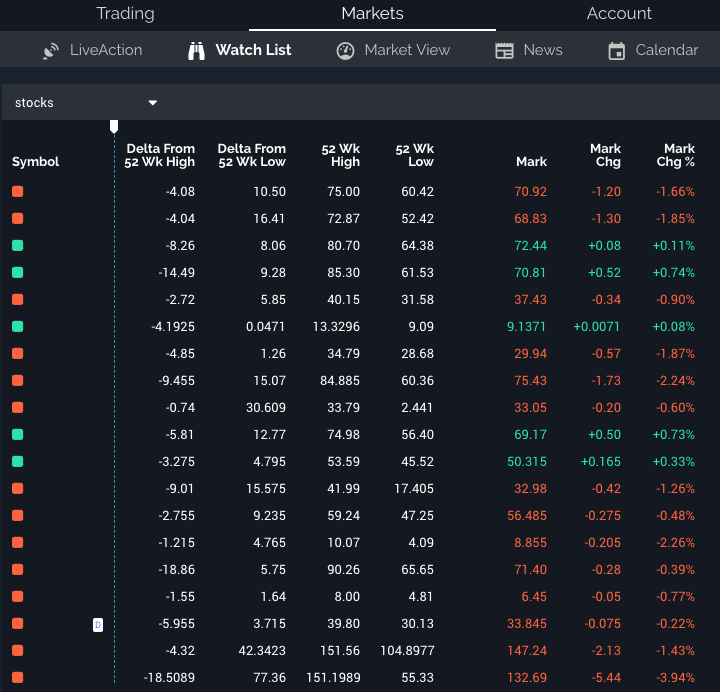
- The Delta from the high column displays a negative number representing the net dollar amount that the current price is away from the 52-week high
- The Delta from the low column displays a positive number representing the net dollar amount that the current price is away from the 52-week low
- When the current price is at the 52-week high or low, the respective column will display a dash
More information on Chart tooltips
Charting leads to charting, which often leads to an investigation of how many different studies coincide. Now your charts allow you to see more useful information about your studies so that you can determine any particular study’s settings. As soon as you hover your mouse over any of the study lines, you will be a descriptive tooltip to help focus the precision of your charting.
- Add any study to your chart or, if you have studies, just hover your cursor the study and you will see the name, and any inputs shown in the tool tip
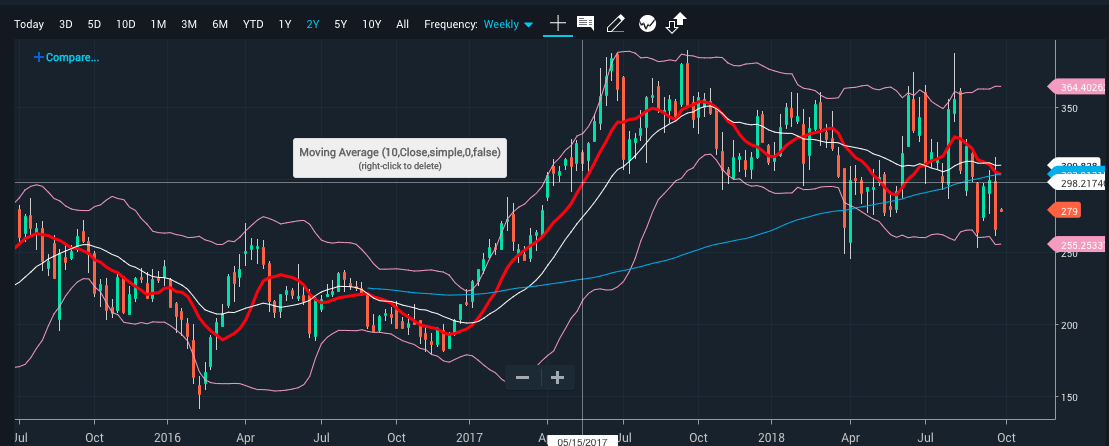
Version 42
Chart trading
If you are a chart technician that has been studying patterns, cycles, statistical relationships, and candlesticks movements, then this feature is for you! If you haven’t been doing these things, then this feature is still for you! We wanted to make Chart Trading intuitive so that beginners easily grasp it and chart experts quickly become much more efficient. The whole point of Chart Trading is to allow you to keep your focus on the point of the chart that is driving your trading decision. That is why we allow you to find any point on your chart and create a limit order right there!
- Chart Trading is a mode that is activated by clicking on the little up arrow/down arrow icon at the top of your chart.
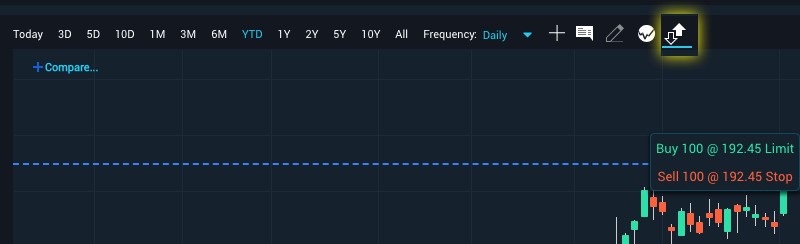
- Once in chart mode, you will see your mouse control a blue price cursor within the chart.
- A single click on any price point on your chart will display the Buy/Sell bubble menu.
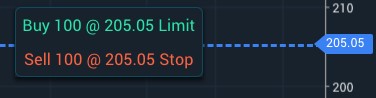
- If you are above the current price the choices will be Buy Stop and Sell Limit. Below the current price will give you Buy Limit and Sell Stop.
- The quantity is your default quantity for the product you are charting, and the limit price is simply where you clicked on the price axis.
- Clicking on a buy or sell action will populate your order ticket; from there, the work flow for placing your order is the same as before.
- Once your order is sent, you will see your open order displayed within the chart.
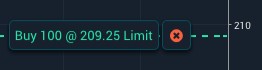
- You can drag and drop open orders shown on the chart to modify the limit price. The new limit price will be created at the price where the order is dropped. Your modified order ticket will pop up for confirmation.
- You can cancel any working order by a single click on the little x next to the open order bubble.
- Currently, we support the main order types: Limit, Stop on Quote, Trail Stop on Quote, Hidden, and Reserve orders. Stay tuned, we plan to introduce more orders types soon.
Option Chain Open Orders Indicator
Managing a large options position means different things to each trader. Some define “large” as holding a thousand contracts, some say it is having positions on forty-five different strikes, and others say that their one lot is large. All of these are true, so whatever your definition, we want to make managing working orders as easy as possible. Now all of your working orders can be seen right next to the strike on the options chain and modified without leaving the chain.
- Bring up a chain that contains an option for which you have an open order, and you will see a small indicator at the top of the strike.
- Click on that indicator to bring up a detail and action window for the open order.
- From the detail window, you can also cancel, modify, or copy the order.
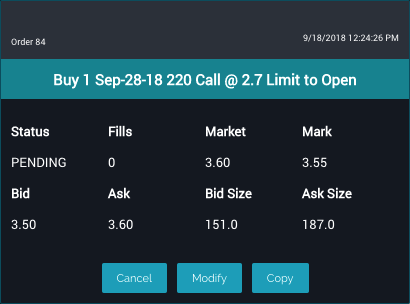
For illustration only. Not a recommendation. - The indicator will show on the left for Call orders and the right for Put orders.
- This indicator works for all orders, including spreads.
- If you have multiple orders on the same option, the first click will allow you to choose the order that you would like more detail and the second click will take you to the detail and action window.
Action Menu on Strategy Option Chains
Our Action Menus are a great way to quickly access what you need with a single click so you can go from thought to action as easily as possible. Now you can get to the Action Menus from the option chain while viewing any of the Strategy Option Chains.
- To enable Strategy Option Chains, select an option spread from the top left drop-down choice of the option chain.
- While viewing Strategy Option Chains all of the data points shown are for the strategy selected.
- Click on any option or strategy in the option chain to bring up the Action Menu.
- The Action Menu will display your possible selections for navigating the application as it relates to the specific option spread you selected.
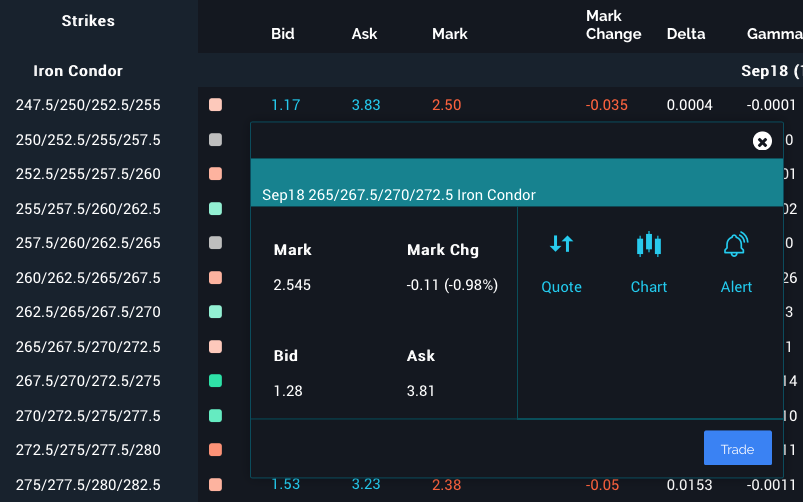
Hotkey map
We recently introduced hotkeys to help you navigate the software. It’s been a few weeks, and a handful of you have requested a reminder as to what each hotkey is—and you do not want to go through the menu to receive said reminder. Now there is a hotkey for your hotkeys!
- Hold down the shift key for three seconds and voila, a hotkey will appear. Release the shift key, and it disappears.
- Stay tuned for more hotkey improvements, and keep the feedback coming!
Futures calendar spread
As you have noticed, the Quote page changes to accommodate the product you are viewing. For our futures trades, we display all of the available calendar spreads for the root contract selected. These calendar spreads are now sorted by the spreads with the highest volume.
Email notification settings
Being a successful trader depends on being in the know—and staying on top of your account is critical. We want to make sure that you are informed any time something happens for all your alerts. Now you can choose between email accounts or just a message to your application. To adjust your notification settings, go to the Configuration Settings within the Notifications section.
Version 20
Watch List News! Get your Watch List News!
Now that you can filter out your news to only see specific symbols we decided to take the next logical step, which is to filter out your news by an entire list of symbols. With the Watch Lists filter for news you can now select your defined Watch List from the symbol entry box and view the news for only those symbols in the list.
- Navigate to the News page and click in the Symbol Entry box. At the bottom of the list you will see your recently viewed Watch List.
- From here you can just click on the name of your Watch List and you will only see news for symbols that are in that list.
- The news articles that mention a company either directly or indirectly are deemed associated, and then tagged with that company’s symbol.
- All of the news is sorted by the most recent at the top.
When your trade needs help – You call Protection
We're adding Protection to our first round of Adjust tools. Selecting Protection from the Adjust tool menu will bring up the adjustment to buy one put for every 100 shares for stock. If you are short the stock, like all of the adjustments, the tool will do the opposite and buy one call for every 100 short shares.
- Navigate to your Positions page and click on the position that you wish to protect and choose Adjust from the Quick Action menu.
- Choose Protection from the Adjust tool you will see the Adjustment trade.
- The Adjustment is a protective put that is one strike out of the money.
- The option is always the next monthly expiry that is at least one full week from expiring.
- Click on Create Order in the lower right and your Order Ticket will appear where you can modify the expiry, strike, limit price or any other detail of the order.
Work it harder, Make it better, Do it faster, Makes us stronger…Mainly Faster!
Normally our performance improvements result in you seeing an indirect benefit. However, with our latest enhancements you will not be able to avoid the benefits. In order to explain please allow me to get a little technical.
An analogy for our platform could be a series of tubes, akin to a children’s play place at your local fast food restaurant. Inside this complex system of interconnecting tubes live many layers of rules defining which way the kiddos can travel. Some sets of rules will lead to the ball pit, others will lead down slides, and some just lead to the glorified dead ends with a small fake steering wheel. Over time, as the play place expands, the rules can conflict to a point where some tubes lead to dead ends jam packed with ball pit balls. So with this release we rearranged the tubes and simplified the rules, now all of your tables (Positions page, Options chain, Orders page) scroll much faster.
Version 19
Protection & Income Strategy
We are excited to introduce a new strategy member to our Adjust tool strategies: Protection & Income. On the off chance that you are not an avid reader of these release notes, we remind you that the Adjust tool is found by either clicking the Adjust (wrench) icon in the quick action row or by choosing the Adjust button on the Position Action Menu. This is where you will find the new strategy choice Protection & Income.
- This strategy is applicable to any of your optionable stock positions with 100 shares or more
- Once you choose Protection & Income from the Adjust tool, you will see the adjustment trade
- The adjustment is a combination of a protective put (that’s the protection part) and a covered call (you guessed it, income)
- These two options can be sent to the market as one trade—simply click on "Create Order" in the lower right corner
- Your order ticket will appear where you can modify the expiry, strike, limit price or any other detail of the order
Ice-Cold Hotkeys
Let's be honest: Navigating around the platform with your mouse can be a little too time consuming. If you agree, you can now activate hotkeys. These will allow you to quickly change pages, bring up a buy or sell order ticket, or activate the User Configuration Settings menu without taking your hands off the keyboard.
- Hotkeys can be activated by navigating to the Platform Settings
- Once activated there is map of all the currently available hotkeys. (watch for more to come)
- The buy
- The buy and sell hotkeys can further be used to decrease or increase the quantity by repeating the hotkey action
Hiding Sub-Orders
We have noticed that a growing number of you group account users have too many orders to make the Orders page more usable. First of all, we consider everyone that has this problem close personal friends. Secondly, we determined that this is usually caused by the number of Sub-Orders displayed. Now, when you are in a group account, you can filter those Sub-Orders so you will only view the main Group order.
- This filter is available on your Orders page only when in a group account view
- Using the filter is easy: Click on the Sub-Order toggle switch at the top right of the Orders page
- When this toggle is set to Hide, all sub orders will be hidden and the only orders shown will be the main group orders sent
Technical events for Futures
We are always excited to expand helpful features to more products. Now all of the technical analysis tool tips you have become accustomed to overlaying on your stock charts are also available on your futures charts.
- From the Charts page, bring up a futures contract and adjust your frequency to daily.
- You will see the Technical Events icon is active and clickable, so click it.
- You can filter to only view the Event Class in which you are interested (e.g., classic, short-term, indicators, oscillators)
- You can turn on the Education is a toggle at the top of the chart, so that you get a full description of any Event you hover over.
- Clicking on the Event will draw the study or drawing integrated right on your chart.
- The Support/Resistance drop down menu will allow you to determine how far back the data should be used to calculate these levels. You can also choose "none" if you are not interested in the support and resistance levels.
- As always, you can quickly remove a study or drawing overlaid on your price chart by right clicking it.
Filter Menu Cleanup
This feature fell into the “simplify and save space” bucket of improvements. For all the Account pages that have tabular details, we have pulled the filter icon out of the settings menu and gave it a home on the top row. The Filter icon will remain on this top row and will become highlighted when any filters are applied. This same change has been applied to the Order Book widget as well.
- On your Orders, Positions, and History pages the filter icon is now on the top row.
- Click on this icon to select the items you want to see, deselect the items you do not want to see, and then click save.
- You can see that the icon is highlighted when a filter is applied, to reset the filters click again on the icon and choose "Reset."
Sorting Columns
Speaking of clean and simple, this was the same idea behind the small change to sorting. Clicking on headers of columns in your Accounts page will still sort in ascending order, the second click will sort in descending order, and a third click will unsort. Doing this three-click method allows us to save an entire row at the top of the given page and thus making the page cleaner and more concise.
Risk Slide Status Improvements
The Risks Slide page can do some fancy tricks when it comes to displaying the risk points for one, many, or all of your positions. You can select and deselect specific parts of your portfolio to be included in your overall Risk Slide.
- You can now keep the underlying positions (or parts of your positions) selected or deselected as you navigate away from, and back, to the Risk Slide
- This same behavior is true for highlighting one of your positions
- For more details on the Risk Slide functionality, please see the Risk Slide release notes
Beyond the Edge: The Order Ticket
Traditionally the Order Ticket has been trapped by the edge of the platform. Now we have broadened its horizons. You can drag the Order Ticket up, down, left, or right. This allows you to adjust your order and still see the important parts of the platform.
- Bring up your Order Ticket and place your cursor on the header bar.
- You will see that you can move the Order Ticket as far as you like, except completely off the screen
New News about News
Our News page is beginning its journey into a more informative, timely, and topical tool. First up on this list is the ability to filter out the News page by symbol. This feature is pretty straight forward: just go to the News page and at the top you will see the symbol entry box.
- Enter a symbol, and you will see only news that relating to that symbol
- The top six articles relevant to your symbol will appear, with the most recent news at the top
Price on the Spectral Analysis Tool
We continually work to improve our Spectral Analysis tool; one of the small improvements we've made is to allow the ability to manually enter the price field on Spectral Map. (The Spectral Analysis is found on the TradeLab page under Trading.)
- You can see the theoretical profit and loss for your analyzed trade on the right-hand side of the Spectral Map
- You can still click on the point and time you want to set in the future, but now you can also enter the exact price by typing in the price box to the right
Chart Time Frame Updates
We wanted to make our defaults as smart as the chartist using them (you!) and so with that in mind, we changed how the chart frequency is determined when switching between time frames. Now if you make a frequency change to one of your time frames, that frequency will remain until you (manually) change it.
- On the Chart page, frequency is defined with the little drop-down menu to the right of the time frames
- We have replaced the 20 day time frame with a 10-day
Feedback on Feedback Button
There have been some small visual changes to our feedback button.
- At the top of the platform, there is a small link that reads "Send us feedback."
- Click the feedback button to see it is more aligned.
- And while you're there, tell us how great we are! But seriously, please give us feedback—we are only here to make the platform yours. Keep your suggestions coming!
Version 16
Reserve orders (iceberg orders)
Just the tip! When you are working on larger than normal orders, you may want to hide your full intent. If that is the case, the solution is as simple as changing the price type in your order ticket. The new Price Type choice is called Reserve and is added to the growing list of price types.
- To find the Reserve Price Type, bring up your order as you normally would, click on the Price Type drop down menu, and select Reserve.
- Choosing Reserve may alter your quantity—this is because this price type needs at least two full order lots: one to show and one to hide.
- For options, you need a quantity of at least two contracts; for stocks, you need at least two hundred shares.
- Once you determine your total quantity, you will see a new field in the Order Ticket labeled Display Quantity.
- Display Quantity will be the amount that is shown to the street.
- The difference between the Display Quantity and the total quantity will be the amount that the street does not see. The orders are sent to the street, and as soon as any part of the Display Quantity is filled, the quantity is refreshed and the total quantity is shown. The order is then processed the same as other orders.
Pattern day trades counter
If trading is a part of your day, then Day Trading is probably part of your life. Whether you love them or hate them, the pattern day trading rules can affect your trading. These rules determine the amount of funds needed in your account in order to participate in more margin leverage for the trading day. We are now displaying the number of round trips you made in a five-day rolling period.
- If you are in a margin account, the Day Trades counter will appear at the bottom of your account widget.
- This field will only show when you are in single account view.
- The Day Trades value will let you know how many day trades you have made in the five-day rolling period defined by FINRA 4210.
After hearing your encouraging feedback from our last Detail Tiles update, we decided to add another tile to your Orders page.
- The new Quote Tile can be found on all of your orders on the Orders page.
- You access this tile in the same manner, click on the bento box menu next to the symbol.
- The data in the Quote Tile is related to the actual order, whether it is a spread, single leg option, stock, etc.
Totaling totals
We all know why we are here and what’s important to us: our positions! For that reason, we wanted to be sure that the Position page was concise as possible, yet rich with the information you need. We therefore removed the Totals from this page and have rolled all of the data associated with that row either to the Multiple position row or the top row.
- This is an improvement to the look and feel of the Positions page; it is not a feature you need to turn on or off.
- We consolidated rows so that when a position is expanded (and you see the stock and all associated option positions), the top level will show you all the information related to the underlying rows. In the case that you only have one option position, the data will be related to that option. This change saved an entire row of space per position, space that will quickly add up if you have several positions.
Version 15
Holdings percent for Quantity Assistant
We know managing multiple accounts can be difficult, so we focus on minimizing the effort involved. We’ve therefore introduced the ability to adjust your positions by adding to, or closing out, a specific percent of your holdings. Now, with our Quantity Assistant tool, you have the ability to add to your current holdings or decrease based on the percent you choose.
This means, for example, if you want to close 50% of your XYZ stock in five different accounts, just enter 50 in the Holdings percent box, and the tool will calculate and display the quantities for orders in all five of your accounts.
- The Holdings percent box is added as a field in our Quantity Assistant tool.
- Bring up your order ticket. If you are in a multiple account group, you will see a third tab at the top titled “Quantity Assistant.” If you do not see the Quantity Assistant tab, switch to an account group or “All accounts” at the top left.
- From there you can manage your multiple account orders in several ways. To see the new holdings percent, click on the gear in the top right and choose “Select Columns.”
- Only three columns are allowed at once, so you may have to uncheck one.
- Typing in the Holding percent box will change the quantity by the percent you determine.
- The rest is taken care of: Holding percent knows which accounts have what quantity of stock, understands how to round the quantities up or down (so it does not send fractional quantities), and it displays all of this for you to review and edit as you please.
Default Custom Group names
Due to your feedback, we are changing the default Custom Group names to recognize and display the option’s strike. The change is straight forward—we use the strikes in the name of the custom spread so that the default name easily details your spread.
- Build your custom group as you have previously, but now when you add multiple strikes, those strikes appear in the strategy name by default.
- You can still edit this name as you please, although now it may be less necessary.
Chart menus clarification
In a continuing effort to grant you access to all of the data points needed to make informed decisions, we have added the Quote Detail Tile to the options chain.
- From any options chain, while in the call/put strategy chain, you can click on the small bento box menu to the far left of the Calls or Puts, which will reveal the Detail Tiles.
- The third detail tile we have introduced is Quote: Quote has price data displayed for the particular option you choose.
- This creates more room for data at the default options chain level.
Version 14
Options chain Time and Sales and Depth view
We have added the ability to view more details of any option. We are starting this effort with two detail cards: Time and Sales view and Depth view. These views allow you to see trading as it is happening, as well as the prices of the best displayed quote on each exchange.
- The Time and Sales view displays the time, price, quantity, and exchange on which the most recent trades occurred for the given option.
- The Depth view allows you to see the number of contracts being offered at the national best bid and offer price as well as the best quoted bid and ask prices displayed on every exchange.
Income and Repair tool
The Income and Repair tool is designed to give you an understanding of ways to manage your stock positions. To find the tool, simply click on any position on your Positions page, and the Action menu will appear. If you are hovering over an eligible position, you can click the Adjust button.
- For stock positions of 100 shares more and for which there are listed options, you may choose either an Income or Repair strategy.
- Income will set up a covered call by selecting an out of the money option that has more than six days left to expire. The goal of the strategy is to collect the premium of the call while your stock may not be in an uptrend during that time frame.
- Repair will create a ratio call spread: buy a near the money option and sell two out of the money options. The goal here is to lower your trade price of the stock position by selling a covered call and pairing that with buying a vertical call spread to lower your overall breakeven price.
- You may then adjust the options position(s) strike price up or down and change the expiration month.
Roll Up and Roll Down tool
Like the Income and Repair tools, the Roll Up and Roll Down tool allows you to quickly adjust your options positions. This tool understands your option positions and can assist you to manage your positions and quickly roll your positions. The tool will work on your single leg and two legged options strategies and is found by clicking Adjust in the same Position Action menu.
- Roll Up will build a closing transaction for your existing position, as well as an opening transaction using the next available strike price above your current position, which you can then adjust on the order ticket.
- Roll Down will build a closing transaction for your existing position, as well as an opening transaction using the next available strike price below your current position, which you can then adjust on the order ticket.
- Both of these options will create a complex spread order to allow you to adjust your positions in one single transaction.
Orders: Additional details
The ability to view your orders is important when it comes to being fully involved in your investing. We have expanded the amount of detail you can see right on your Order page.
- Click on the bento menu right next the symbol for the order that you wish to see more details.
- The Order Details window displays details about both the product and the order type.
- The Order Status History window displays line items for every status update for the order.
Quick account switch navigation button for multiple accounts
We continue to focus on making managing multiple accounts from a single logon easy. With that idea in mind, we have added a simple navigation button to the Summary details window that allows you to quickly jump to any specific account.
- The Summary page is a quick breakdown of your portfolio and account value details.
- When viewing multiple accounts, you can click any individual account and get a detailed summary view.
- From this detailed summary, you can now jump directly to that one account with the “Switch To This Account” button.
Version 13.1
Custom Grouping
If you are an options trader, you have a good understanding of all your positions. However, there are times when the position you would like to track and the position that is defined by regulators, are not the same. Now you can determine exactly how your options positions are grouped into spreads on your positions screen with the Custom Grouping tool!
Starting with the Custom Grouping tool
- From your positions screen, click on any position. This will bring up the action menu where you will see the Grouping icon.
- Within the Custom Grouping window, simply drag a position that needs to be regrouped from the left to the right.
- You can drag full spreads or single legs of any position.
- Once dropped on the right, your custom spread is built.
- You can further customize your group by hovering over it and choosing “Split.” Splitting allows you to break up a single position that has a quantity greater than one.
Giving your Custom Group a name
- Custom Grouping will name the group, either with single position or any spread it recognizes.
- Once you have your custom group built (up to four legs), you can change the default name by clicking on the pencil icon that appears while hovering on the name.
- After your Custom Groups are built and named, you will see a small “C” chip next to any custom group.
- You can now see all of the data for the custom group in the same format you see the rest of your positions.
- To remove or regroup your custom group, click on the “C” chip, and you can use the same drag and drop methods used to build them.
- To delete a single group, bring up the Custom Grouping menu, drag the group to the right, and hover over the group to view the garbage can icon.
- You can reset all the groups for any given symbol by clicking on the cog in the top right of the Custom Grouping window.
Get up to $1,000 $1,500 for a limited time1
Open and fund a new brokerage account with a qualifying deposit by 10/31/2026. Learn how
Terms apply. Use promo code: OFFER26