Stock market sleigh
- Market solidly in the green this month
- Stocks historically more bullish just before/after Christmas
- Certain days have tended to be stronger than others
December has historically been one of the more bullish months for stocks, and so far the market has done a good job of padding those credentials.
Including today, there are eight trading days left in the month. That’s plenty of time for December to add to its gain—or give it back. It’s also the heart of the so-called “Santa Claus Rally” period when the stock market is supposed to be in an especially giving mood.
Although it certainly doesn’t pan out every year, there is some evidence of above-average bullishness in the days just before and after the Christmas holiday. As shown in “A look inside December’s trading pattern,” the second half of December has tended to be more bullish than the first half. And since 1990, the SPX has rallied over the eight days surrounding Christmas 70% of the time, with a median net return of 1.1%.1 By comparison, only 60% of all eight-day periods since 1990 have been positive, with a median return of 0.5%.
The individual returns for these days have also shown some relatively consistent patterns, with the bullishness concentrated in the three days before and after the holiday:
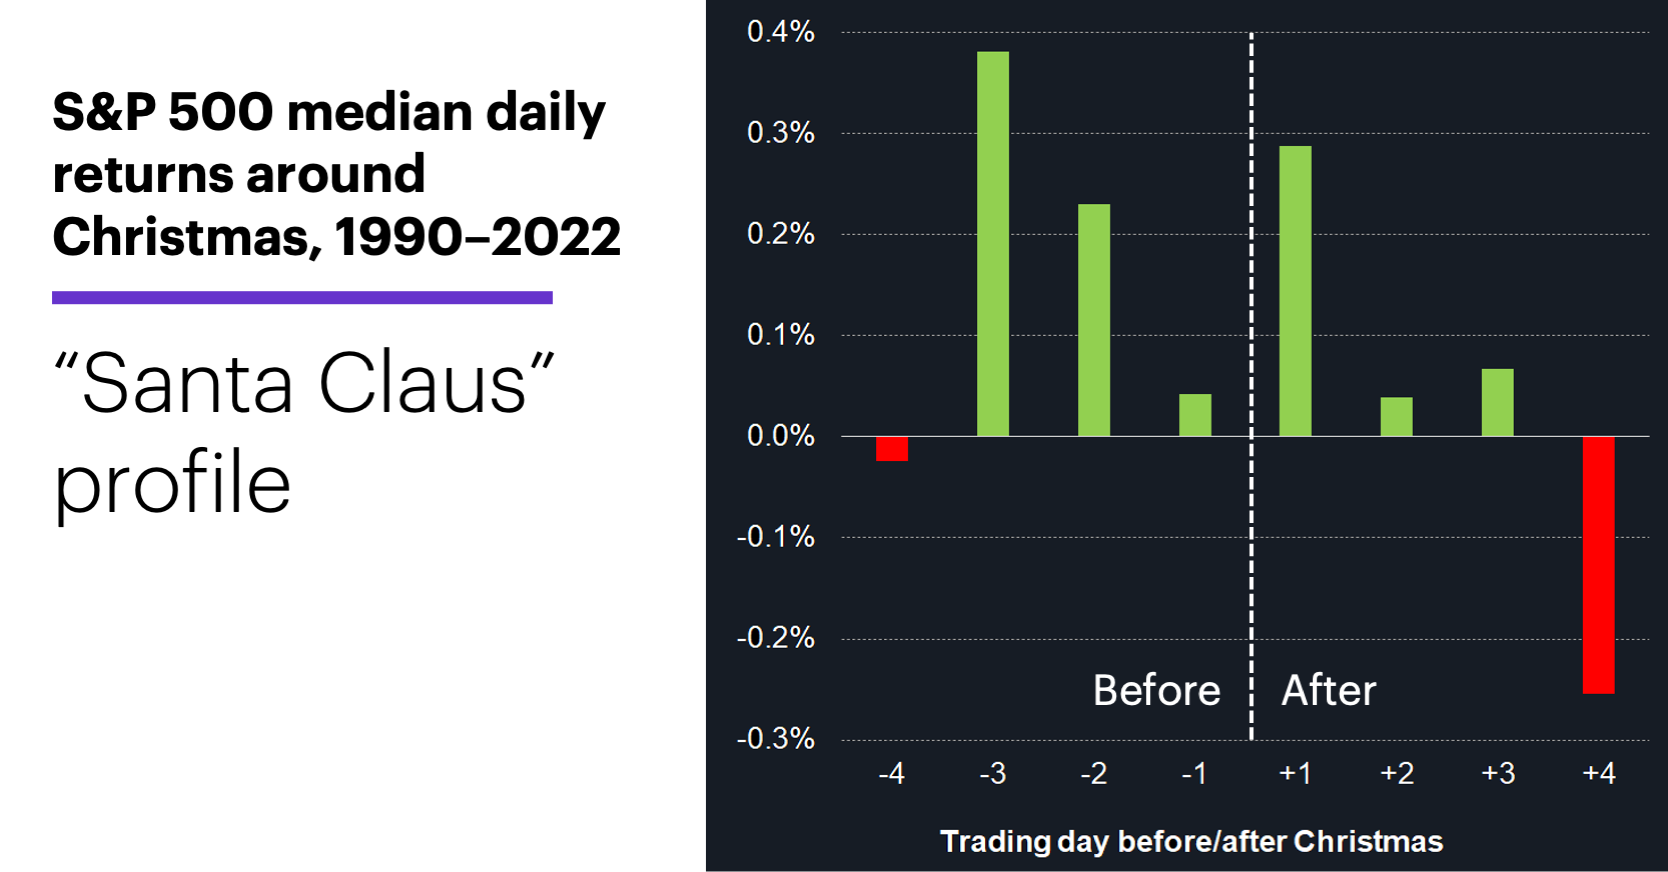
Source (data): Power E*TRADE. (For illustrative purposes. Not a recommendation.)
The fourth days before and after Christmas both closed down more than up and had negative median returns. The second day before the holiday had the strongest combination of return size (0.23%) and likelihood of closing higher (73%). The third day before the holiday had the highest median return, but it was an up day only 64% of the time.
The fourth day after Christmas—which, depending on the year, was the last or second-to-last trading day of the year—was the weakest day in this window. It had a median return of -0.25% and closed lower 61% of the time. (The final trading day of the year, regardless of whether it was the fourth or fifth day after Christmas, closed lower 63% of the time.)
Every year is different, of course. But even though last year was the weakest December since 2002, the SPX posted a net gain for this eight-day period (albeit, a small one—0.6%). It also closed lower on the fourth day after Christmas:
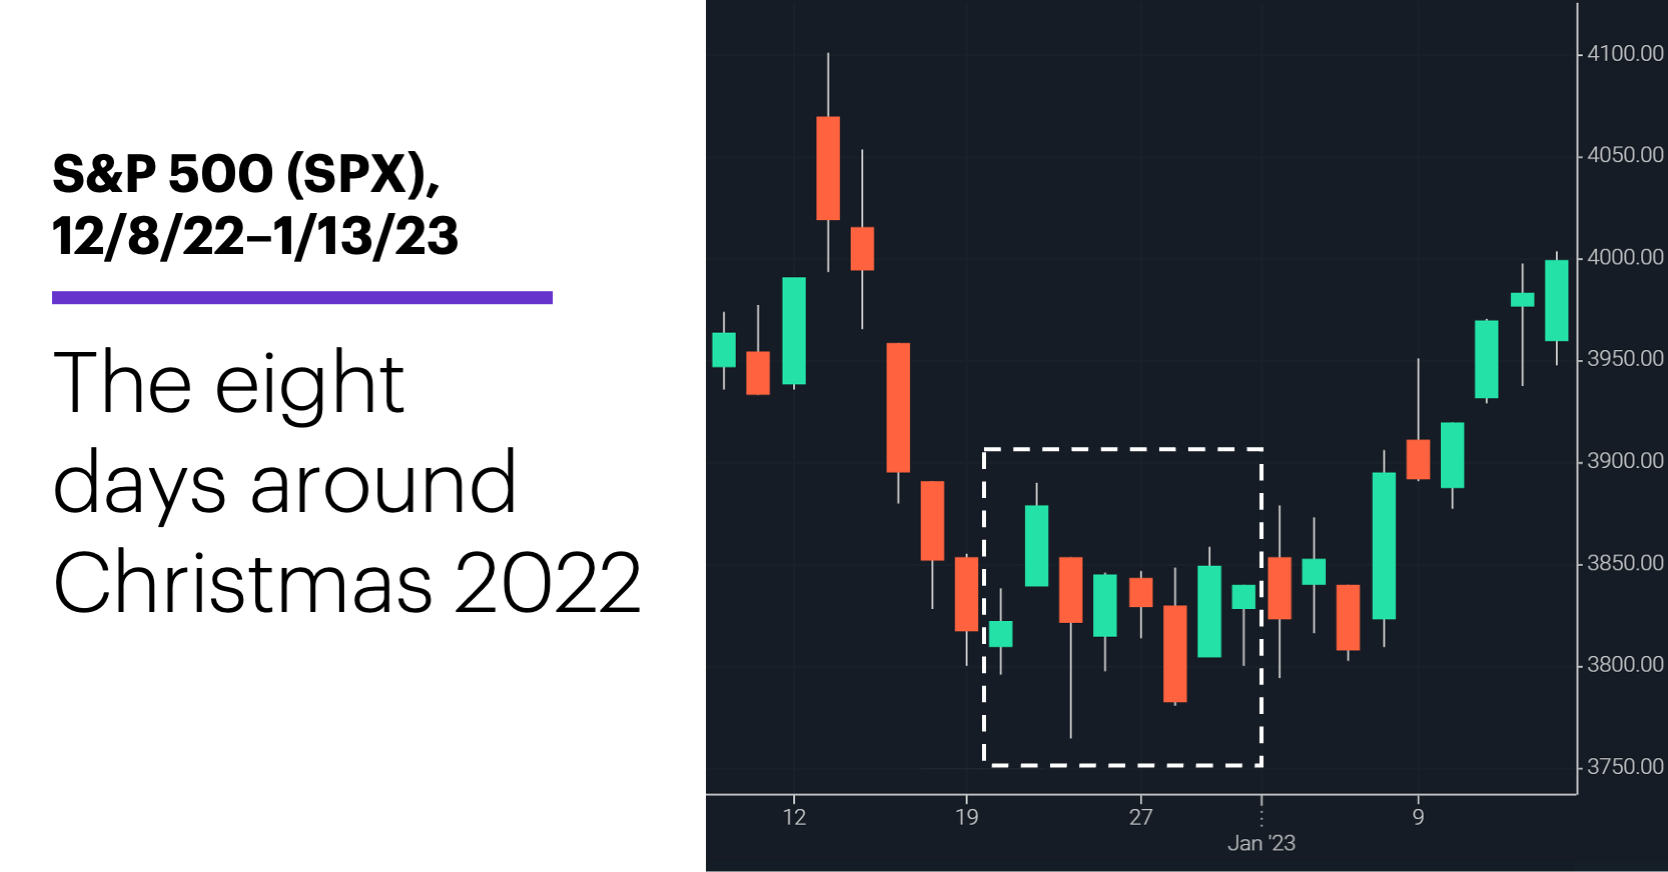
Source: Power E*TRADE. (For illustrative purposes. Not a recommendation.)
Experienced traders understand that tendencies are just that—things that have occurred more often than not. They’re not a given. And even when a seasonal pattern unfolds, it won’t necessarily closely match the composite picture created by its long-term average performance.
Today’s numbers include (all times ET): Housing Starts and Building Permits (8:30 a.m.).
Today’s earnings include: Accenture (ACN), FedEx (FDX).
Click here to log on to your account or learn more about E*TRADE's trading platforms, or follow the Company on Twitter, @ETRADE, for useful trading and investing insights.
1 All figures reflect S&P 500 (SPX) daily closing prices, December 1990 through December 2022. “Christmas” refers to the day the markets close in observance of the holiday, not December 25. The eight-day return around Christmas refers to the SPX’s percentage change from the close on the fifth trading day before the Christmas holiday to the close four trading days after it. Supporting document available upon request.