Market makes it three
- Pullback hits three weeks, tech leads sell-off
- 10-year yield approaches 4.7%, bank earnings mixed
- This week: Fed inflation, GDP, “Big” earnings
Traders questioning whether one of the strongest short-term stock market rallies of recent years would ever pull back significantly got their answer last week.
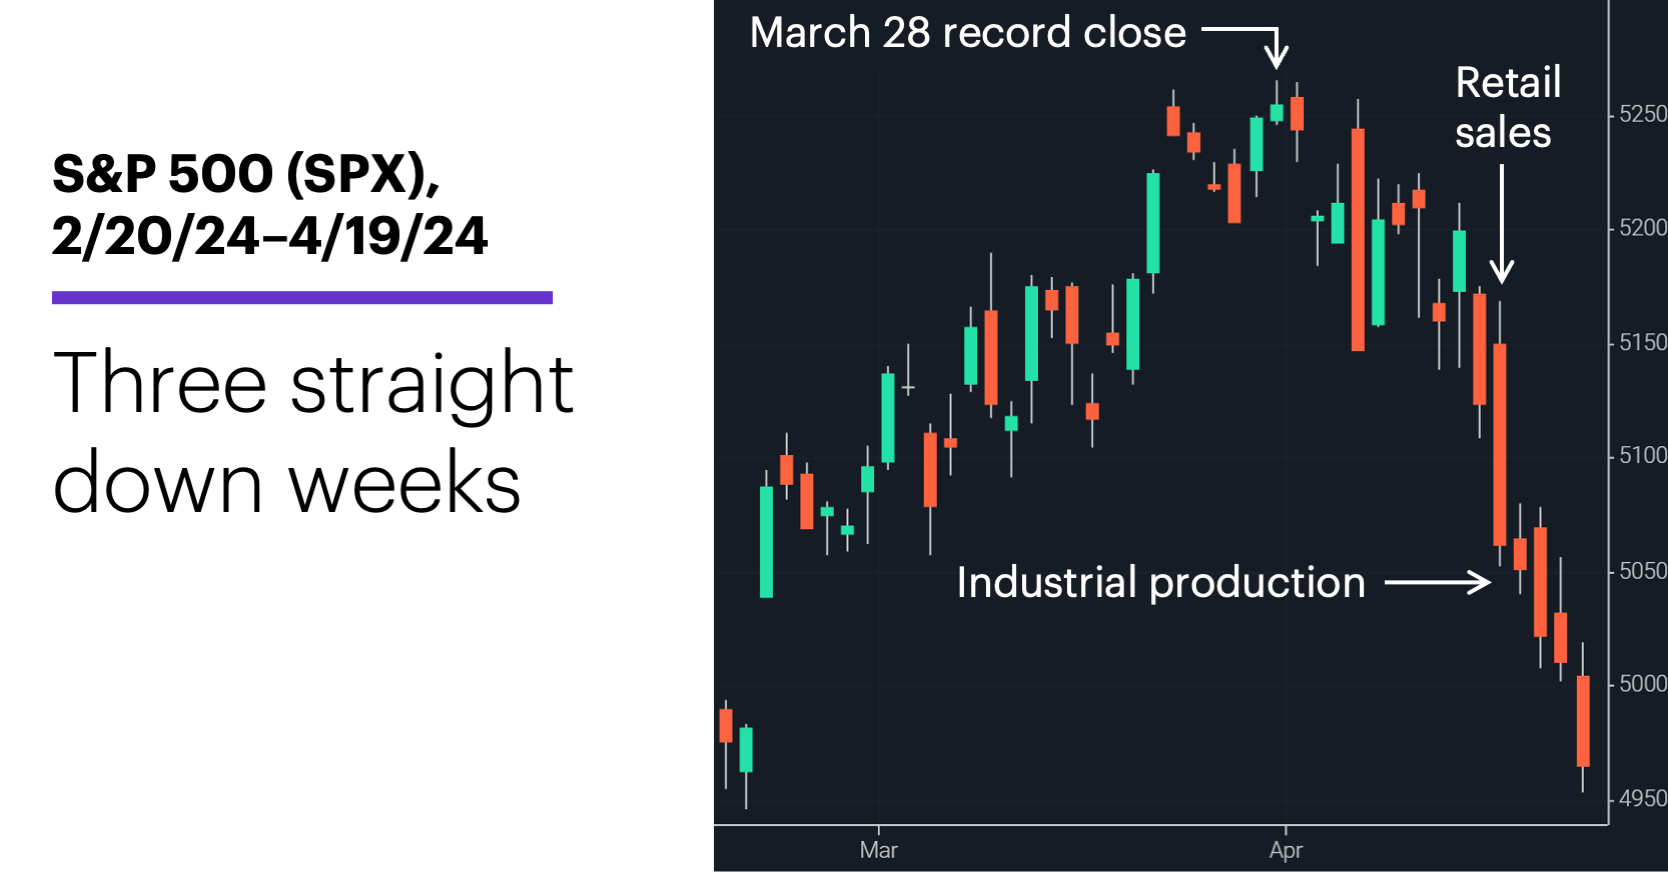
After a modest, two-week slide, the US market experienced its biggest down week of the year amid mixed performance from big banks to start earnings season, rising interest rates, and ongoing concerns about geopolitical risks and sticky inflation. The result: The S&P 500’s (SPX) first three-week downturn since September, and its longest stretch of consecutive down days (six) since October 2022:
Source: Power E*TRADE. (For illustrative purposes. Not a recommendation. Note: It is not possible to invest in an index.)
The headline: S&P 500 falls more than 5% below March 28 record close.
The fine print: Even though it was a sizable down day for the market, Friday didn’t reflect the full impact of geopolitical events on Thursday night’s trading. After reports that Israel may have launched a missile attack on Iran,1 S&P 500 futures fell as much as 1.7% (Japan’s Nikkei 225 stock index dropped 3.5%), crude oil jumped more than 4%, and gold rallied 1.7%. The moves reversed or moderated on Friday.
The numbers: There was little indication of an economic slowdown in last week’s data. March retail sales came in at 0.7% (vs. the 0.4% estimate), and February’s number was revised 50% higher. Industrial production was also stronger than expected, while weekly jobless claims were a little below forecasts. Given inflationary pressures, Morgan Stanley & Co. strategists expect the Fed will delay cutting rates until July.2
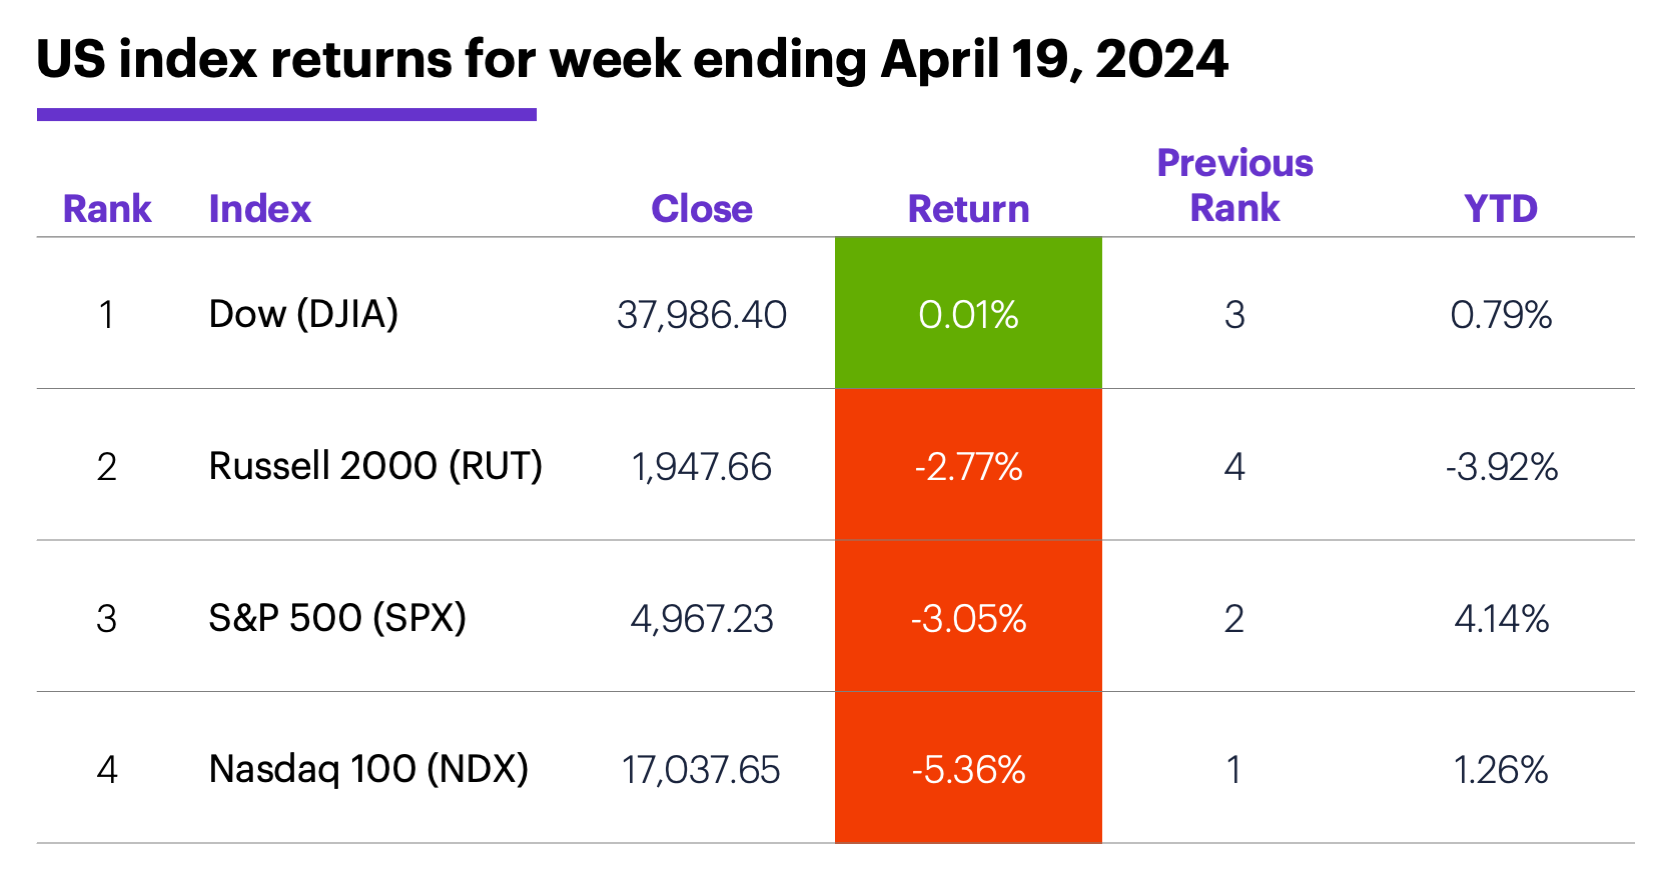
The scorecard: The Nasdaq 100 (NDX) tech index led the selling with its biggest down week since November 2022, while the Dow barely missed a beat:
Source (data): Power E*TRADE. (For illustrative purposes. Not a recommendation.)
Sector returns: The strongest S&P 500 sectors last week were utilities (+1.9%), consumer staples (+1.5%), and financials (+0.8%). The weakest sectors were information technology (-7.2%), consumer discretionary (-4.5%), and real estate (-3.6%).
Stock movers: Destiny Tech100 (DXYZ) +27% to $36.88 on Monday, Intra-Cellular Therapies (ITCI) +23% to $79.84 on Tuesday, Trump Media (DJT) +26% to $33.19 on Thursday. On the downside, Trump Media (DJT) -18% to $26.61 on Monday, Edgio (EGIO) -23% to $15.95 on Tuesday, Destiny Tech100 (DXYZ) -32% to $29.53 on Wednesday.
Futures: June gold (GCM4) closed Friday at a new record of $2,413.80. June WTI crude oil (CLM4) ended the week at $82.22, more than $4 below the previous week’s contract high. Week’s biggest gainers: July rough rice (ZRN4) +10.9%, July cocoa (CCN4) +9.4%. Week’s biggest decliners: July platinum (PLN4) -5.9%, June E-Mini Nasdaq 100 (NQM4) -5.6%.
Coming this week
It’s “Big” week earnings season—big tech, along with big oil, big pharma, big aerospace, and assorted heavy hitters from other sectors. This is just a sample:
●Monday: Albertson's (ACI), Verizon (VZ), Medpace (MEDP)
●Tuesday: Archer Daniels Midland (ADM), Freeport-McMoRan (FCX), GE Aerospace (GE), General Motors (GM), Halliburton (HAL), Kimberly-Clark (KMB), Lockheed Martin (LMT), PepsiCo (PEP), Spotify (SPOT), United Parcel Service (UPS), Enphase Energy (ENPH), Mattel (MAT), Tesla (TSLA), Texas Instruments (TXN)
●Wednesday: Boeing (BA), Biogen (BIIB), General Dynamics (GD), AT&T (T), Ford (F), International Business Machines (IBM), Lam Research (LRCX), Meta Platforms (META), ServiceNow (NOW), O’Reilly Automotive (ORLY), Viking Therapeutics (VKTX), Waste Connections (WCN)
●Thursday: American Airlines (AAL), Bristol-Myers Squibb (BMY), Caterpillar (CAT), Southwest Airlines (LUV), Merck (MRK), Newmont (NEM), Northrop Grumman (NOC), Rockwell Automation (ROK), Amazon (AMZN), Alphabet (GOOGL), Intel (INTC), Microsoft (MSFT), T-Mobile (TMUS)
●Friday: AbbVie (ABBV), AutoNation (AN), Aon (AON), Colgate Palmolive (CL), Chevron (CVX), Phillips 66 (PSX), Exxon Mobil (XOM)
The economic calendar will be closely watched, too. Traders will get a first look at Q1 GDP, along with the Fed’s preferred inflation gauge (PCE Price Index):
●Monday: Chicago Fed National Activity Index
●Tuesday: S&P Global Manufacturing and Services PMIs (flash), New Home Sales
●Wednesday: Durable Goods Orders
●Thursday: Q1 GDP (initial estimate), Trade Balance in Goods (advance), Retail and Wholesale Inventories (advance), Pending Home Sales
●Friday: Personal Income and Spending, PCE Price Index, Consumer Sentiment
Check the Active Trader Commentary each morning for an updated list of earnings announcements, IPOs, economic reports, and other market events.
Three-week pullbacks
Since 1957, the SPX has closed lower three weeks in a row (after an up week) 165 other times. It closed higher the following week 54% of the time.3 But three-week pullbacks that more closely approximate the current one—a decline of 4%-6% following a multi-week high—are a little rarer. There have been only 36 since 1957, and the SPX closed lower the next week 53% of the time, although it rebounded to close higher the next week 69% of the time.
Commodities pick up rally slack
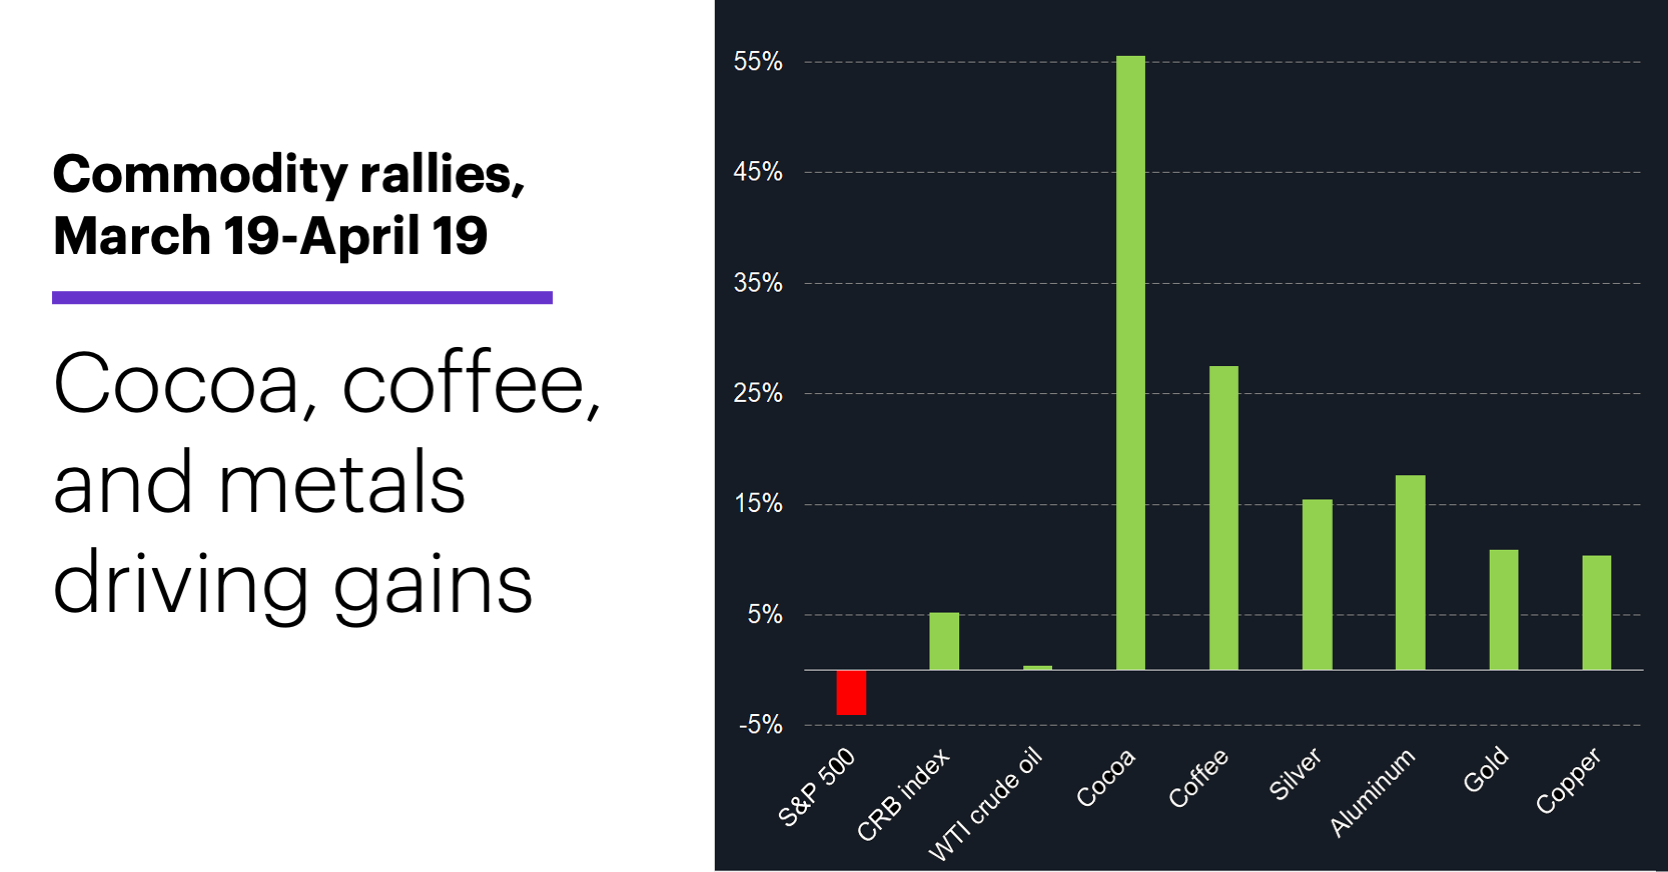
While the stock market rally has slowed in recent weeks, the story has been much different in the commodity space. Different commodity indexes have recently tested their 2023 or 2022 highs, and unlike many times in the past, this move hasn’t been driven primarily by oil prices, which are usually the biggest component of any commodity index.
Source (data): Power E*TRADE. (For illustrative purposes. Not a recommendation. Note: It is not possible to invest directly in an index.)
Over the past month, as the S&P 500 declined 4.1% and crude oil was essentially flat, the CRB Commodity Index gained more than 5%.4 Cocoa rallied more than 55%, coffee climbed more than 25%, while gold, silver, copper, and aluminum all rallied more than 10%.
Click here to log on to your account or learn more about E*TRADE's trading platforms, or follow the Company on X (Twitter), @ETRADE, for useful trading and investing insights.
1 Israel launches strike on Iran, US official says. CNN.com. 4/19/24.
2 MorganStanley.com. Election 2024: Inflation Outlook. 4/17/24.
3 All figures reflect S&P 500 (SPX) weekly closing prices, 1957-2024. Supporting document available upon request.
4 All figures represent percentage change in daily closing prices from 3/19/24-4/19/24. Gold and silver reflect spot-market prices, all other markets reflect front-month futures prices, as follows: WTI crude oil (June), aluminum (July), coffee (July), cocoa (July), copper (July). Supporting document available upon request.
Important note regarding economic sanctions. This report may reference jurisdiction(s) or person(s) that are the subject of sanctions administered or enforced by the U.S. Department of the Treasury’s Office of Foreign Assets Control (“OFAC”), the United Kingdom, the European Union and/or by other countries and multi-national bodies. Any references in this report to jurisdictions, persons (individuals or entities), debt or equity instruments, or projects that may be covered by such sanctions are strictly incidental to general coverage of the relevant economic sector as germane to its overall financial outlook, and should not be read as recommending or advising as to any investment activities in relation to such jurisdictions, persons, instruments, or projects. Users of this report are solely responsible for ensuring that their investment activities are carried out in compliance with applicable sanctions.