Understanding the Sharpe Ratio
E*TRADE from Morgan Stanley
Have you ever wondered if your investments are doing well because of your good investing decisions or because you’re taking on excess levels of risk? To answer that question, we need a method of comparing the performance of different portfolios that also accounts for their level of risk. This is what “risk-adjusted returns” are all about.
What is a Sharpe Ratio?
Probably the best-known way to measure risk-adjusted returns is the Sharpe Ratio, which was developed by the Nobel laureate economist William Sharpe. It’s calculated by determining your portfolio’s “excess return” for a given time period, then dividing that by the portfolio’s standard deviation, which is a measure of its volatility risk.
Your portfolio’s excess return is whatever amount it earned above the rate of return of a risk-free asset, usually a short-term U.S. government bond. So if the bond is paying 3% interest and your portfolio earned 5%, then your excess return is 2%.
We’ll dig into the details in the next section, but the main point to keep in mind is this: The Sharpe Ratio, in effect, divides your returns by your risk. Higher Sharpe Ratios indicate better risk-adjusted returns. (We should note that the Sharpe Ratio can be used to compare not just portfolios but also individual investments such as mutual funds and ETFs.)
Breaking down the (not too difficult) math
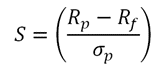
To really understand the Sharpe Ratio, you need to know its formula.
Officially, it's:
Translated into plain English, that's:
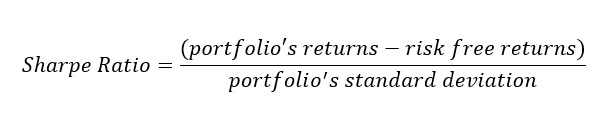
It may look a little complex, but the implications are pretty straightforward. Investors want higher excess returns (the upper half of the formula); a higher number there increases the Sharpe Ratio. But investors want to minimize risk (represented by standard deviation in the bottom half of the formula); when the risk number gets higher it reduces the Sharpe Ratio.
Putting it all together
Calculating the Sharpe Ratio for a portfolio isn’t very useful on its own; it’s really meant to help compare one portfolio (or investment) with another. The portfolio with the higher Sharpe Ratio score generally invests more efficiently for a given level of risk.
Let’s look at two examples to understand this better. First up: three portfolios with the same level of volatility risk—the standard deviation for each is 15%—but different returns. Notice how the varying returns affect the Sharpe Ratio.
Portfolio 1 generates the same returns as a hypothetical risk-free asset, but it takes on risk to do so, which is not efficient; its Sharpe Ratio is 0. Portfolios 2 and 3 achieve some excess returns, but, all else being equal, Portfolio 3 is superior—and has a higher Sharpe Ratio—because it generates higher returns without additional risk.
Let’s look at a second example where the portfolios have the same returns but different levels of volatility risk. Now the Sharpe Ratio changes as the risk changes.
In this scenario, Portfolio 1 has the highest Sharpe Ratio. It’s superior to Portfolios 2 and 3 because it achieves equal returns without taking on as much risk. As the standard deviation (risk) increases, the Sharpe Ratio scores go down.
Limitations of Sharpe Ratio
The Sharpe Ratio calculation assumes that a portfolio’s returns have what’s known in statistics as a “normal distribution”. But the stock market doesn’t always follow a normal distribution, which can lead to shortcomings in the calculation of a portfolio’s standard deviation. That, in turn, can throw off the Sharpe Ratio. This is generally less of a problem when comparing well-diversified portfolios versus portfolios with just a few stocks.
It’s also important to keep in mind that volatility risk is just one of the factors an investor should consider when managing a portfolio or evaluating potential stock, bond, ETF, or mutual fund investments.
Bottom line
It’s easy to focus on investment returns and not consider risk when analyzing your portfolio’s performance or making investment decisions. The Sharpe Ratio is a tool that may give you additional insight into the trade-offs between risk and returns. And it’s a figure you may want to look for when researching and comparing potential investments like mutual funds and ETFs.
How can E*TRADE from Morgan Stanley help?
Review your portfolio’s performance
Use our interactive charts to view your rates of return over various time periods and compare your portfolio against multiple benchmarks.
Invest with advice when you need it
Tap into professional money management with Core Portfolios. We’ll help you build a customized portfolio to help you meet your goals and then manage it to help keep you on track.