Big updates to charting on Power E*TRADE
E*TRADE from Morgan Stanley
05/01/23Interactive charts have always been a core component of the Power E*TRADE web platform—their sleek design and integrated features are one of the many reasons why Power E*TRADE was rated the #1 Web Trading Platform by stockbrokers.com. Now, we’re excited to bring you a major upgrade to Power E*TRADE charting, another important step in our drive to provide you with the most
The wide range of features and capabilities included in this update give you impressive new charting power—more chart types, more studies, more drawing tools—to help you find and seize opportunities with greater insight and control than before.
7 New Technical Studies
- Anchored VWAP: Derives the volume-weighted average price (VWAP) starting from a specified date and time. Unlike VWAP, the Anchored VWAP can be applied to both intraday and historical price data. The mean of the high, low, and close price is the default price used to derive Anchored VWAP.
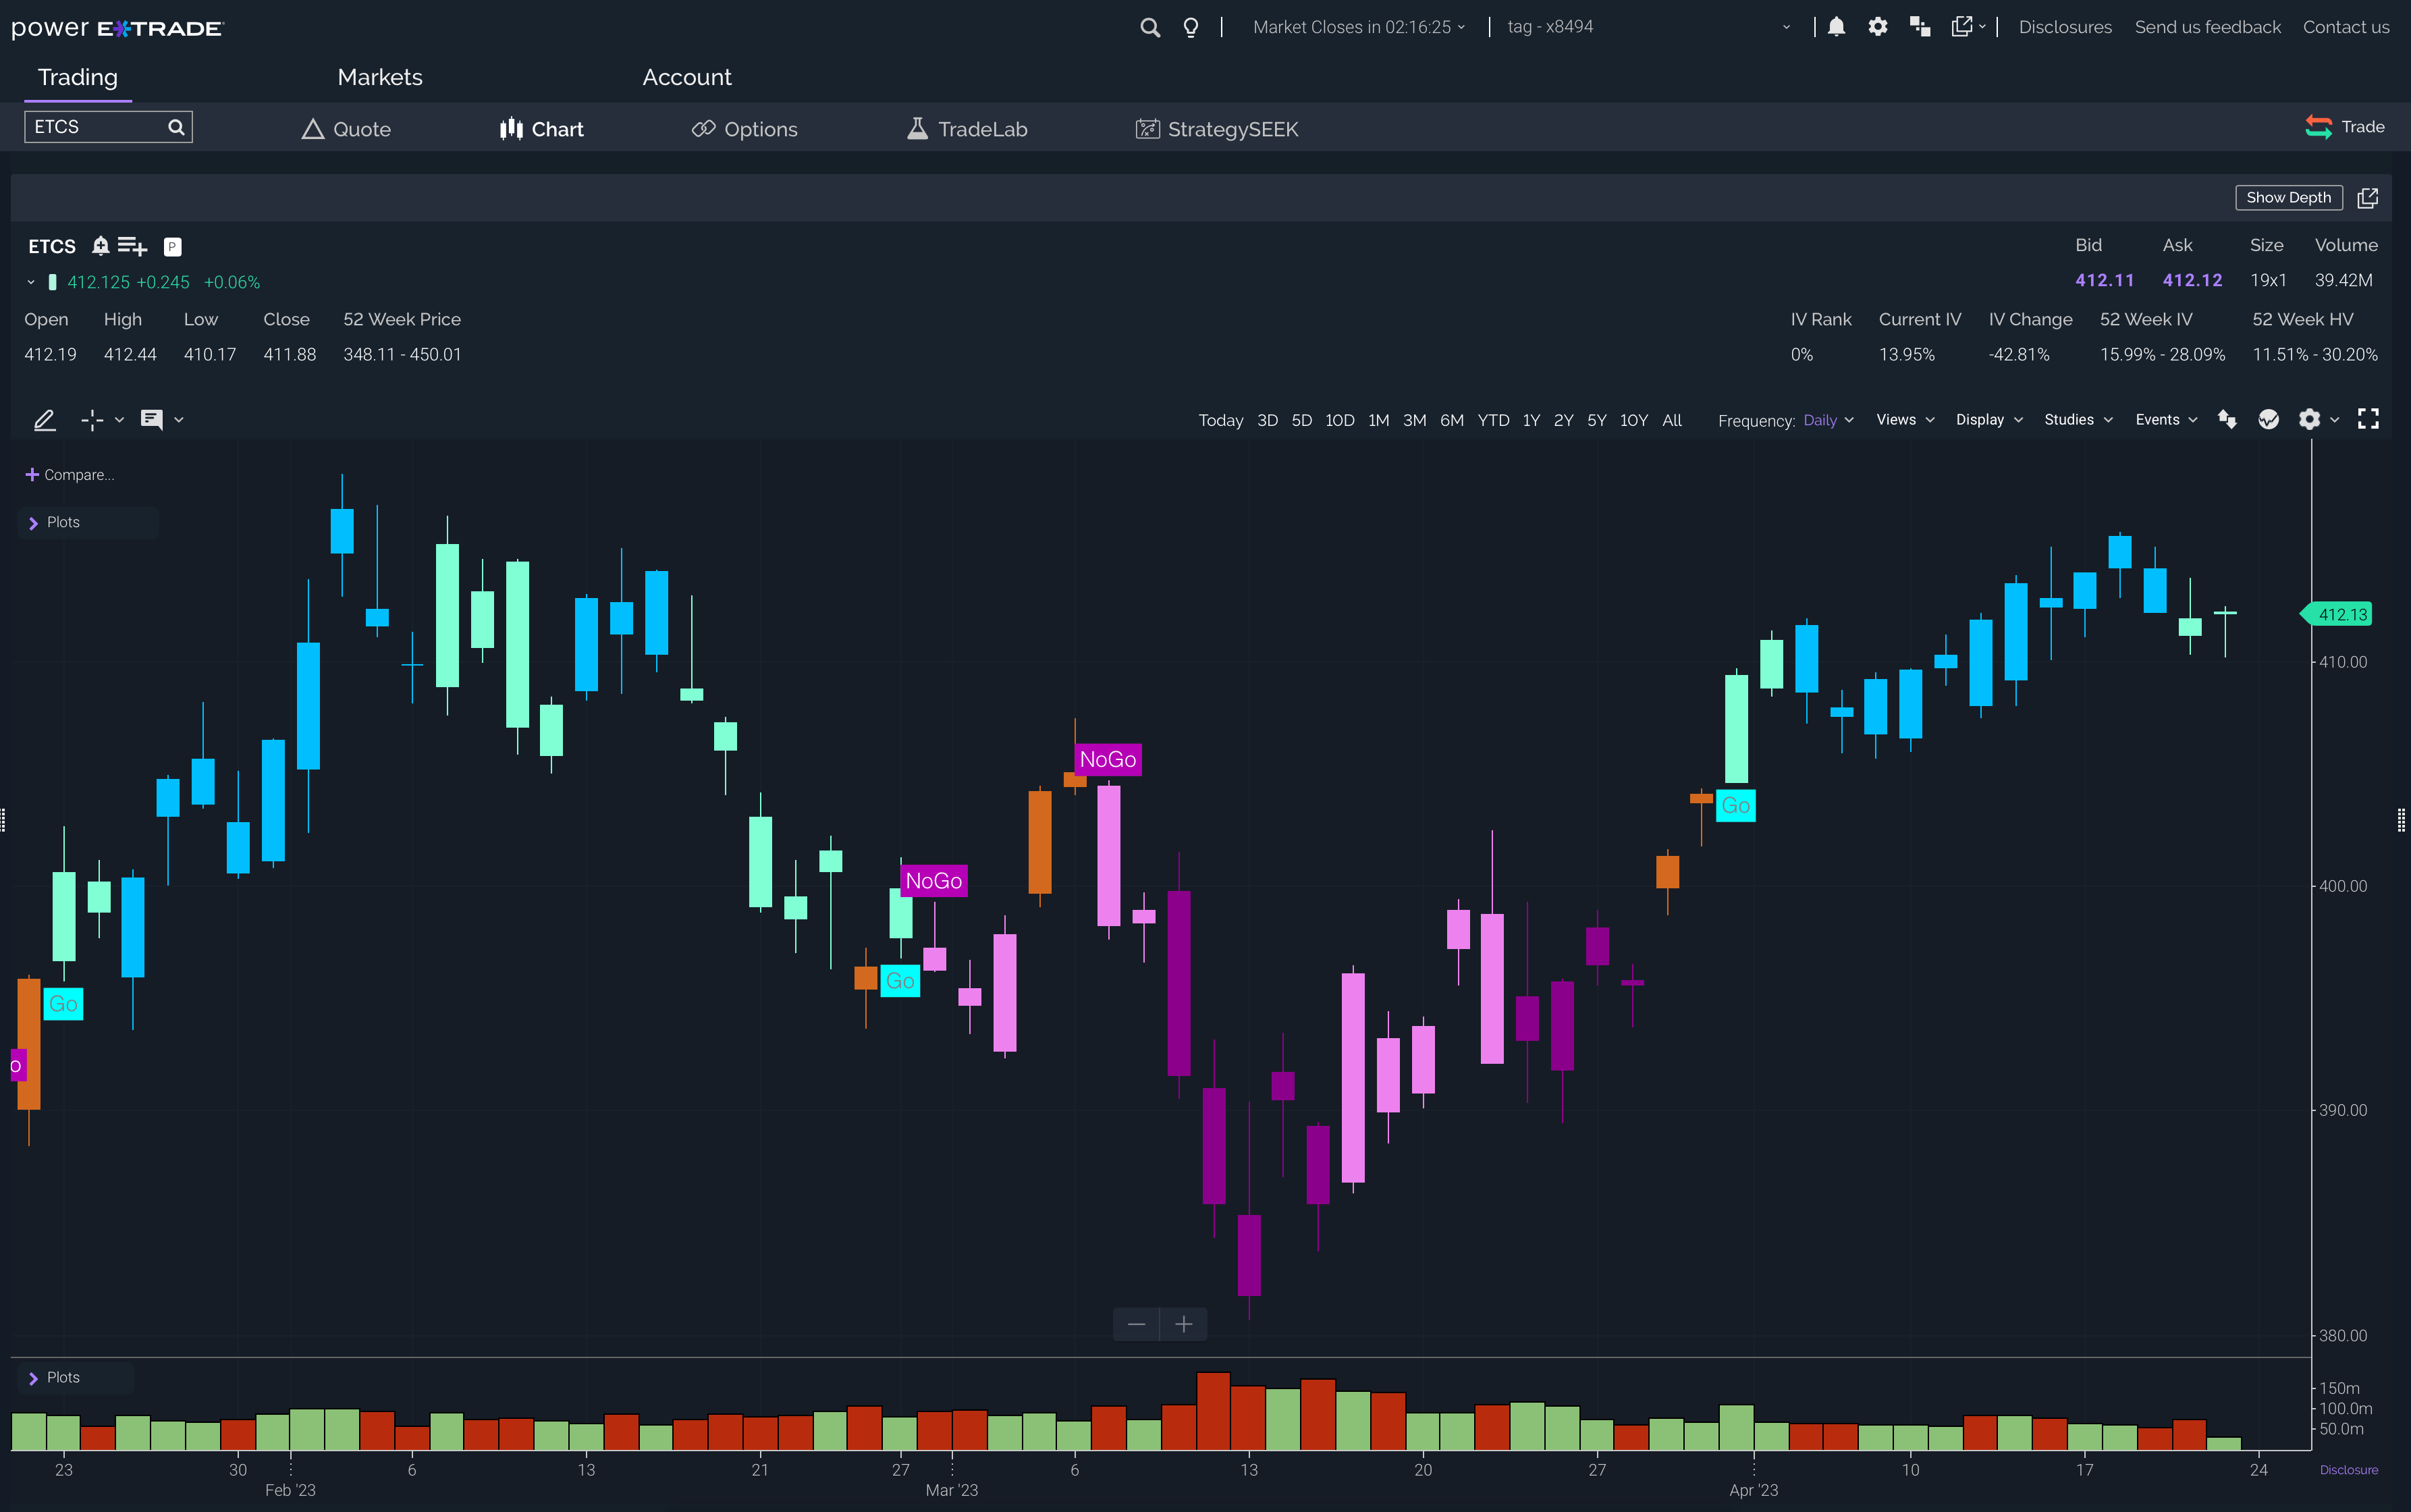
- GoNoGo - Trend: Colors the price action of any security according to the strength of its trend, making it simple to identify and interpret the current trend.
- Guppy Multiple Moving Average (GMMA): Combines a group of six short-term exponential moving averages (EMAs) and a group of six long-term EMAs, providing a “weight of the evidence” approach to identify changing trends, breakouts, and trading opportunities in the price of an asset.
- Moving Average Cross: Applies three moving averages of the same type to signal changes in trend as the shorter moving averages cross the longer ones.
- Projected Aggregate Volume (PAV): Aggregates the day’s trading volume up to the current time along with a projection of the aggregate volume for the remainder of the trading day. Reveals whether the trend in trading volume is above or below average and provides a forecast of volume for the rest of the day.
- Projected Volume at Time (PVAT): Average of intraday trading volume for each given time segment. Highlights whether today’s volume for any particular segment is above or below average and projects the volume for each time segment for the remainder of the day.
- Valuation Lines: Average of all the data points displayed on the chart. The value will change as the data on the chart is panned left/right or expanded or compressed.
6 New Display Types
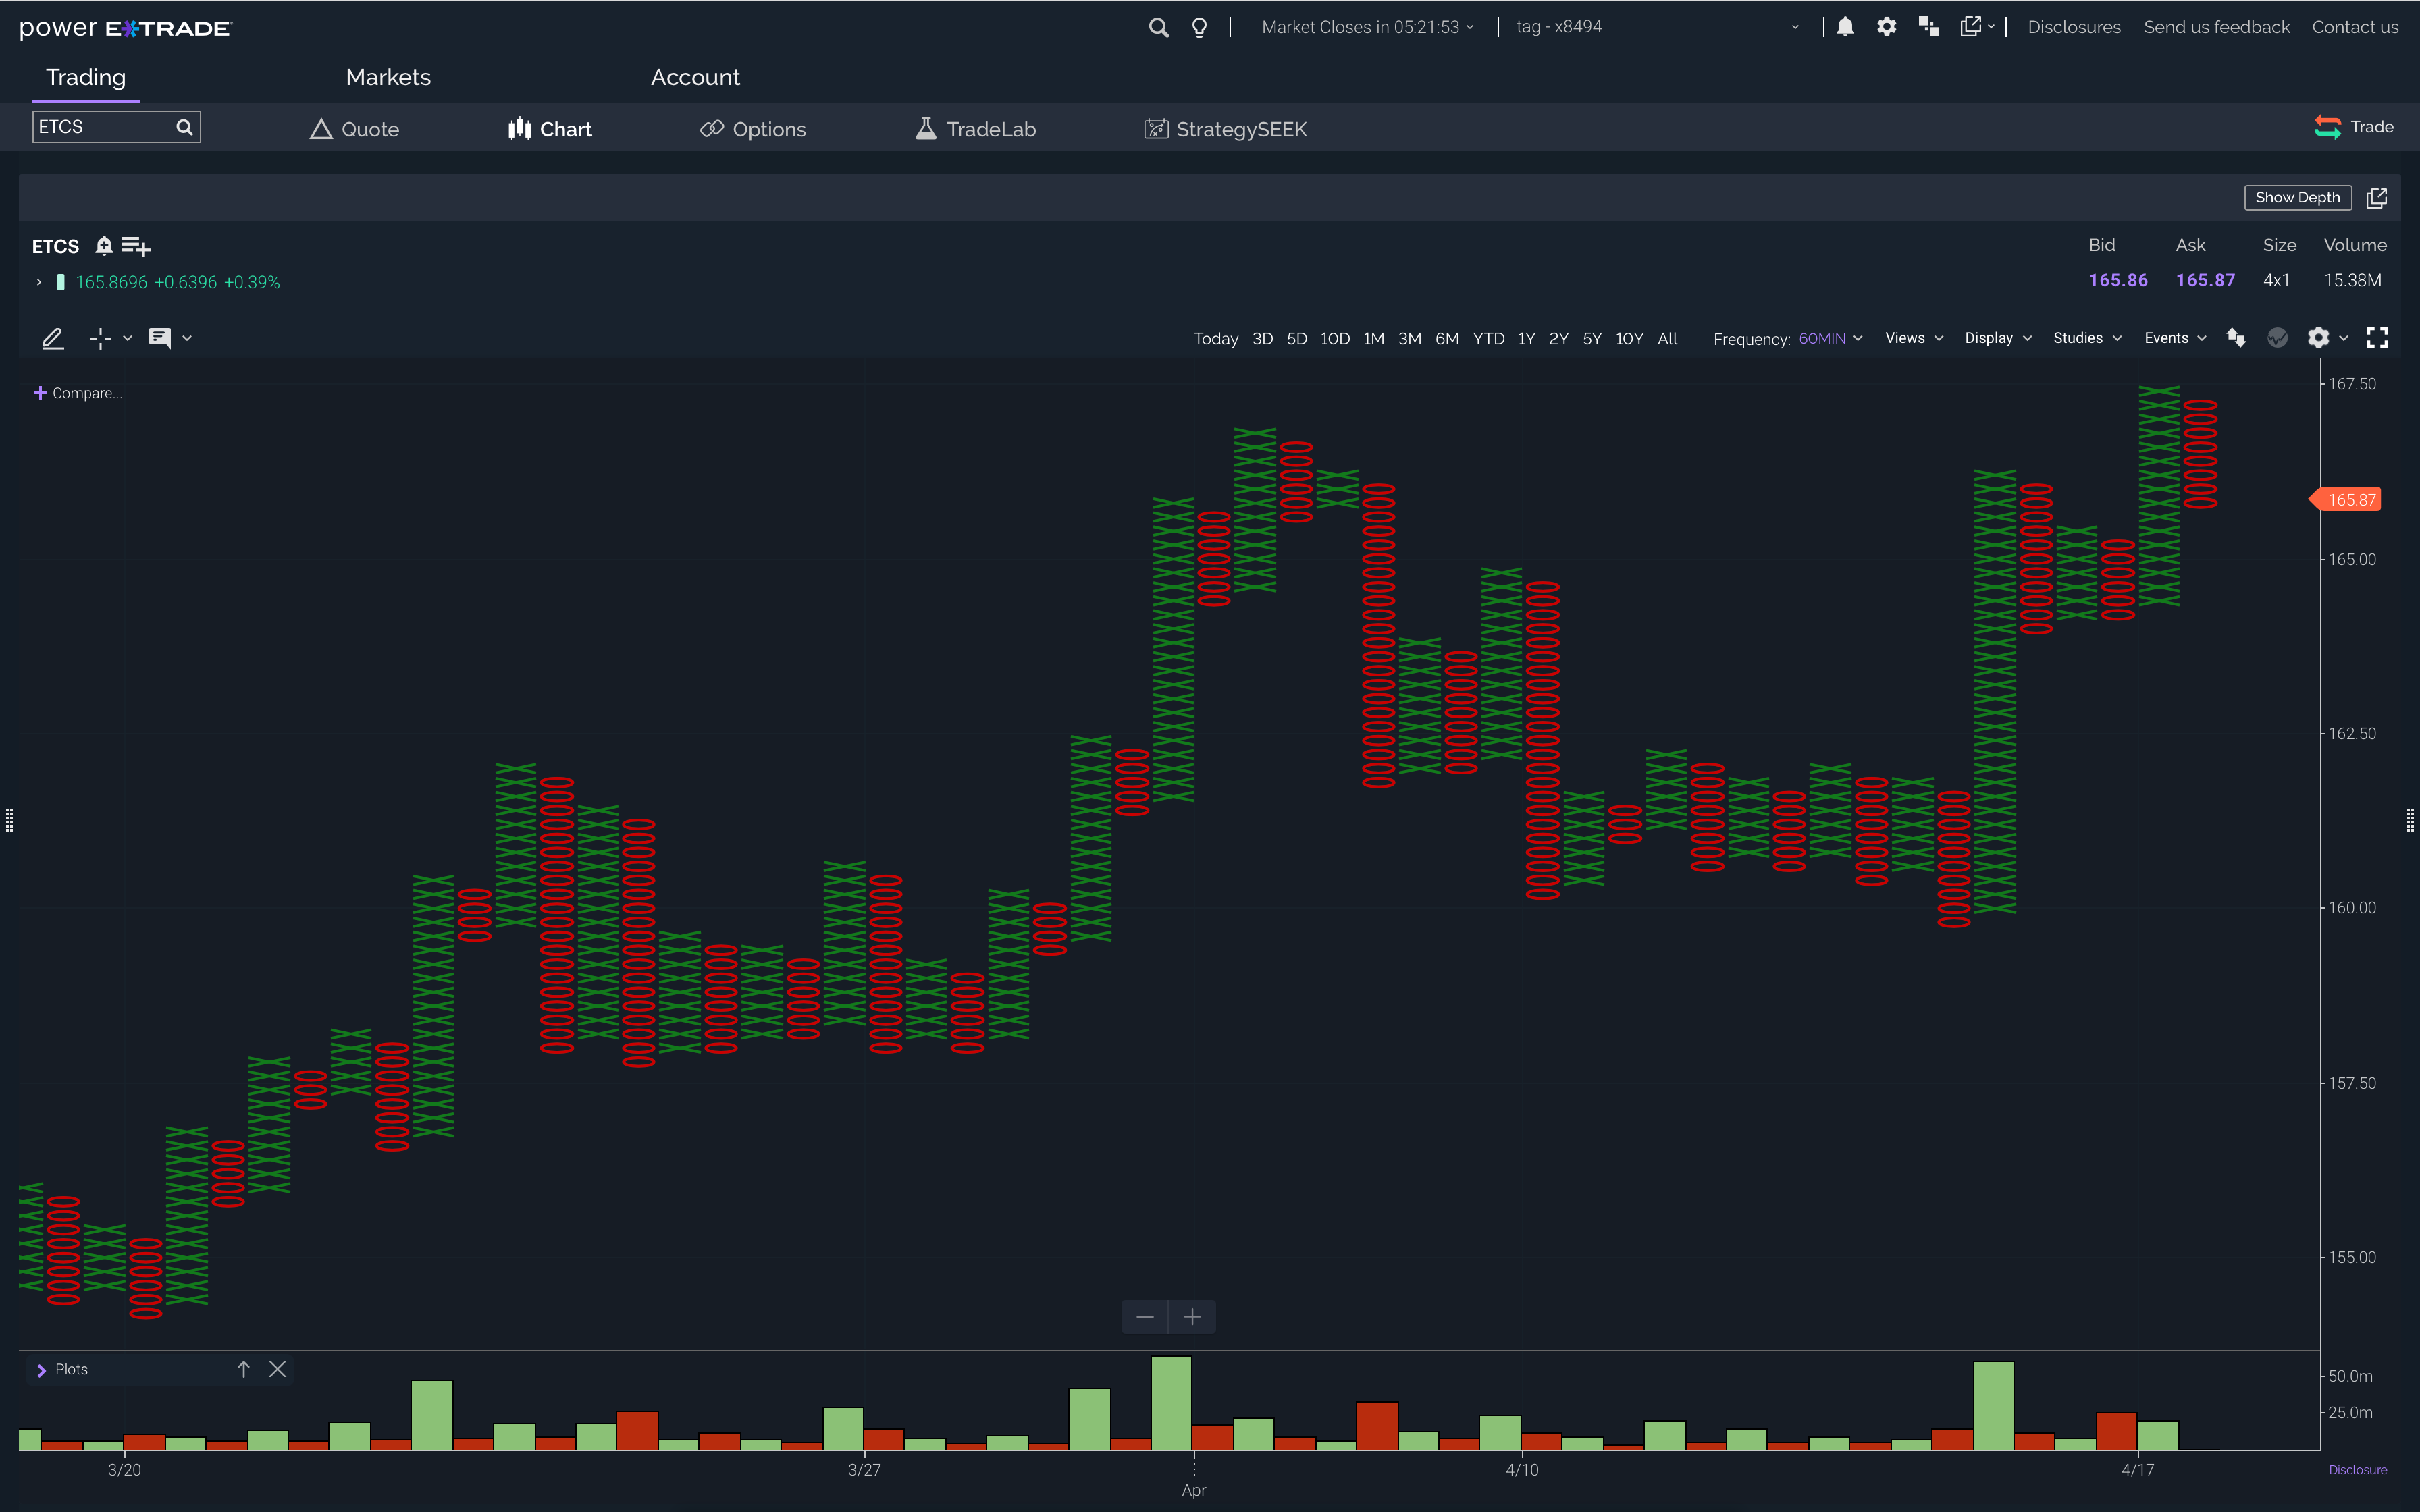
- Point & Figure: Appear as alternating columns of Xs and Os, independent of time and determined only by price action. The X columns indicate upward price action and are colored green. The O columns indicate downward price action, and are colored red.
- Kagi: Vertical bars connected by small horizontal segments at right angles, independent of time and progress forward based on price action. Thick green bars indicate that a price has broken-out above the previous high price. Thin red bars indicate that the price has fallen below the previous low.
- Line Break: Vertical bars that ascend and descend, independent of time and determined only by price action. Ascending bars are colored green and indicate upward price action. Descending bars are colored red and indicate downward price action.
- Renko: A sequence of uniformly sized bars (referred to as ‘bricks’) that connect at their corners, independent of time and determined only by price action. Ascending bricks are colored green, and descending bricks are colored red.
- Range Bars: A sequence of uniformly sized bars that connect at their corners and sometimes sit adjacent to one another, independent of time and determined only by price action. Ascending bars are colored green, and descending bars are colored red.
- Volume Candle: A hollow candle chart where the width of a candle varies to indicate volume. Each candle’s shading and fill follow the same conventions as those in hollow candle charts. Wide candles indicate high volume, while narrow candles indicate low volume.
6 New Drawings
- Fibonacci Retracement: Displays Fibonacci retracement lines between two points—horizontal lines that indicate where support and resistance are likely to occur. Can be drawn between any two significant price points, such as a high and a low, and will then create the levels between those two points.
- Text (Annotation & Call Out): Displays text directly on the chart or in a comment bubble
- Average Line: Displays an average line within selected points
- Quadrant Line: Displays a box that divides the high-low range into four equal sections. The top line marks the high, the bottom line marks the low, and the middle line marks the midpoint. When the price moves close to one of the lines, it signals the trend may be preparing to change direction.
- Tirone Levels: Displays a box divided into three equal horizontal sections that help identify support and resistance levels in a security's price.
- Volume Profile: Displays a rotated histogram representing the volume that took place at the various price points.
Easy-To-Use Tools Made Easier
- New Study Library search bar and Categories menu let you find the study you need with ease; you can even favorite the ones you use most often.
- New built-in education for all existing and new studies provides descriptions of each study and how it’s used, so you can act more quickly.
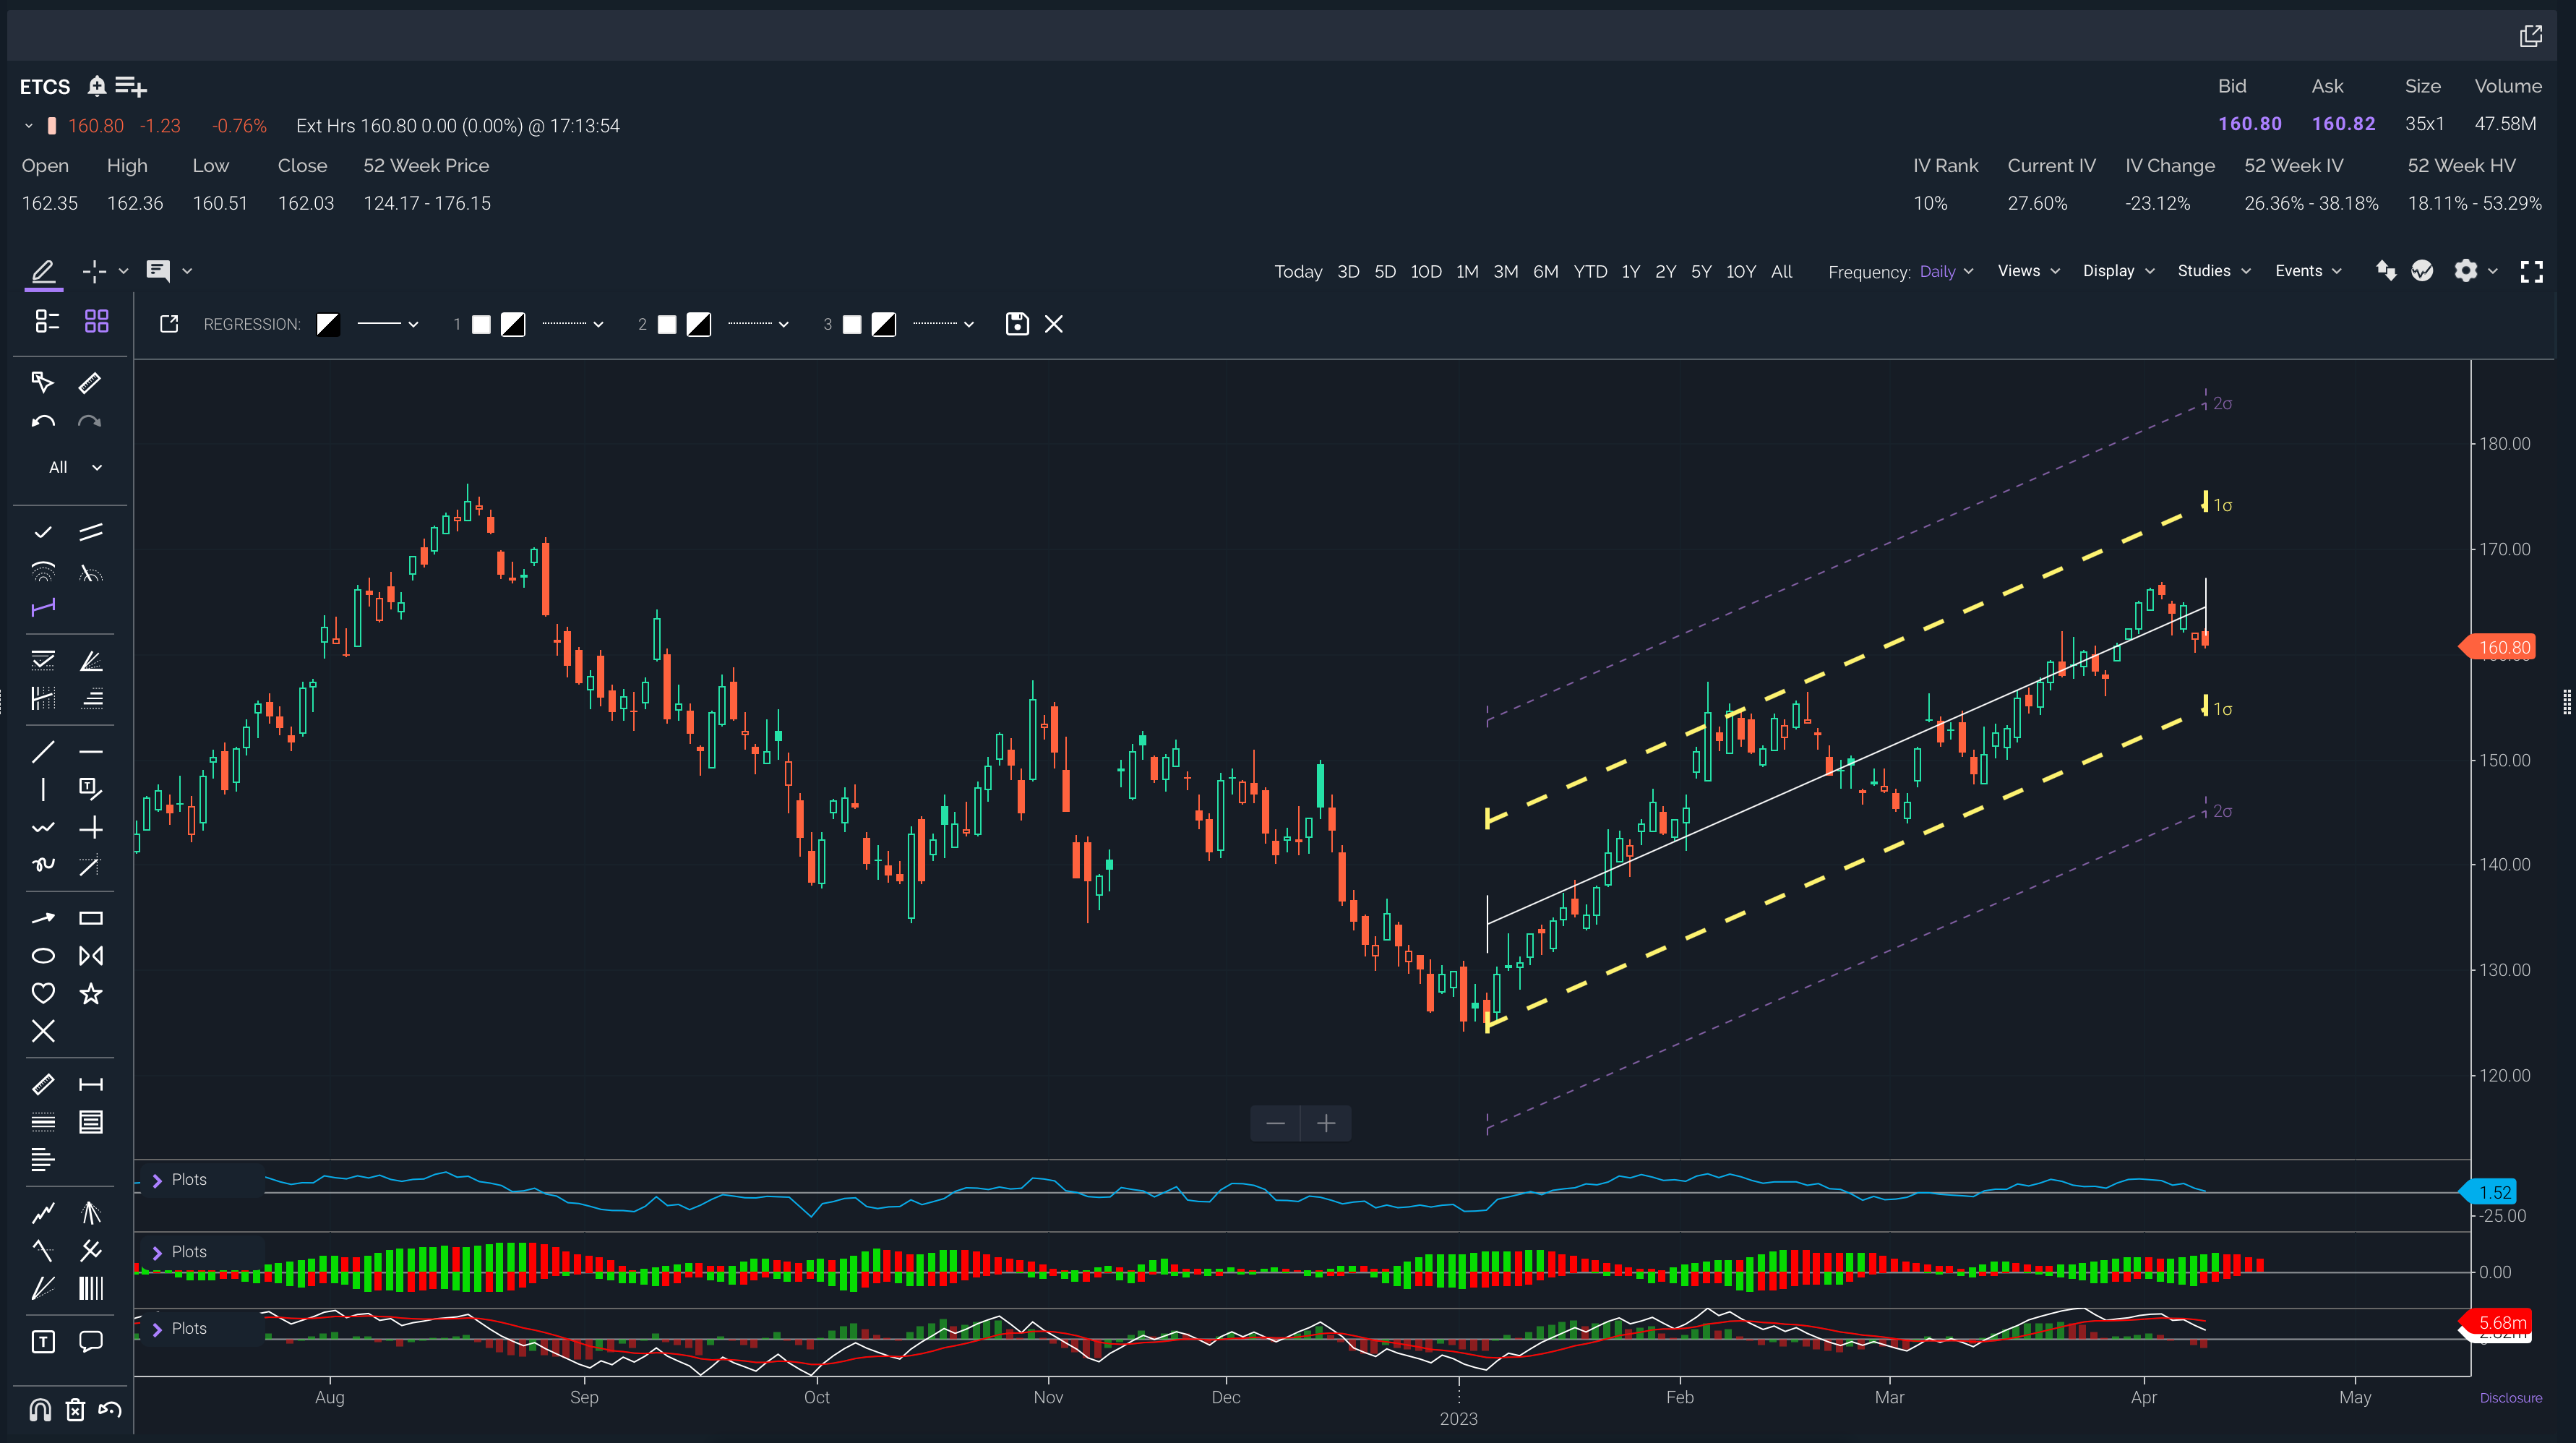
- New visual drawing palette menu puts all the drawing tools you need front and center. Plus you can customize the drawings and studies by overlaying and adding different colors to help you emphasize different time periods.
Enhancements to Key Features
- Additional settings for the Y-axis including, Log Scale, Inverse, and Left alignment.
- Improved Events information layout for earnings, dividends, and splits.
- Range selector to easily set your chart to view a specific date range.
As you can see, this update includes not only multiple new tools and features you might want to try but also a range of enhancements to tools you may already rely on. We hope you can use them to make your trading even more effective and successful.