Breakouts and volatility
- RTX is in a nearly one-month trading range
- Options volatility at 52-week low
- Stock up more than 45% since mid-October
Many traders and investors would probably say they don’t like volatility, even though, more often than not, it’s essential to making a profit. After all, a market that doesn’t go anywhere won’t make anyone money. Bulls need prices to rise, and bears need them to fall.
That said, identifying low-volatility stocks is one way some traders attempt to find stocks with the potential for high volatility later—i.e., breakout candidates.
For example, aerospace and defense company RTX (RTX) appeared on Thursday’s LiveAction scan for 52-week low implied volatility (IV):
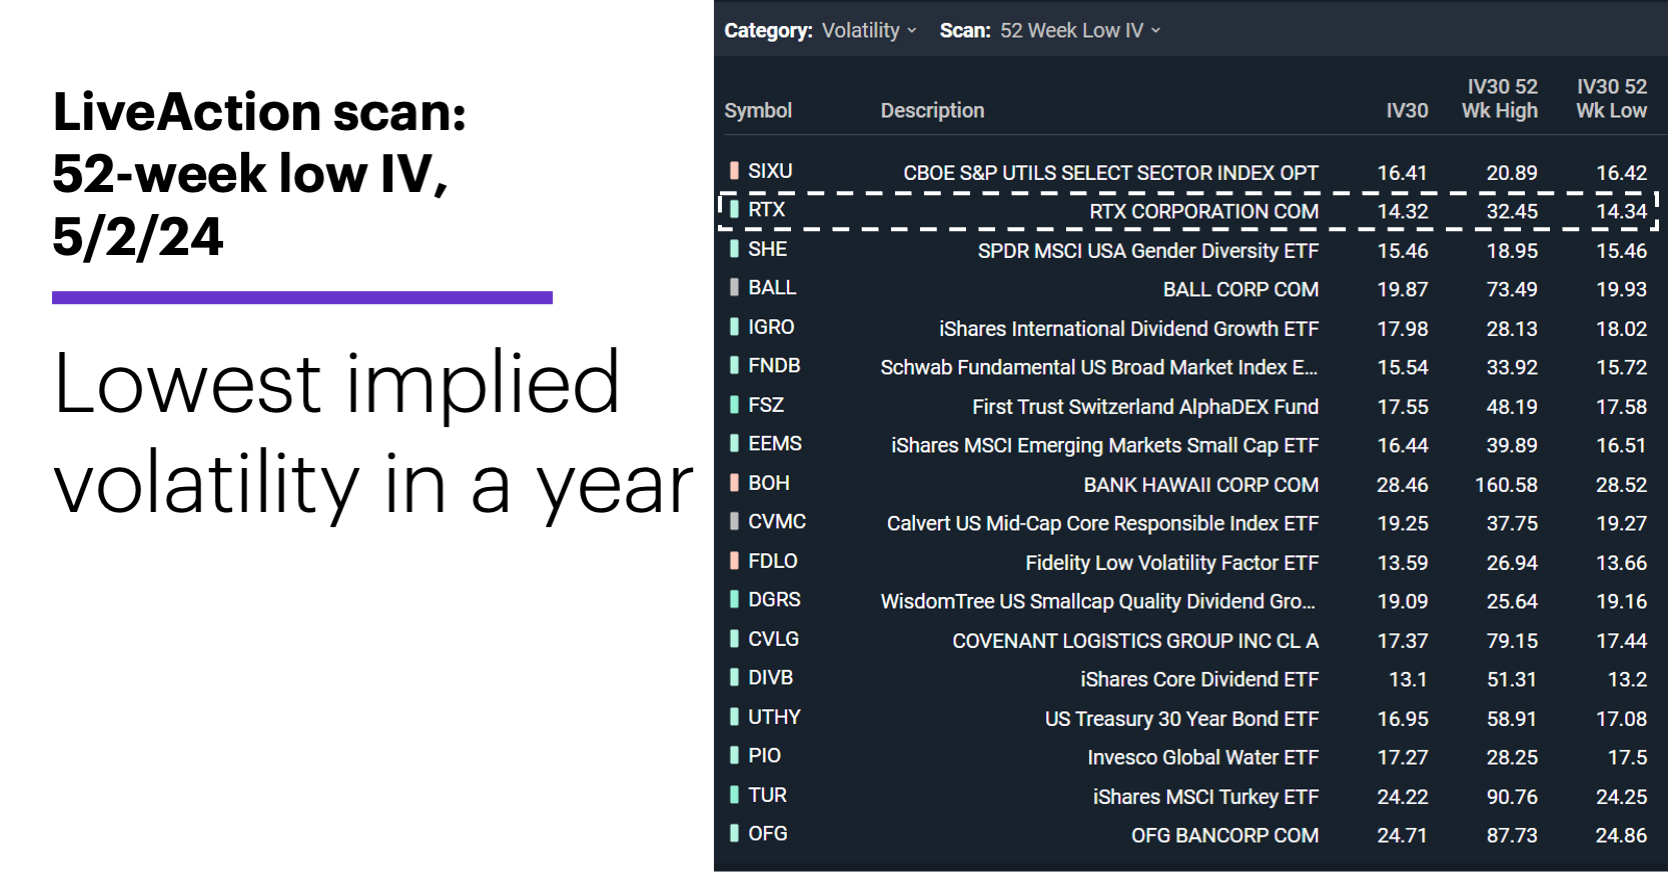
Source: Power E*TRADE (For illustration purposes. Not a recommendation.)
The shorthand message here is that the options market expects less volatility in RTX over the next 30 days than it has at any point over the past year. Setting aside for a moment the possibility that the options market may simply be wrong, one possible takeaway is that RTX options may be relatively inexpensive—since, all else being equal, high IV can inflate options premiums while low IV can have the opposite effect. If traders don’t expect a stock to move much, they’ll price its options accordingly.
One reason traders may expect low volatility is that they’re extrapolating the recent past into the near future in the case of a stock that hasn’t done much lately. That has certainly been the case for RTX, which has been moving sideways for nearly a month. Not even its April 23 earnings release managed to trigger a closing price outside the roughly $2.80 high-low range shares have been in since early April:
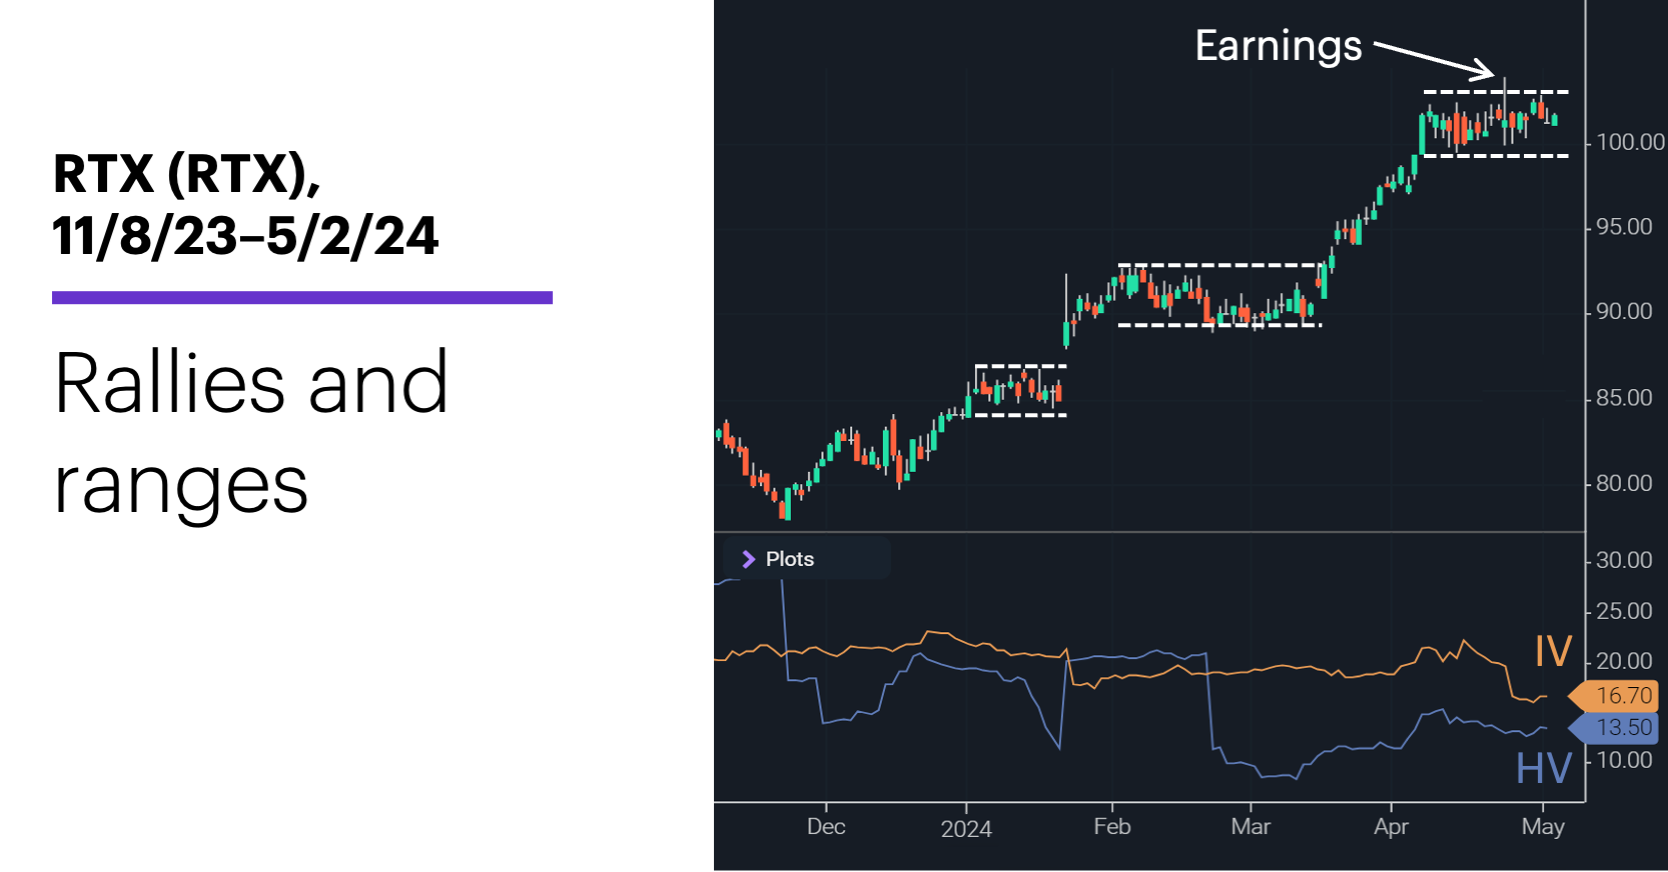
Source: Power E*TRADE (For illustration purposes. Not a recommendation.)
The fact that RTX released earnings a little more than a week ago is another reason IV hit a 52-week low, since that element of uncertainty was removed from the market. RTX’s historical volatility (HV) is relatively low, too, although it’s above its levels from early March.
Does that mean the stock is destined to move sideways indefinitely? The chart also shows that RTX has broken out of a couple of other ranges—one longer than the current one, the other shorter—over the past several months. The stock is roughly 30% above its November pullback lows around $78, and more than 45% above its mid-October lows.
Just as it’s impossible to know when a trend will end, it’s impossible to know when a stock will break out of a consolidation—or which direction it will take if it does. That uncertainty is unavoidable in the markets. But identifying stocks with low volatility may help traders find potential breakout candidates, including those that may have reasonably priced options.
Today’s numbers include (all times ET): Employment Report (8:30 a.m.), S&P Global Services PMI (9:45 a.m.), ISM Services Index (10 a.m.).
Today’s earnings include: Cboe Global Markets (CBOE), Hershey (HSY), XPO (XPO).
Click here to log on to your account or learn more about E*TRADE's trading platforms, or follow the Company on Twitter, @ETRADE, for useful trading and investing insights.