Market Dashboard
New every Monday with last week’s recap and notes on the week ahead.
Last update: 5/20/2024
US equities: Stocks reached new all-time highs last week.
- Cooler-than-expected inflation and economic data revived investors’ hopes for a “soft landing.”
- The S&P 500 Index increased 1.54%.
- The Nasdaq Composite Index advanced 2.11%.
- The Dow Jones Industrial Average rose 1.24%, finishing above 40,000 for the first time.
- The small-cap Russell 2000 Index was up 1.74%.
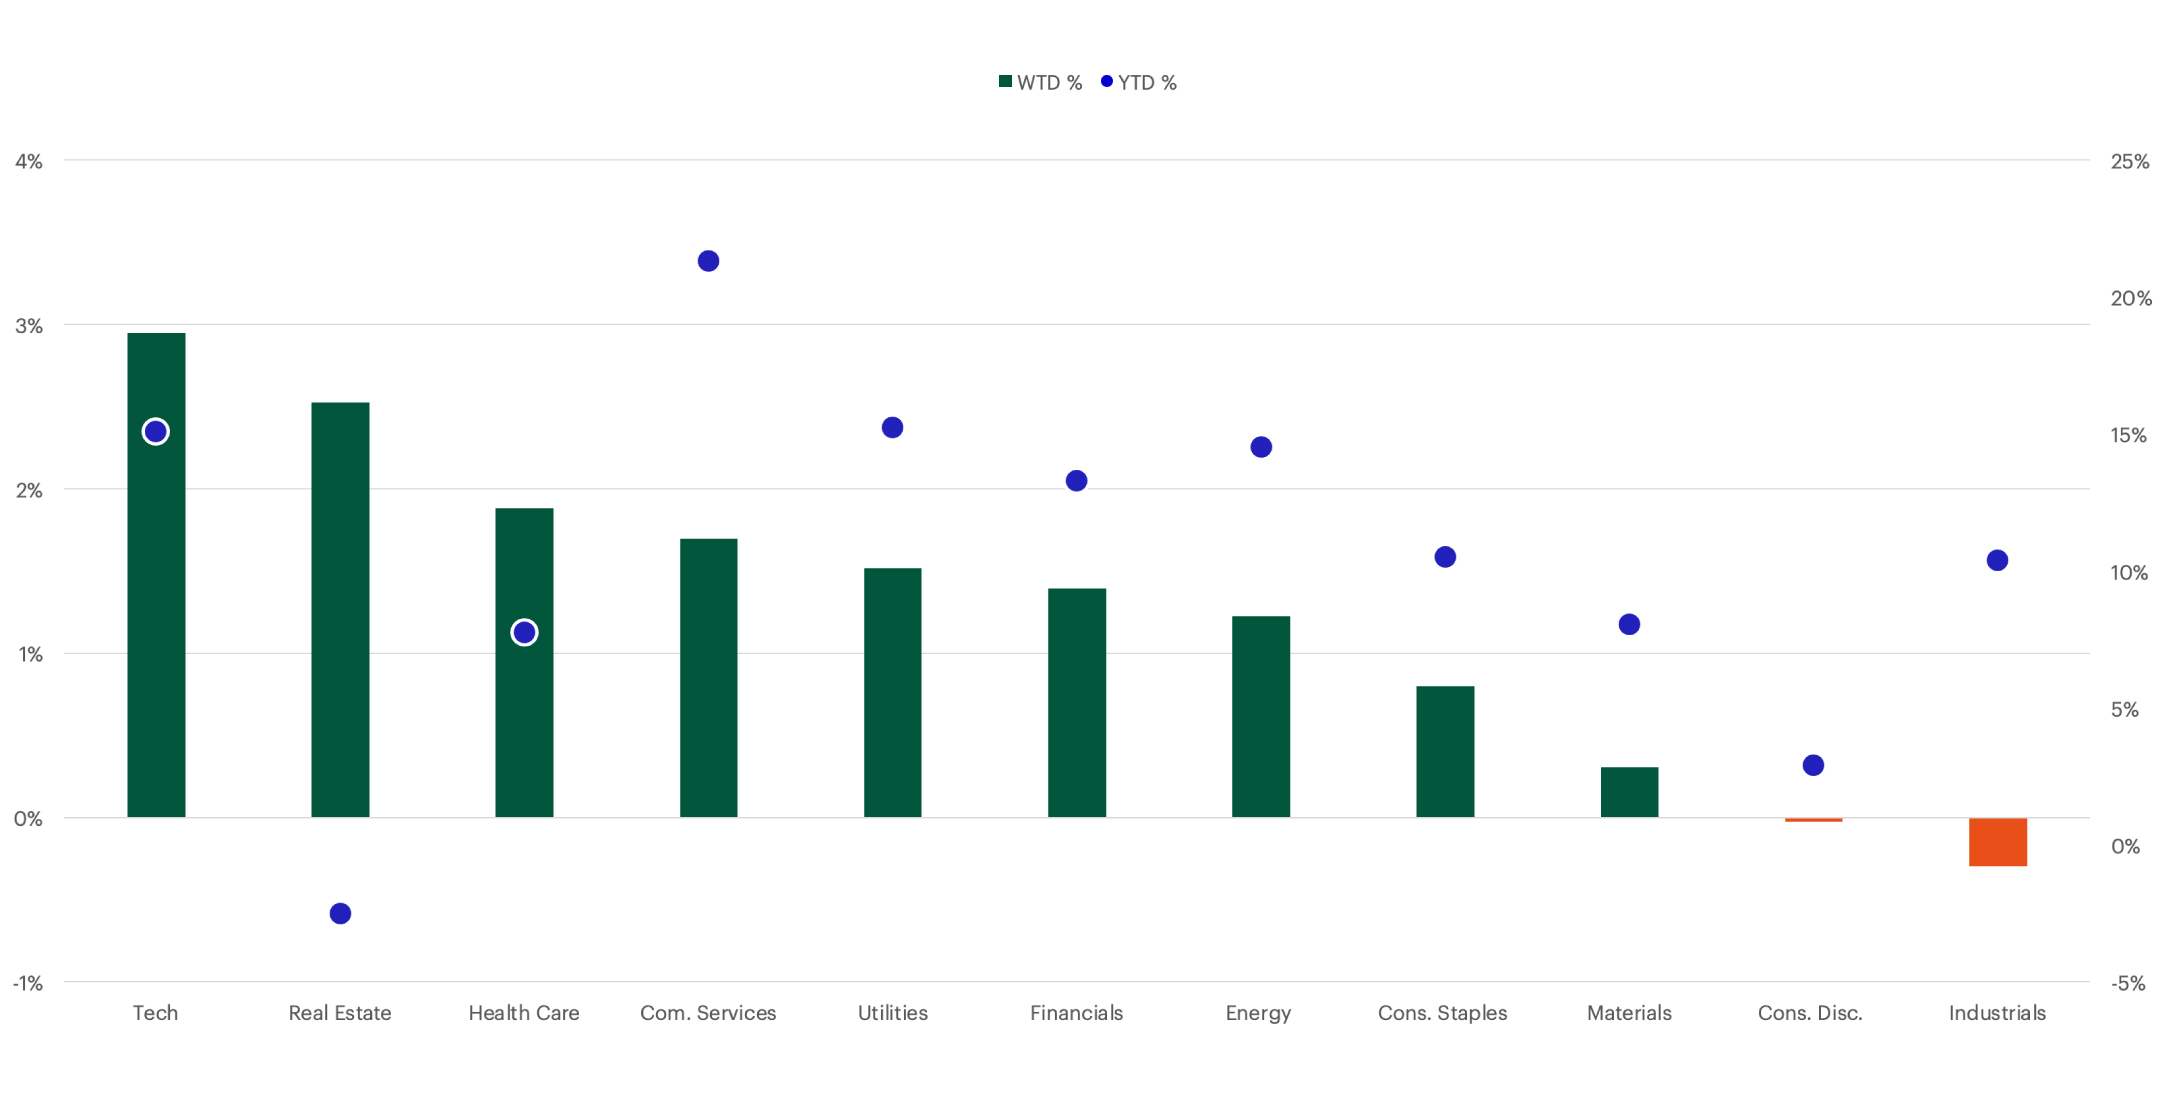
- Technology and Real Estate were the best performing S&P 500 sectors, while Consumer Discretionary and Industrials performed worst.
- The CBOE Volatility Index (VIX), known as the stock market’s “fear gauge,” closed at 11.99 this past Friday, its lowest level since January 2020.
Inflation: Price pressures showed signs of easing.
- The consumer price index (CPI) rose 0.3% on a monthly basis in April, according to data released last week. That’s down from a 0.4% month-over-month advance in March and below consensus estimates for a 0.4% rise for April.
- “Core” CPI, which excludes food and energy prices, also suggested cooling inflation, rising 0.3% month-over-month in April, down from a 0.4% rise in March.
- The market appeared to look through a sign of sticky inflation in “super-core” CPI, which excludes food, energy, and housing prices. That inflation gauge ticked up for the sixth straight month in April, to 4.9% year-over-year.
US fixed income: Cooling inflation data sent bond yields lower.
- The 10-year Treasury yield declined 8 basis points to 4.42%.
- The two-year Treasury yield fell 4 basis points to 4.82%.
- After forecasting as few as just one interest-rate cut by the Federal Reserve this year, the fed funds futures market is now pricing in more than two cuts by January 2025.
Key data: Weaker economic readings boosted markets.
- Softening economic data supported the narrative among investors that bad news for the economy is good news for markets.
- US retail sales were weaker than expected, coming in flat for April versus analysts’ expectations of 0.4% growth month-over-month.
- Additionally, downward revisions to retail-sales data for the prior two months hinted at a weakening consumer.
- Initial jobless claims moderated from the prior week’s spike but were still higher than expected, at 222,000.
- Continuing jobless claims also exceeded expectations last week, at 1.794 million.
- Industrial production was flat in April, down from a 0.4% rise in March.
- The Empire State Manufacturing Index dropped to -15.6 in April, lower than the level of -10.0 that analysts expected.
- The National Association of Home Builders (NAHB) housing market index fell into contractionary territory, at 45, lower than the 50 level analysts expected.
Commodities: Record highs for copper and gold.
- Copper (up 8.4%) and gold (up 1.8%) both set new record highs last week.
- WTI crude oil was also higher, up 1.7%.
Corporate earnings: First-quarter (Q1) earnings beat expectations.
- Of the 93% of S&P 500 companies that had reported Q1 earnings as of Friday, May 17:
- 78% had beaten consensus earnings-per-share (EPS) expectations.
- Only 60% had surpassed consensus sales expectations.
- In aggregate, companies are reporting earnings that are 7.5% above consensus expectations, better than the 6.4% one-year average “positive surprise” rate, but below the five-year average of 8.5%.
- Among the S&P 500 companies that reported earnings last week, Walmart was a notable name, rising 6.9% after a solid earnings report helped to ease some investor concerns about the health of US consumers.
- Additional retailers are set to report this week, including Target and TJX Companies. Nvidia reports on Wednesday.
Cross-Asset Performance Table
Returns and prices of the most popular indices and assets as of 5/17/24
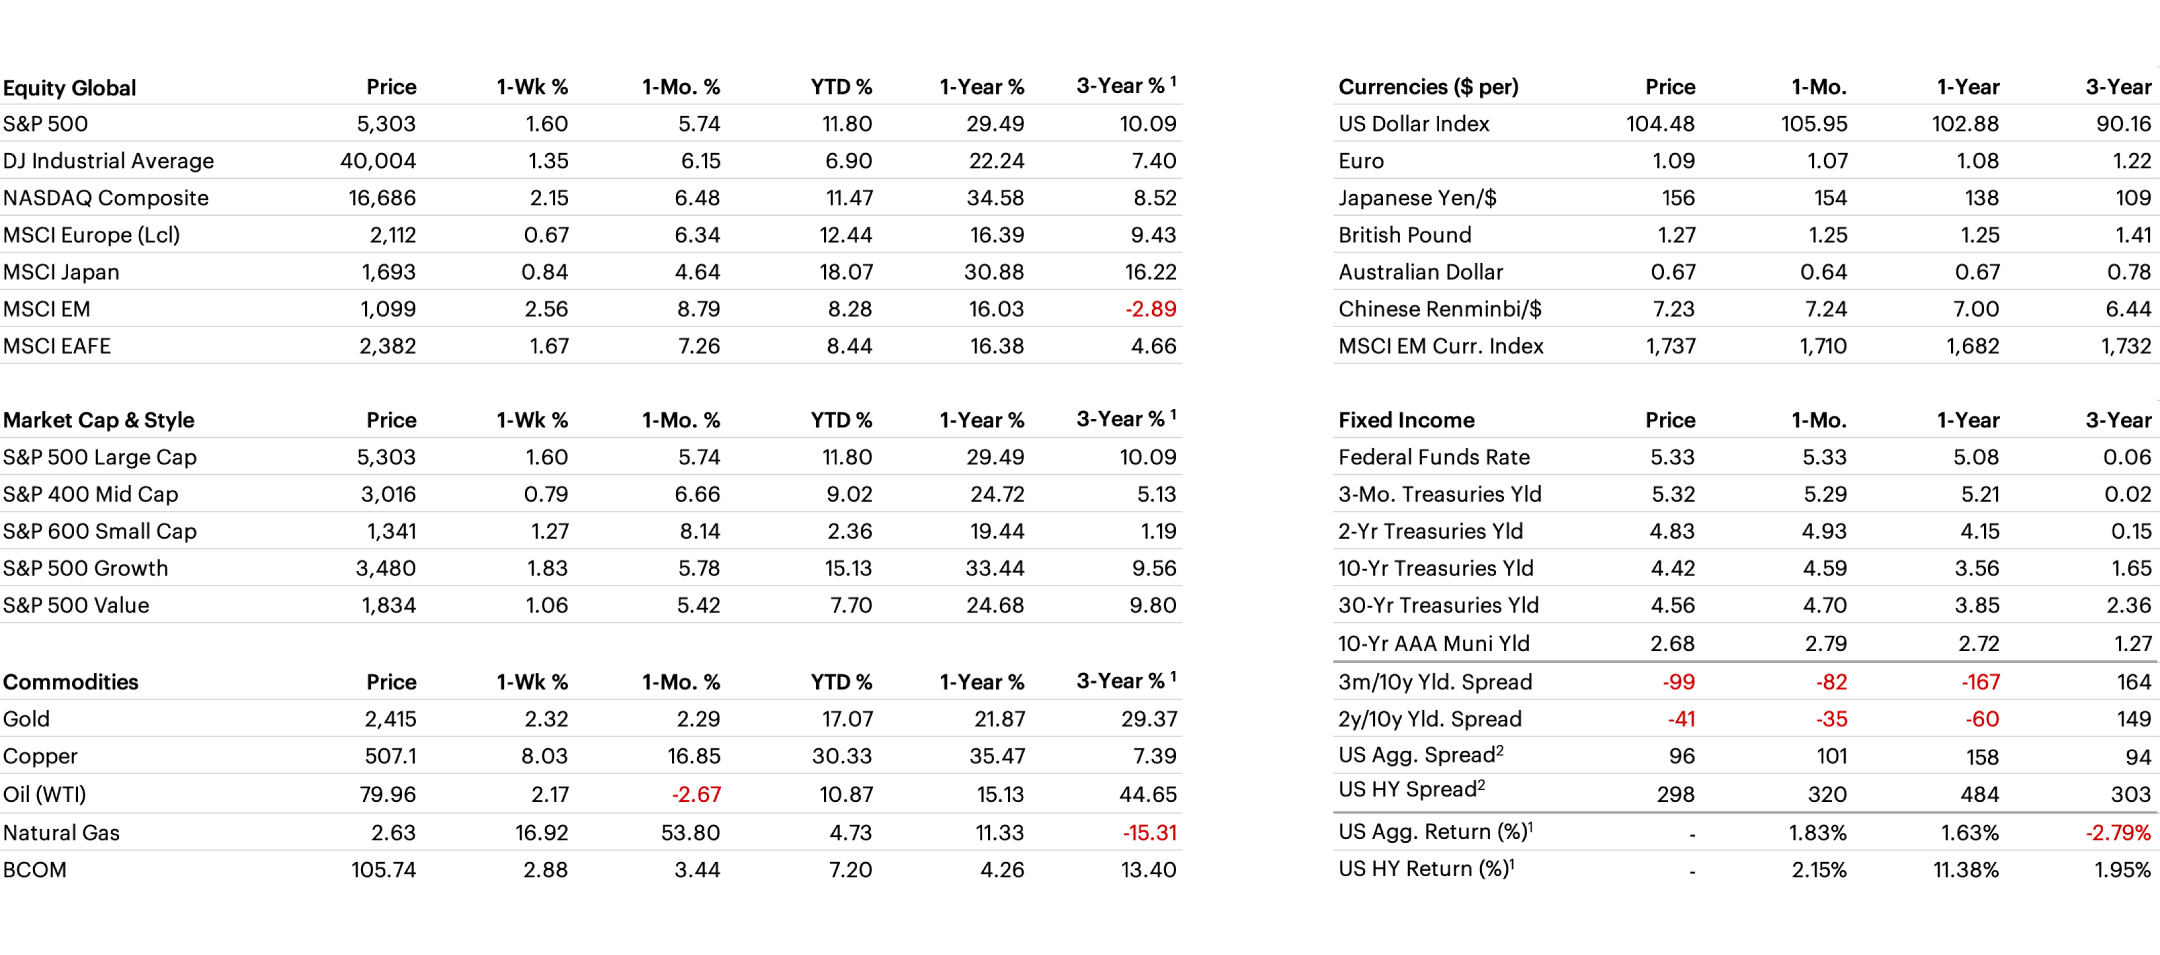
1) Annualized 3-year % return. 2) Option Adjusted Spread (OAS): OAS is a measurement of the spread of a fixed income security rate and the risk-free rate of return, which is adjusted to take into account an embedded option. Equity risk premium is the excess return that an individual stock or the overall stock market provides over a risk-free rate. The risk-free rate represents the interest an investor would expect from an absolutely risk-free investment over a specified period of time.
S&P 500 Sector Performance
Technology and Real Estate were the best performing S&P 500 sectors last week, while Consumer Discretionary and Industrials performed worst
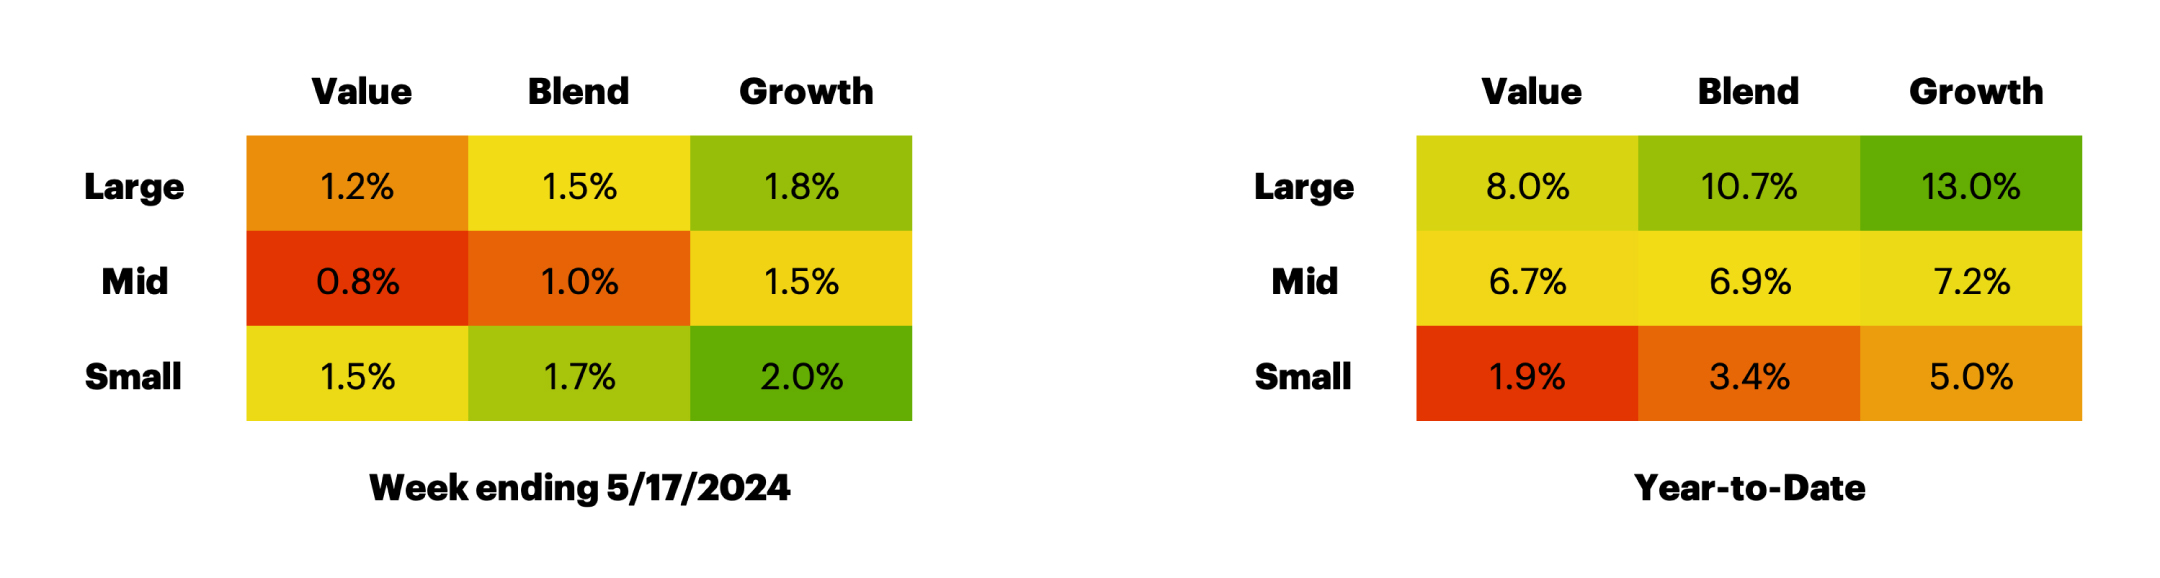
Russell US Equity Style Performance
Growth has significantly outperformed value
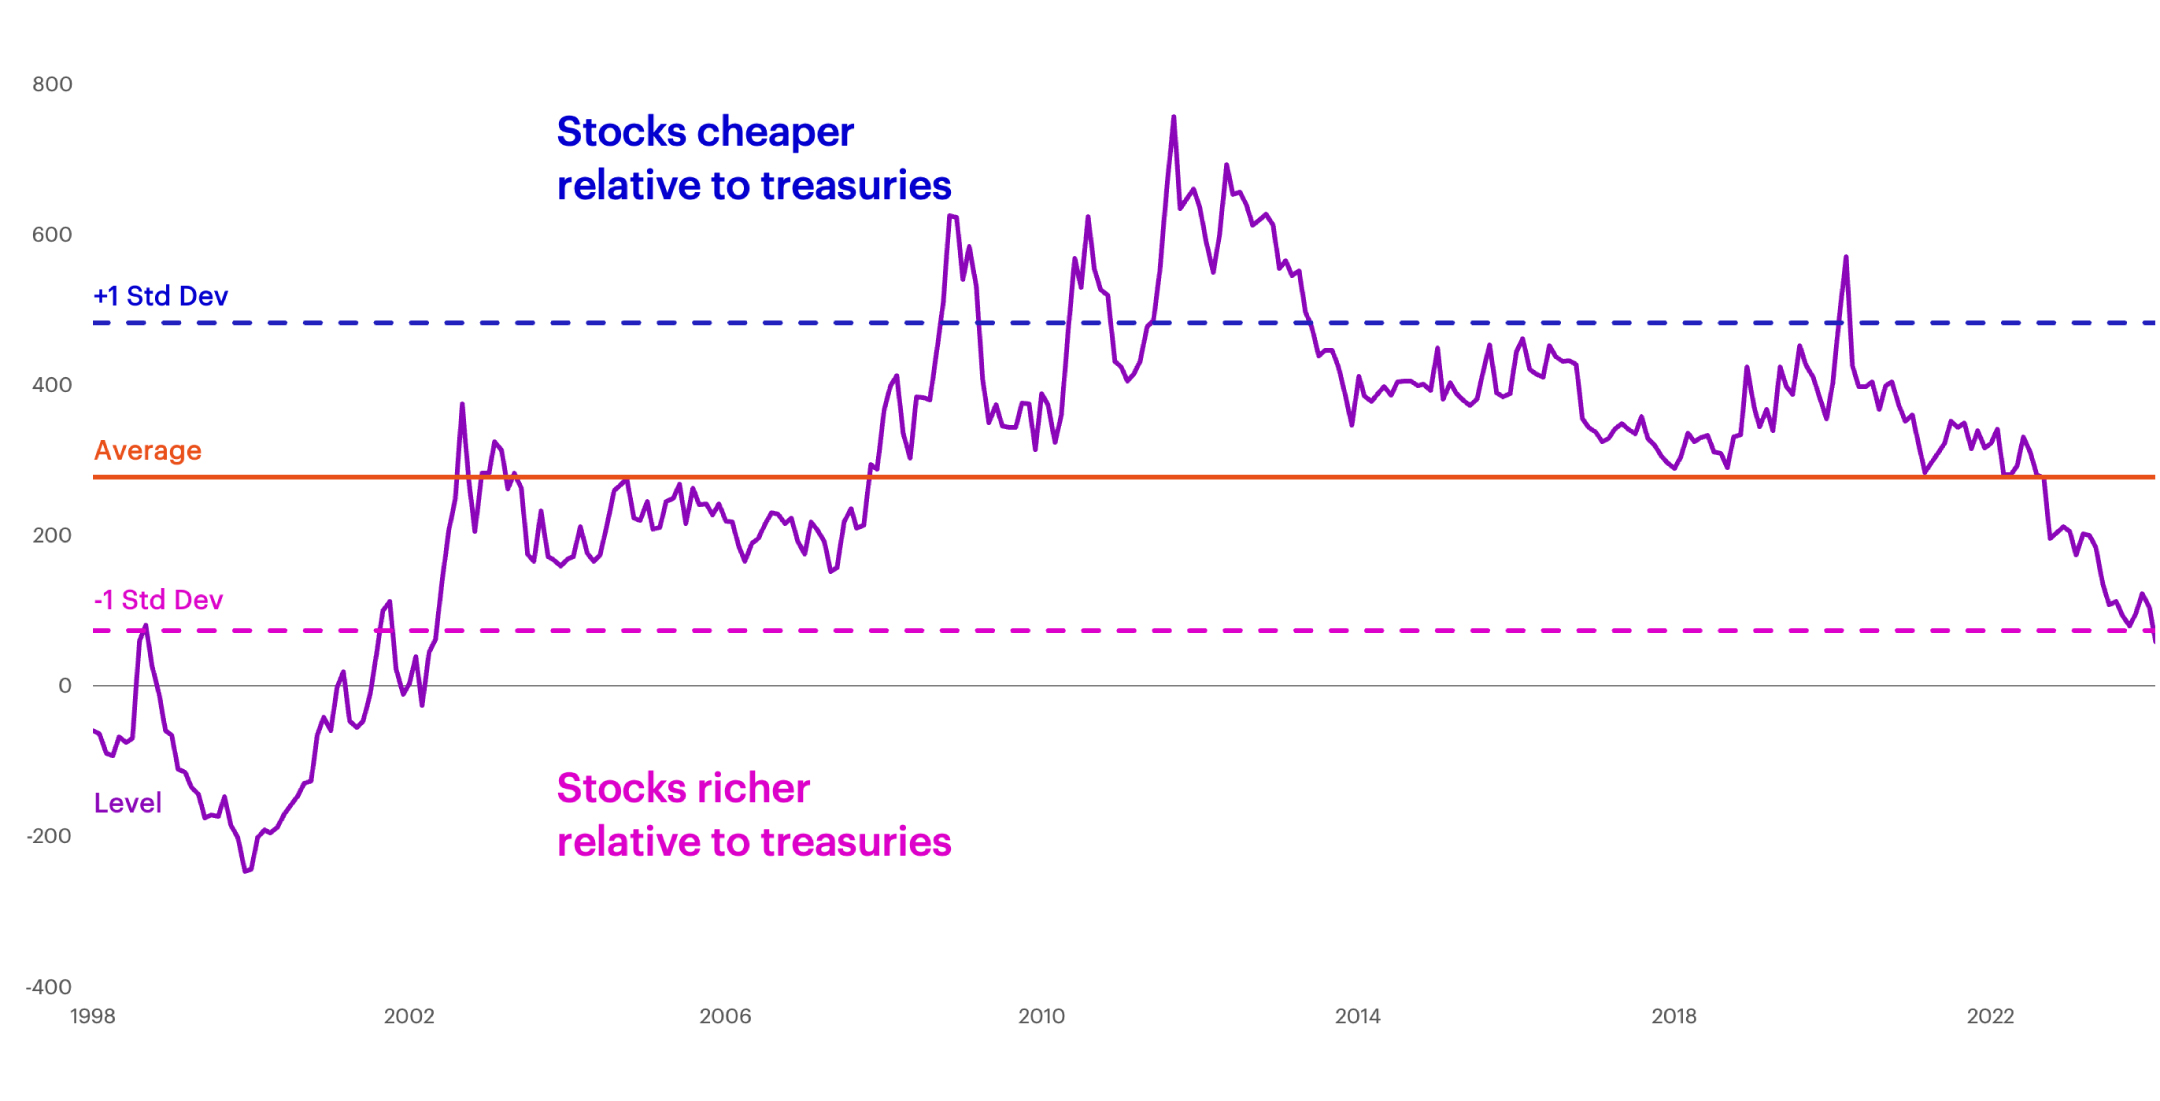
US Equity Valuation
S&P 500 Equity Risk Premium
Bonds continue to appear attractive relative to equities
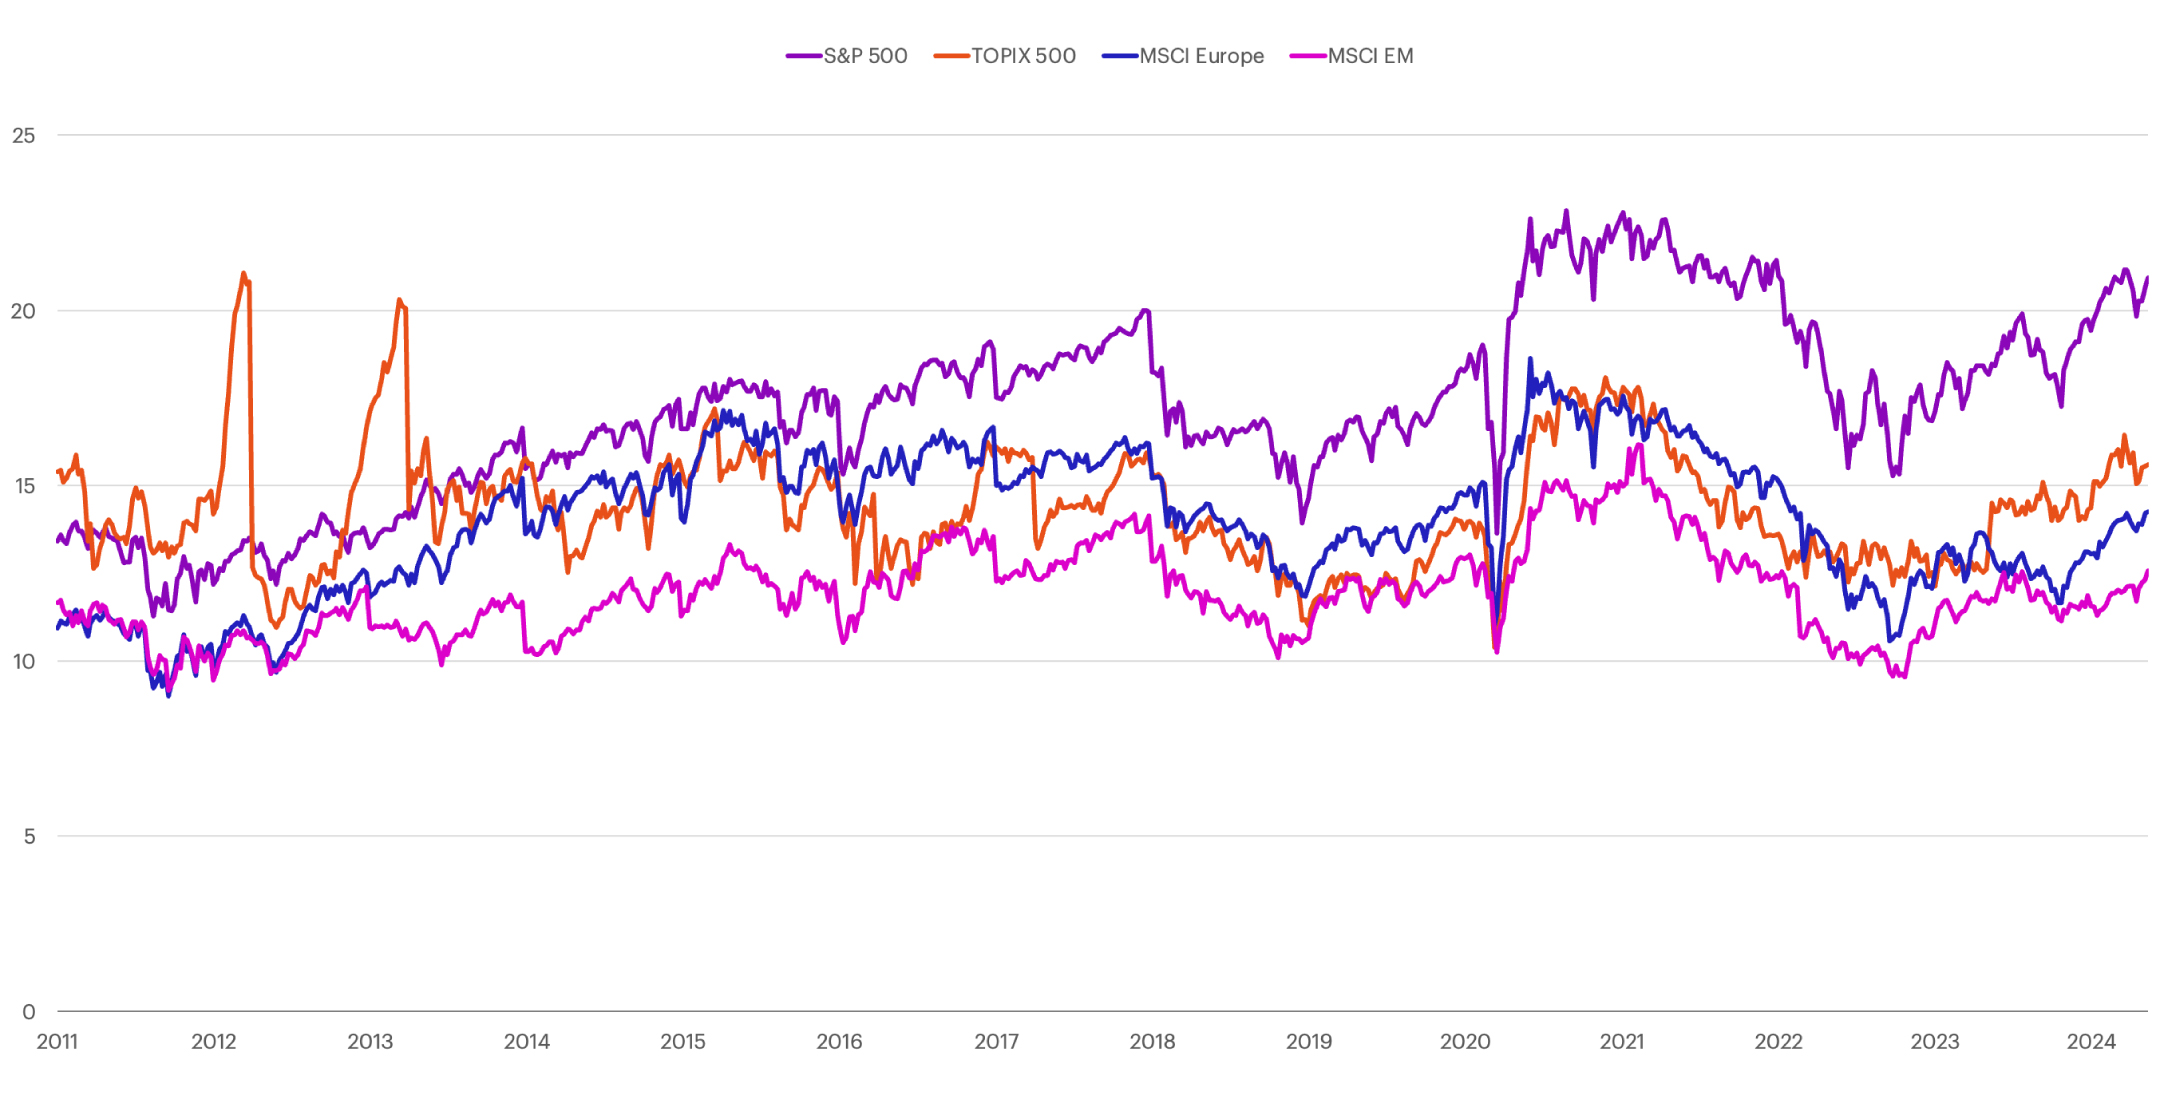
P/E Relative to Rest of World
The S&P 500 remains expensive relative to the rest of the world
US Fixed Income Valuation
The 10-year Treasury yield decreased 8 bps to 4.42% and the two-year Treasury yield fell 4 bps to 4.82% last week
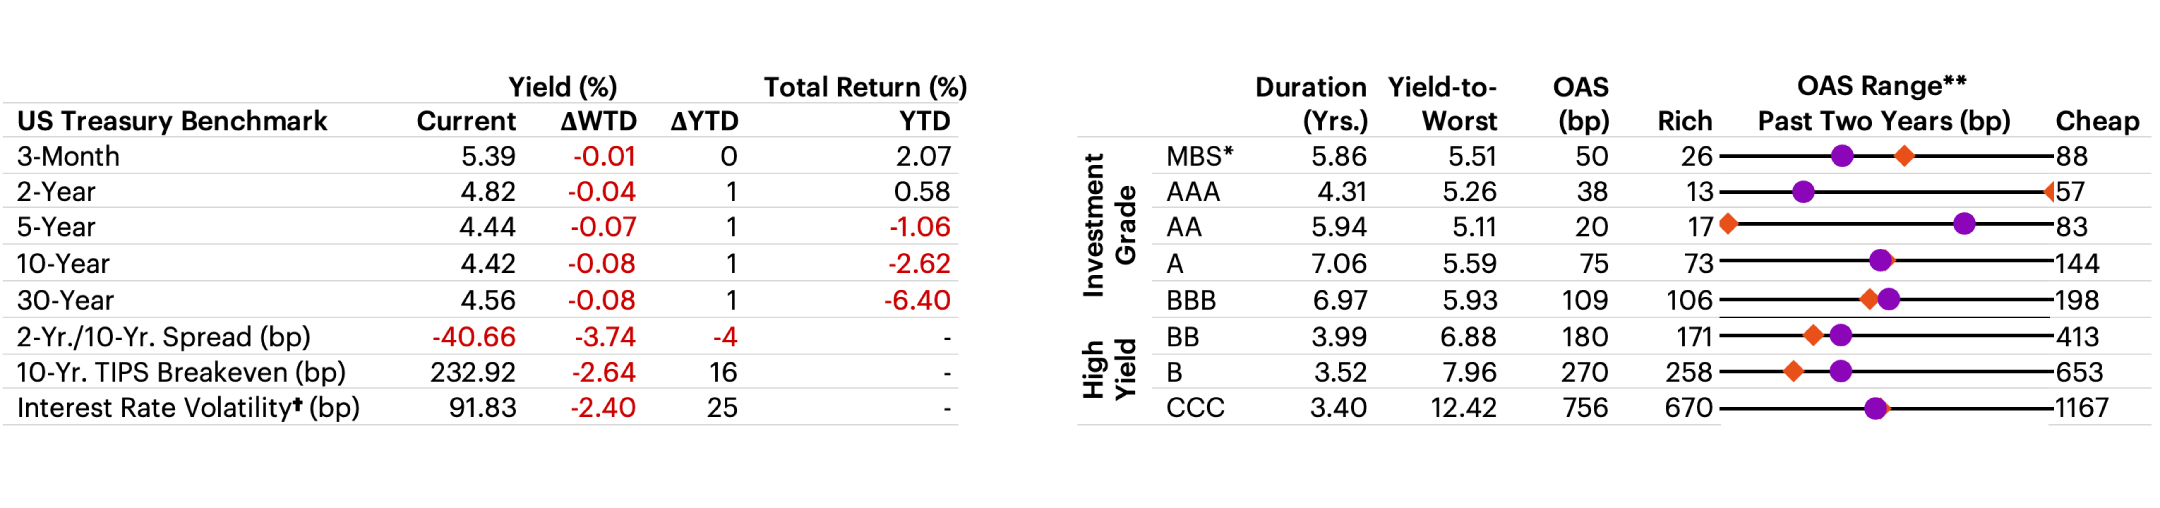
†Interest Rate Volatility as measured by ICE BofAML Option Volatility Estimate Index (MOVE); *Mortgage-backed securities (MBS) are debt obligations that represent claims to the cash flows from pools of mortgage loans, most commonly on residential property. Mortgage loans are purchased from banks, mortgage companies, and other originators and then assembled into pools by a governmental, quasi-governmental, or private entity; **Options Adjusted Spread (OAS): A measurement of the spread of a fixed income security rate and the risk-free rate of return, which is adjusted to take into account an embedded option
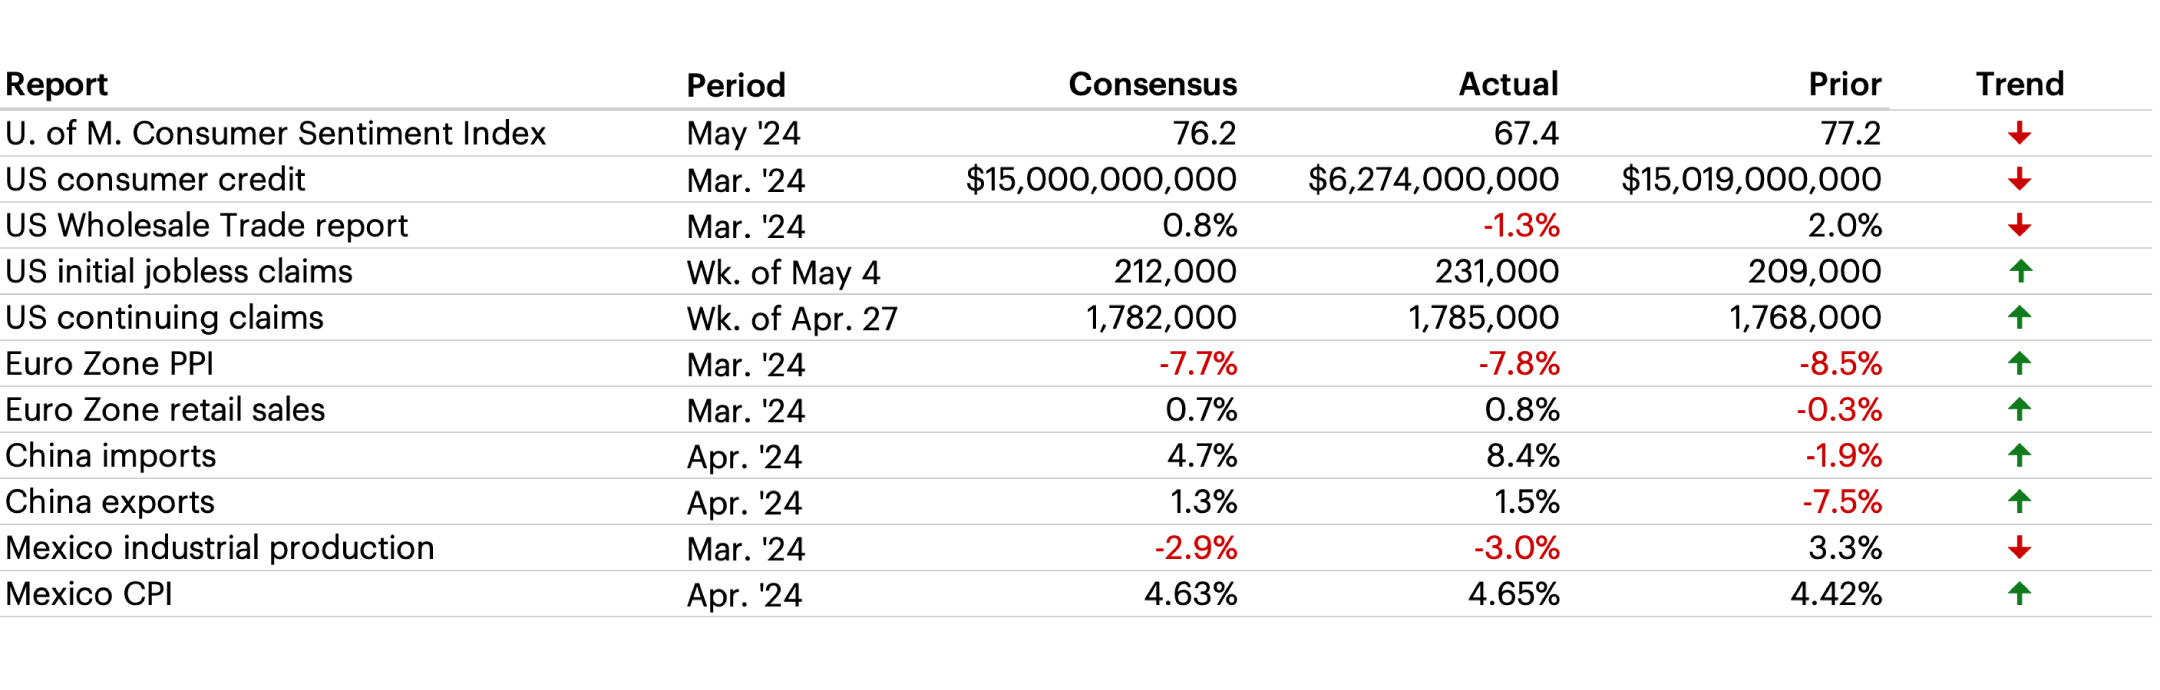
Latest Economic Data
April CPI rose 0.3% month-over-month versus consensus estimates for 0.4%. Core CPI, which excludes food and energy prices, also cooled, dropping to 0.3% month-over-month
Sources: Bloomberg, FactSet, Morgan Stanley Wealth Management Global Investment Committee
The Week Ahead
- Mexico Retail Sales at 8:00 AM ET
- Palo Alto Networks Reports Earnings
- Zoom Video Communications Reports Earnings
- Lowe’s Reports Earnings
- Macy’s Reports Earnings
- Toll Brothers Reports Earnings
- Urban Outfitters Reports Earnings
- US Existing Home Sales at 10:00 AM ET
- FOMC Meeting Minutes
- Target Reports Earnings
- TJX Reports Earnings
- Nvidia Reports Earnings
- Chicago Fed National Activity Index at 8:30 AM ET
- US Initial Jobless Claims at 8:30 AM ET
- US Continuing Claims at 8:30 AM ET
- S&P Global US Manufacturing PMI at 9:45 AM ET
- S&P Global US Services PMI at 9:45 AM ET
- S&P Global US Composite PMI at 9:45 AM ET
- US New Home Sales at 10:00 AM ET
- Kansas City Fed Manufacturing Index at 11:00 AM ET
- US Durable Goods Orders at 8:30 AM ET
Index benchmarks
Cross-Asset Performance
S&P 500: A market capitalization-weighted index of 500 widely held stocks often used as a proxy for the stock market. It measures the movement of the largest issues. Standard and Poor's chooses the member companies for the 500 based on market size, liquidity and industry group representation. Included are the stocks of industrial, financial, utility, and transportation companies. Since mid-1989, this composition has been more flexible and the number of issues in each sector has varied. The returns presented for the S&P 500 are total returns, including the reinvestment of dividends each month.
Dow Jones Industrial Average: Computed by summing the prices of the stocks of 30 companies and then dividing that total by an adjusted value—one which has been adjusted over the years to account for the effects of stock splits on the prices of the 30 companies. Dividends are reinvested to reflect the actual performance of the underlying securities.
NASDAQ Composite: Measures the performance of all issues listed in the NASDAQ Stock Market, except for rights, warrants, units, and convertible debentures. Morningstar reports the NASDAQ Composite as a price return.
MSCI Europe IMI: This index captures large, mid and small cap representation across 16 Developed Markets countries in Europe. With 1,372 constituents, the index covers approximately 99% of the free float-adjusted market capitalization across the Developed Markets countries of Europe.
MSCI Japan IMI: This index is designed to measure the performance of the large, mid and small cap segments of the Japan market. With 1,134 constituents, the index covers approximately 99% of the free float-adjusted market capitalization in Japan.
MSCI EM (Emerging Markets) Index: A free float-adjusted market-capitalization index that is designed to measure equity market performance of emerging markets. The MSCI Emerging Markets Index consists of the following 23 emerging market country indexes: Brazil, Chile, China, Colombia, Czech Republic, Egypt, Greece, Hungary, India, Indonesia, Korea, Malaysia, Mexico, Peru, Philippines, Poland, Qatar, Russia, South Africa, Taiwan, Thailand, Turkey and United Arab Emirates. For more information, visit the MSCI web site.
MSCI EAFE (Europe, Australasia, Far East) Index: A free float-adjusted market-capitalization index that is designed to measure the equity market performance of developed markets, excluding the U.S. and Canada. The MSCI EAFE Index consists of the following 21 developed market country indexes: Australia, Austria, Belgium, Denmark, Finland, France, Germany, Hong Kong, Ireland, Israel, Italy, Japan, the Netherlands, New Zealand, Norway, Portugal, Singapore, Spain, Sweden, Switzerland, and the United Kingdom. For more information, visit the MSCI website.
S&P 400 Index: This index provides investors with a benchmark for mid-sized companies. The index measures the performance of mid-sized companies, reflecting the distinctive risk and return characteristics of this market segment.
S&P 600 Index: This index measures the small-cap segment of the U.S. equity market. The index is designed to track companies that meet specific inclusion criteria to ensure that they are liquid and financially viable.
S&P 500 Growth: This index is a style-concentrated index designed to track the performance of stocks that exhibit the strongest growth characteristics by using a style-attractiveness-weighting scheme.
S&P 500 Value: This index is a style-concentrated index designed to track the performance of stocks that exhibit the strongest value characteristics by using a style-attractiveness-weighting scheme.
Bloomberg Commodity Index: Made up of 22 exchange-traded futures on physical commodities. The index currently represents 20 commodities, which are weighted to account for economic significance and market liquidity.
US Trade-Weighted Dollar Index: A weighted average of the foreign exchange value of the US dollar against a subset of the broad index currencies that circulate widely outside the US.
MSCI Emerging Markets Currency Index: sets the weights of each currency equal to the relevant country weight in the MSCI Emerging Markets Index.
Bloomberg US Aggregate Index: The US Aggregate Index covers the dollar-denominated investment-grade fixed-rate taxable bond market, including Treasuries, government-related and corporate securities, MBS pass-through securities, asset-backed securities, and commercial mortgage-based securities. These major sectors are subdivided into more specific sub-indices that are calculated and published on an ongoing basis. Total return comprises price appreciation/depreciation and income as a percentage of the original investment. This index is rebalanced monthly by market capitalization.
Bloomberg US Corporate High Yield Bond Index: This index is composed of fixed-rate, publicly issued, non-investment grade debt.
S&P Sector Performance
The S&P 500 Consumer Discretionary sector comprises those companies included in the S&P 500 that are classified as members of the consumer discretionary sector.
The S&P 500 Consumer Staples sector comprises those companies included in the S&P 500 that are classified as members of the consumer staples sector.
The S&P 500 Energy sector comprises those companies included in the S&P 500 that are classified as members of the energy sector.
The S&P 500 Financials sector comprises those companies included in the S&P 500 that are classified as members of the financial sector.
The S&P 500 Health Care sector comprises those companies included in the S&P 500 that are classified as members of the health care sector.
The S&P 500 Industrials Sector comprises those companies included in the S&P 500 that are classified as members of the industrials sector.
The S&P 500 Information Technology Sector comprises those companies included in the S&P 500 that are classified as members of the information technology sector.
The S&P 500 Materials Sector comprises those companies included in the S&P 500 that are classified as members of the materials sector.
The S&P 500 Communications Services Sector comprises those companies included in the S&P 500 that are classified as members of the telecommunications services sector.
The S&P 500 Utilities Sector comprises those companies included in the S&P 500 that are classified as members of the utilities sector.
The S&P 500 Real Estate Sector comprises those companies included in the S&P 500 that are classified as members of the real estate sector.
US Equity Style Performance
Weekly and monthly style performance charts use Russell 1000, Russell Mid Cap, and Russell 2000 style indexes to represent large cap, mid cap, and small cap respectively.
Russell 1000: Consists of the 1000 largest companies within the Russell 3000 index. Also known as the Market-Oriented Index, because it represents the group of stocks from which most active money managers choose. The returns we publish for the index are total returns, which include reinvestment of dividends. Frank Russell Company reports its indexes as one-month total returns.
Russell 1000 Growth: Market-capitalization weighted index of those firms in the Russell 1000 with higher price-to-book ratios and higher forecasted growth values. The Russell 1000 includes the largest 1000 firms in the Russell 3000, which represents approximately 98% of the investable US equity market.
Russell 1000 Value: Market-capitalization weighted index of those firms in the Russell 1000 with lower price-to-book ratios and lower forecasted growth values. The Russell 1000 includes the largest 1000 firms in the Russell 3000, which represents approximately 98% of the investable US equity market.
Russell 2000: Consists of the smallest 2000 companies in the Russell 3000 Index, representing approximately 7% of the Russell 3000 total market capitalization. The returns we publish for the index are total returns, which include reinvestment of dividends.
Russell 2000 Growth: Market-weighted total return index that measures the performance of companies within the Russell 2000 Index having higher price-to-book ratios and higher forecasted growth values. The Russell 2000 Index includes the 2000 firms from the Russell 3000 Index with the smallest market capitalizations. The Russell 3000 Index represents 98% of the of the investable US equity market.
Russell 2000 Value: Market-weighted total return index that measures the performance of companies within the Russell 2000 Index having lower price-to-book ratios and lower forecasted growth values. The Russell 2000 Index includes the 2000 firms from the Russell 3000 Index with the smallest market capitalizations. The Russell 3000 Index represents 98% of the of the investable US equity market.
Russell Midcap: Measures the performance of the 800 smallest companies in the Russell 1000 Index, which represent approximately 25% of the total market capitalization of the Russell 1000 Index. As of the latest reconstitution, the average market capitalization was approximately $4.0 billion; the median market capitalization was approximately $2.9 billion. The largest company in the index had an approximate market capitalization of $12 billion.
Russell Midcap Growth: Market-weighted total return index that measures the performance of companies within the Russell Midcap Index having higher price-to-book ratios and higher forecasted growth values. The Russell Midcap Index includes firms 201 through 1000, based on market capitalization, from the Russell 3000 Index. The Russell 3000 Index represents 98% of the of the investable U.S. equity market.
Russell Midcap Value: Market-weighted total return index that measures the performance of companies within the Russell Midcap Index having lower price-to-book ratios and lower forecasted growth values. The Russell Midcap Index includes firms 201 through 1000, based on market capitalization, from the Russell 3000 Index. The Russell 3000 Index represents 98% of the of the investable U.S. equity market.
P/E Relative to Rest of World
TOPIX: This free-floated-adjusted index tracks all domestic companies of the exchange’s First Section.
US Fixed Income Valuation
ICE BofAML Option Volatility Estimate Index (MOVE): A yield curve-weighted index of the normalized implied volatility on one-month treasury option.
How can E*TRADE from Morgan Stanley help?
Real estate trusts
Learn about ways to invest in trusts that aim to generate income from owning real estate such as office buildings, hotels, and apartment complexes.
Technology Pacesetters
Learn how to invest in leading technology innovators that are looking to change the way the world works.
Futures
Like options, futures let you lock in a price now for an investment you’ll buy in the future. They cost much less than the actual investment, so you can control a large contract with a relatively small amount of capital.
Premium Savings Account
Boost your savings with 4.25% APY1
With rates 9X the national average2, plus FDIC protection up to $500,0003, and more.