Understanding technical analysis support and resistance
E*TRADE from Morgan Stanley
Among all the aspects of technical analysis, perhaps the most important and actionable concepts are support and resistance. Many other aspects of technical analysis, such as price patterns, are based on the key concepts of support and resistance.
Support represents a low level a stock price reaches over time, while resistance represents a high level a stock price reaches over time. Support materializes when a stock price drops to a level that prompts traders to buy. This reactionary buying causes a stock price to stop dropping and start rising. Conversely, resistance materializes when a stock price rises to a level that prompts traders to sell. This selling causes a stock price to stop rising and start dropping.
One way you can find support and resistance levels is to draw imaginary lines on a chart that connect the lows and highs of a stock price. These lines can be drawn horizontally or diagonally.
Importantly, support and resistance levels are estimates and not necessarily exact prices. Try focusing on price zones when identifying support and resistance.
Identifying support
There are generally two types of support: horizontal and diagonal. In this first example, you can see an instance of horizontal support that formed in a stock at $182, as seen in Figure 1. Notice how the stock stopped going down and started moving up on four different occasions after trading to $182. These four roughly equal lows, when connected by a line, form support. A trader identifying this support might try to buy the stock near support.
Horizontal support example
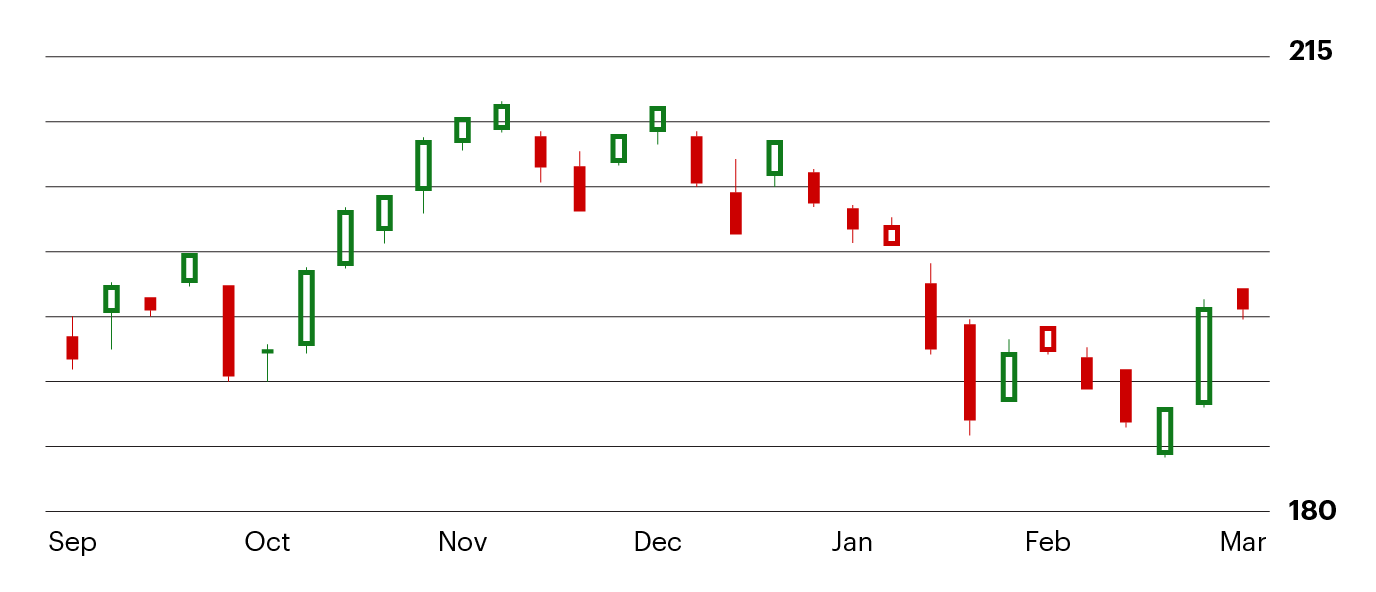
Figure 1. For illustration only not a recommendation.
The second type of support is diagonal. Like horizontal support, diagonal support is formed by connecting lows. The difference with diagonal support is that the lows are sequentially higher because a stock is in an uptrend. You can see an example of diagonal support in Figure 2. Notice how the stock stopped going down, and continued trending up, on several occasions after its price dropped near the diagonal support line. A trader identifying this support might try to buy the stock near support.
Diagonal support example
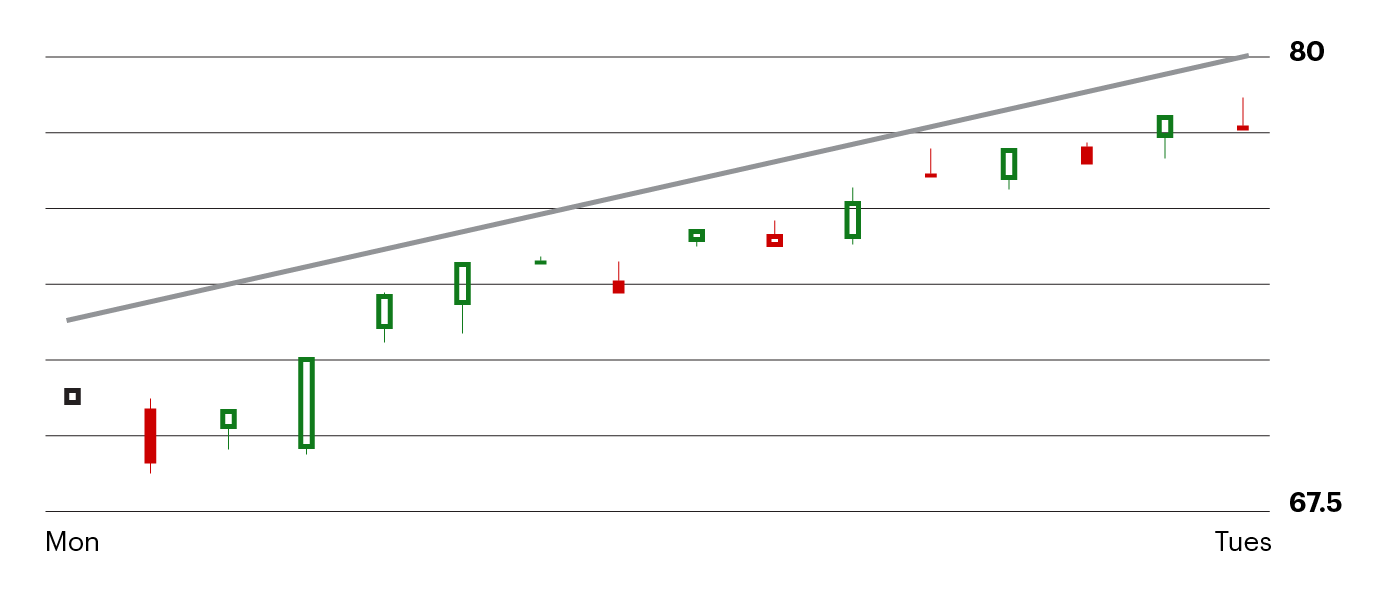
Figure 2. For illustration only not a recommendation
Identifying resistance
Like support, there are typically two types of resistance: horizontal and diagonal. The chart in Figure 3 displays an example of horizontal resistance where the stock traded up to about $115 on several occasions before reversing. A trader identifying this resistance might sell the stock near resistance.
Horizontal resistance example
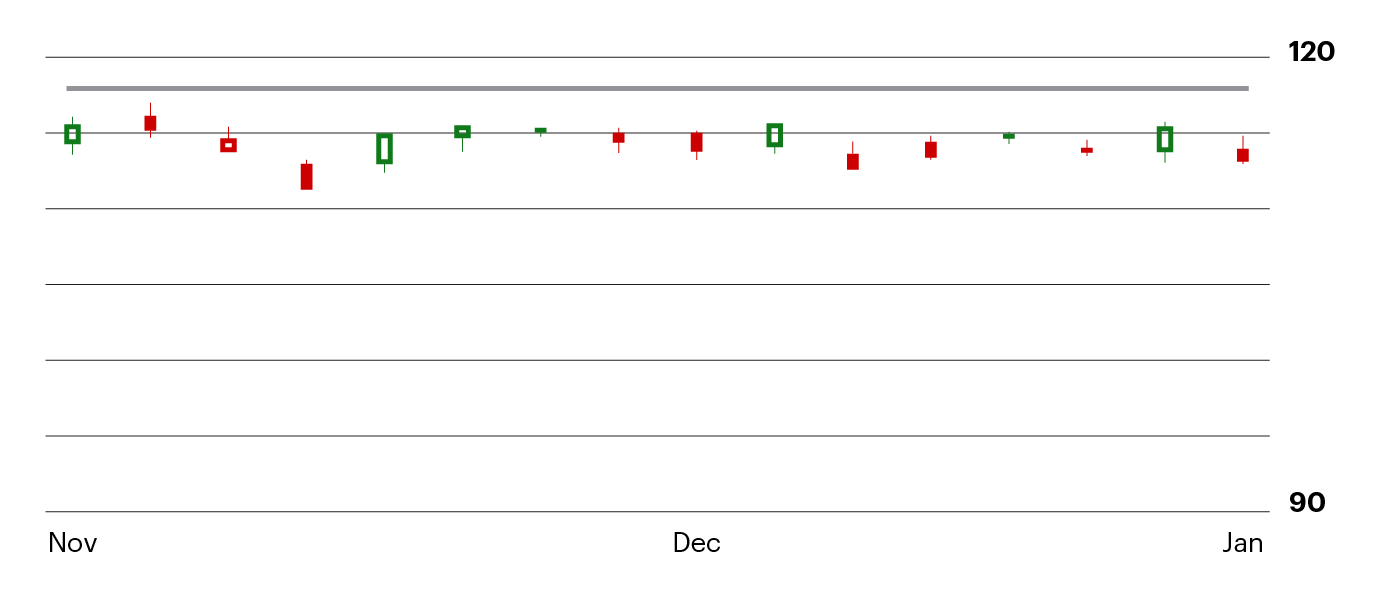
Figure 3. For illustration only not a recommendation.
The second type of resistance is diagonal, which typically forms in the context of a downtrend. Diagonal resistance is formed by connecting sequentially lower highs. You can see an example of diagonal resistance in Figure 4 within the context of a downtrend. Notice how the stock stopped going up, and resumed the overall downward trend, on several occasions near the diagonal resistance line. A trader observing this resistance might avoid the stock or even sell.
Diagonal resistance example
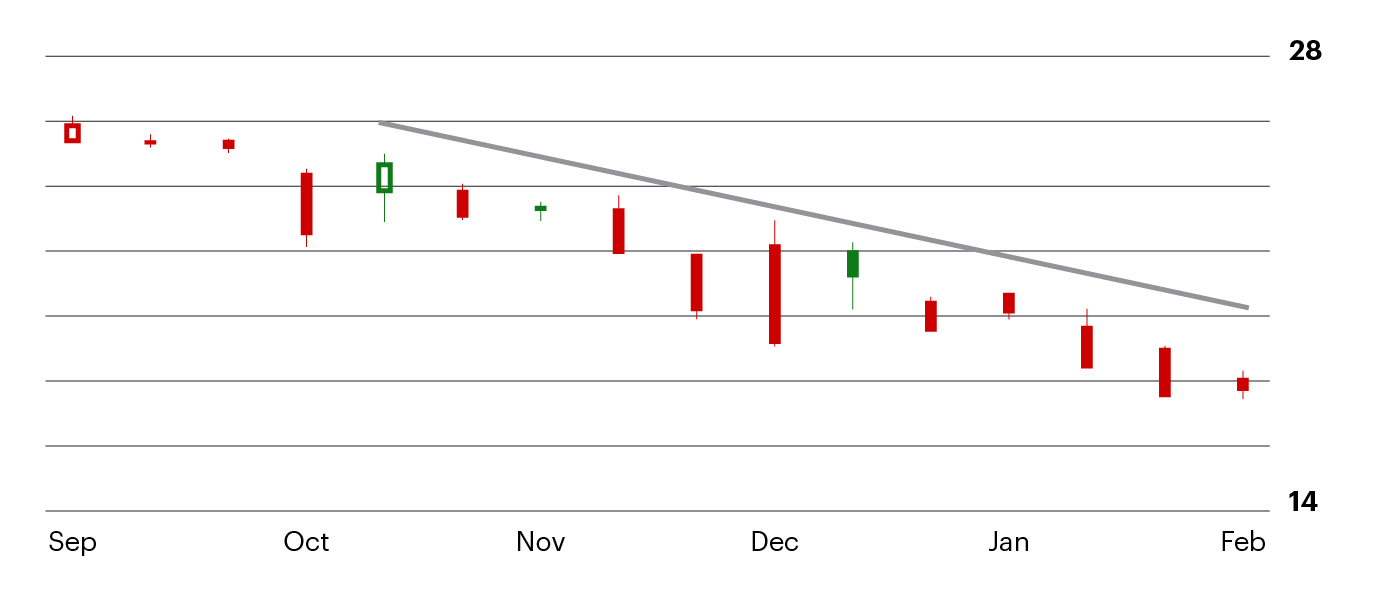
Figure 4. For illustration only not a recommendation.
Applying support and resistance
The most effective way to apply support and resistance is to monitor for breakdowns and breakouts. A breakdown is when a stock falls below support. A breakout is when a stock rises above resistance.
One way some traders apply support breakdowns is by selling a stock in anticipation of further downside and in an attempt to limit potential losses. One example of this is seen in Figure 5. Notice how the stock continued to drop after its breakdown below diagonal support.
Breakdown below support example
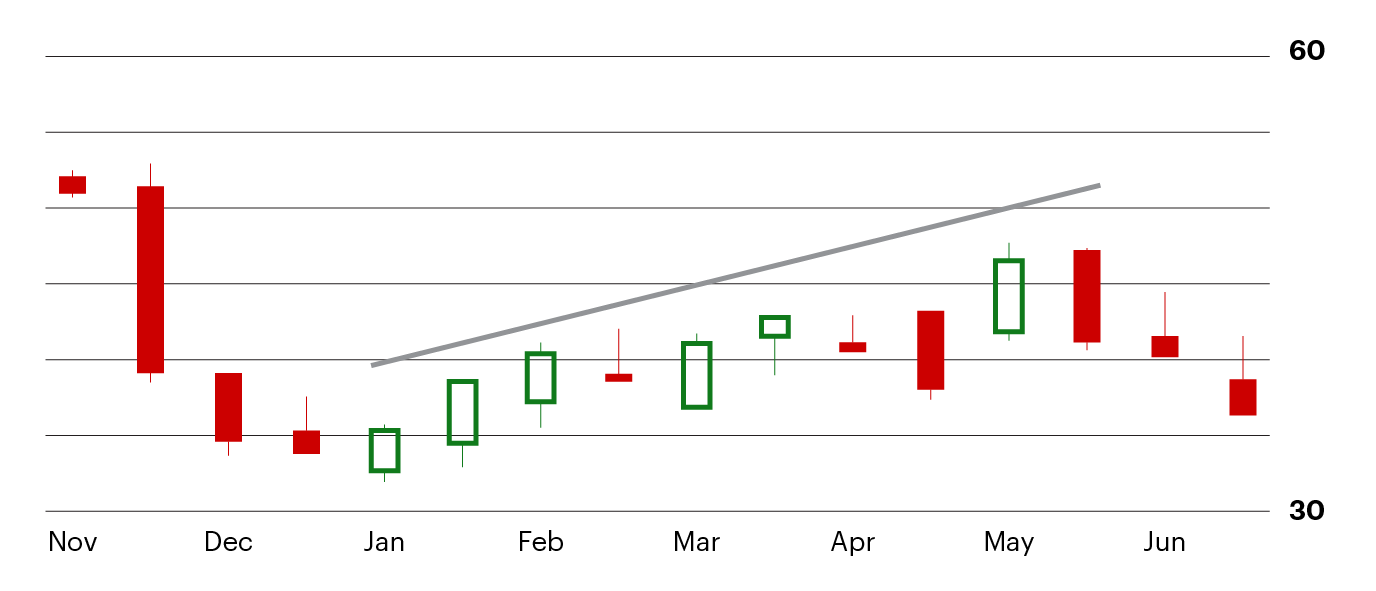
Figure 5. For illustration only not a recommendation.
Some traders monitor stocks near resistance and buy once the stock experiences a breakout above resistance. You can see an example of a breakout above resistance in Figure 6. A trader monitoring this stock may have bought the stock on the day of the breakout and potentially profited in the following days.
Breakout above resistance example
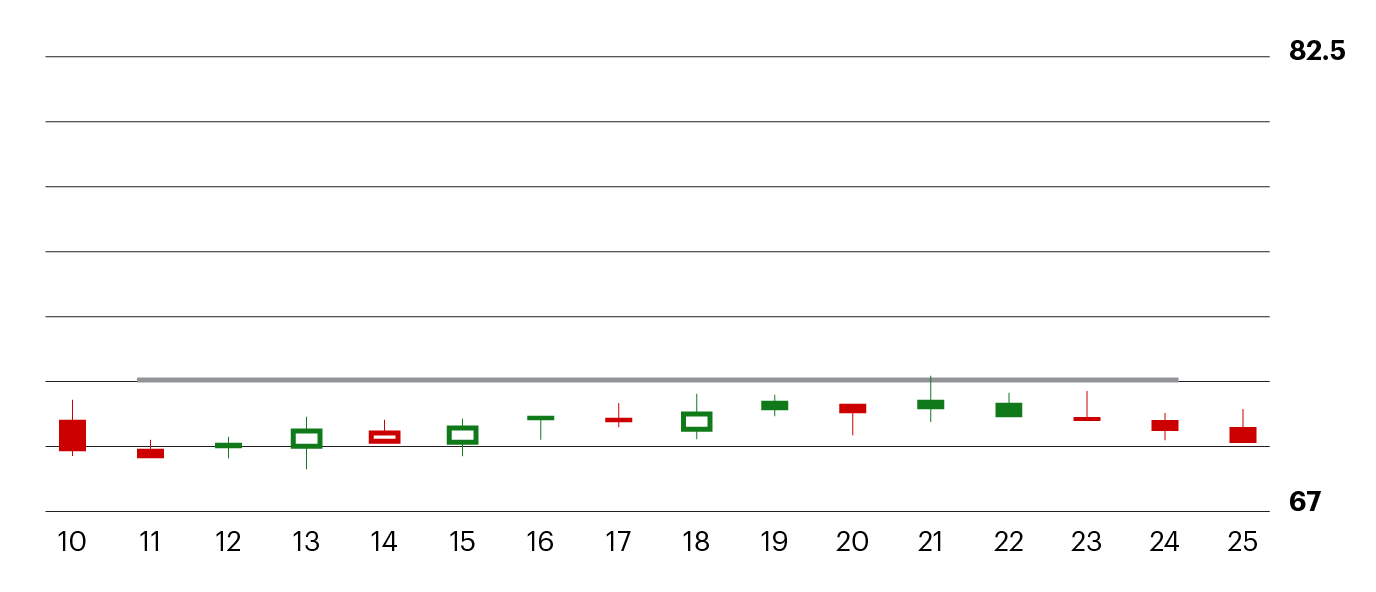
Figure 6. For illustration only not a recommendation.
Selling stocks that breakdown below support, or buying stocks that breakout above resistance, are a few ways to apply support and resistance.