Market Dashboard
New every Monday with last week’s recap and notes on the week ahead.
Last update: 4/29/2024
US equities: Stocks were higher for the first time in four weeks.
- Both the S&P 500 Index and the Nasdaq Composite Index saw their best weekly gains since early November 2023, up 2.67% and 4.23%, respectively.
- Small-cap stocks also had a solid week, with the Russell 2000 Index up 2.79%.
- Strong first-quarter corporate earnings results were a big positive driver last week, with gains from several mega-cap tech names helping propel indices higher.
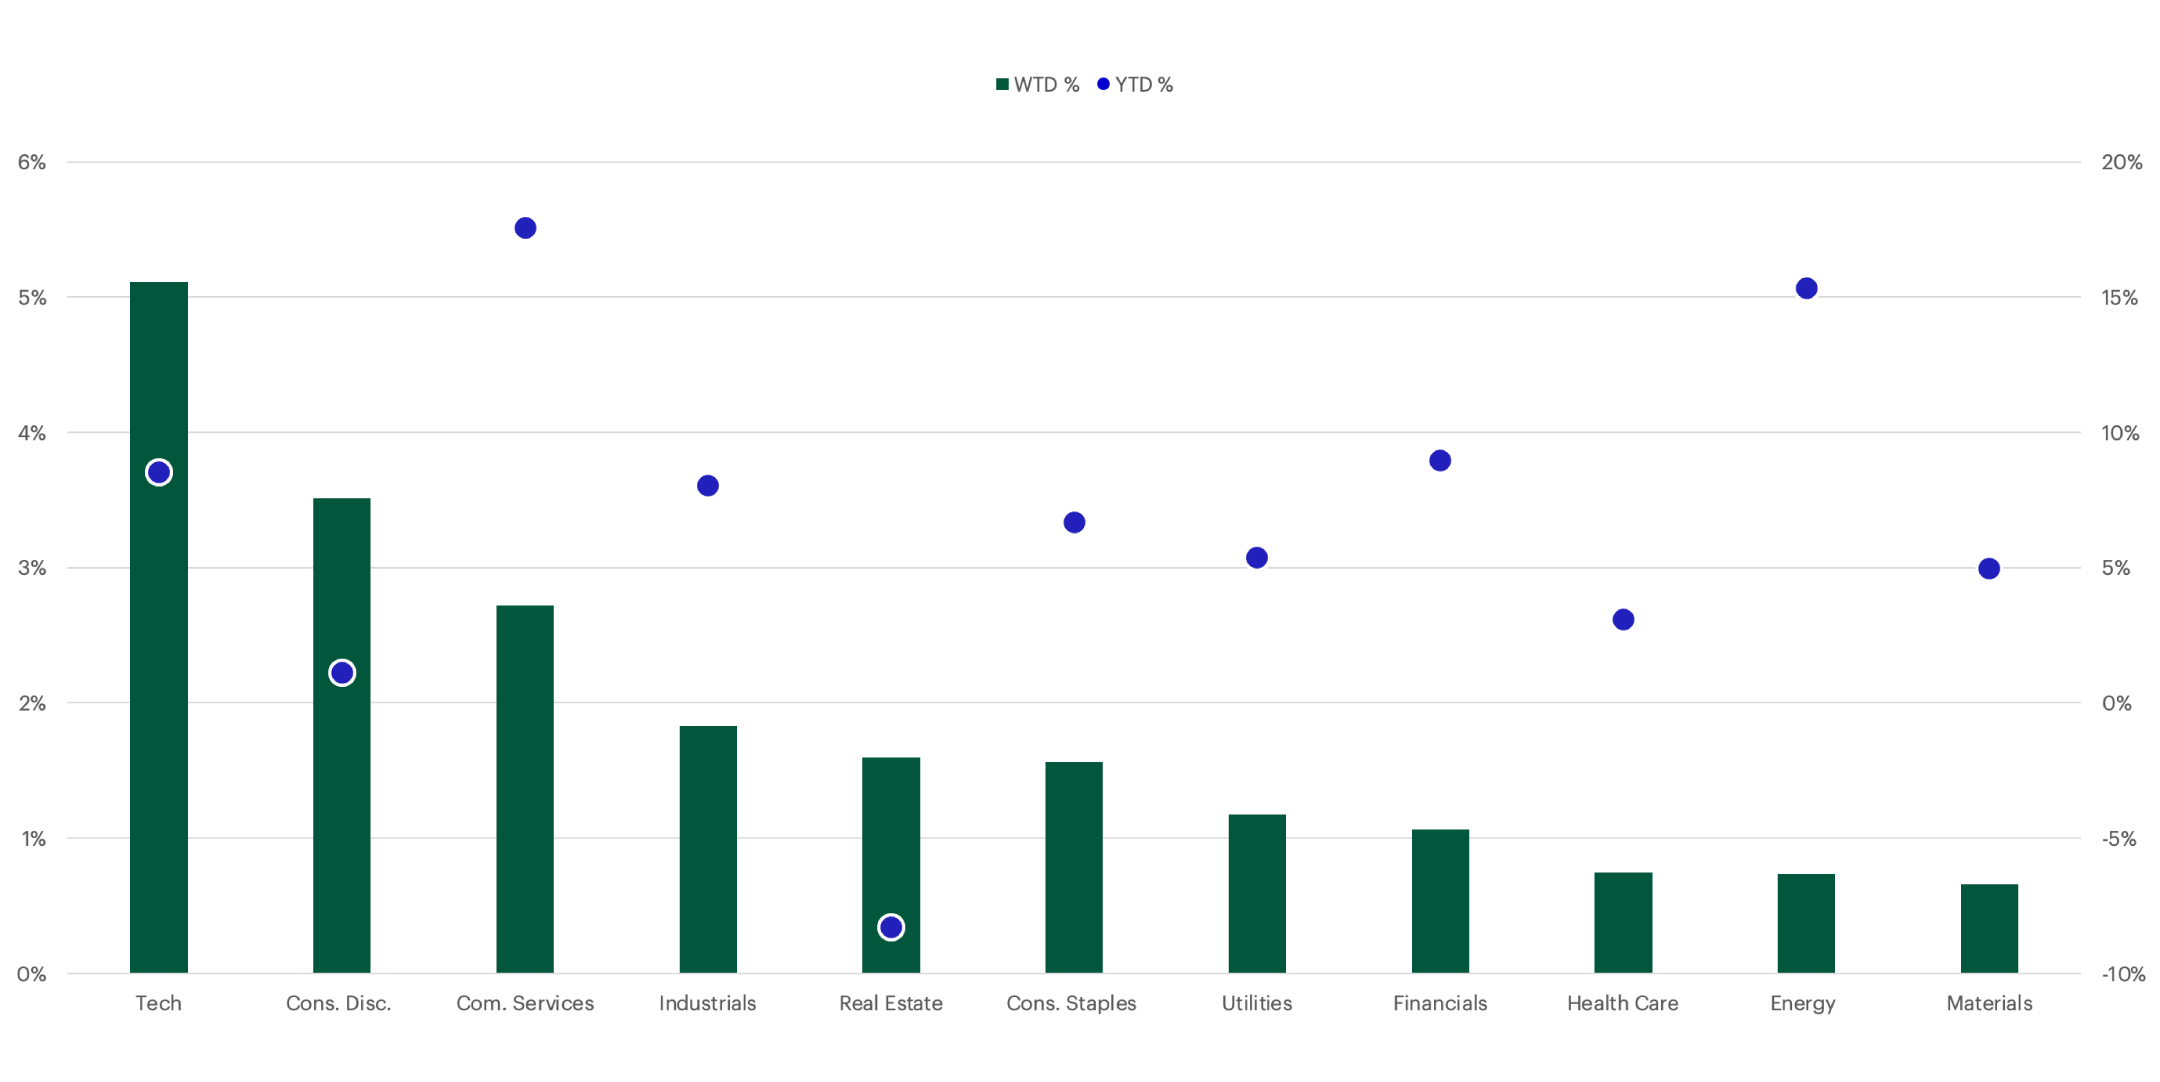
- Technology (up 5.1%) and Consumer Discretionary (up 3.5%) were the best-performing S&P 500 sectors, while Materials (up 0.7%) and Energy (up 0.7%) underperformed.
US fixed income: Bond yields rose for the fourth week in a row.
- The two-year Treasury yield briefly rose above 5.00% last Thursday for the first time since November 2023, ultimately ending the week at 4.99%.
- The 10-year Treasury yield increased 4 basis points to 4.66%.
Key economic data: Reports showed slowing growth and sticky inflation.
- US gross domestic product (GDP) grew at a 1.6% annualized rate in the first quarter (Q1) of 2024, well below the consensus economist estimate of 2.5%.
- The S&P Global Flash U.S. Composite PMI—which gauges activity in the manufacturing and services sectors—came in below consensus expectations for April, reflecting an overall reduction in orders and companies scaling back employment for the first time in nearly four years.
- Meanwhile, the core personal consumption expenditures (PCE) price index, which excludes food and energy prices, rose at a 3.7% annualized pace in Q1—exceeding the median economist estimate of 3.4% and the Federal Reserve’s 2% target.
- The data raised concerns about a “stagflation” economic scenario, in which growth stalls while inflation persists. It also further muddles the timeline for the Fed to begin lowering interest rates.
- Nevertheless, investors reacted positively to core PCE data for the month of March, which was in-line with expectations.
Corporate earnings: Q1 earnings results have been strong so far.
- With 46% of S&P 500 companies having reported as of last Friday:
- 77% of firms had beaten analysts’ earnings-per-share (EPS) estimates.
- The median company that beat consensus EPS estimates did so by 8.4%.
- EPS thus far are up 3.5% in Q1 2024 versus Q1 2023.
- Big tech stocks helped drive last week’s equity-market gains, with several “Magnificent 7” names rising after reporting earnings, including Tesla (up 14.4%), Google parent Alphabet (up 11.6%), and Microsoft (up 1.8%). Also, Nvidia was up 15.1%, benefitting from renewed AI optimism.
Commodities and currencies: Gold retreated while oil advanced.
Cross-Asset Performance Table
Returns and prices of the most popular indices and assets as of 4/26/24
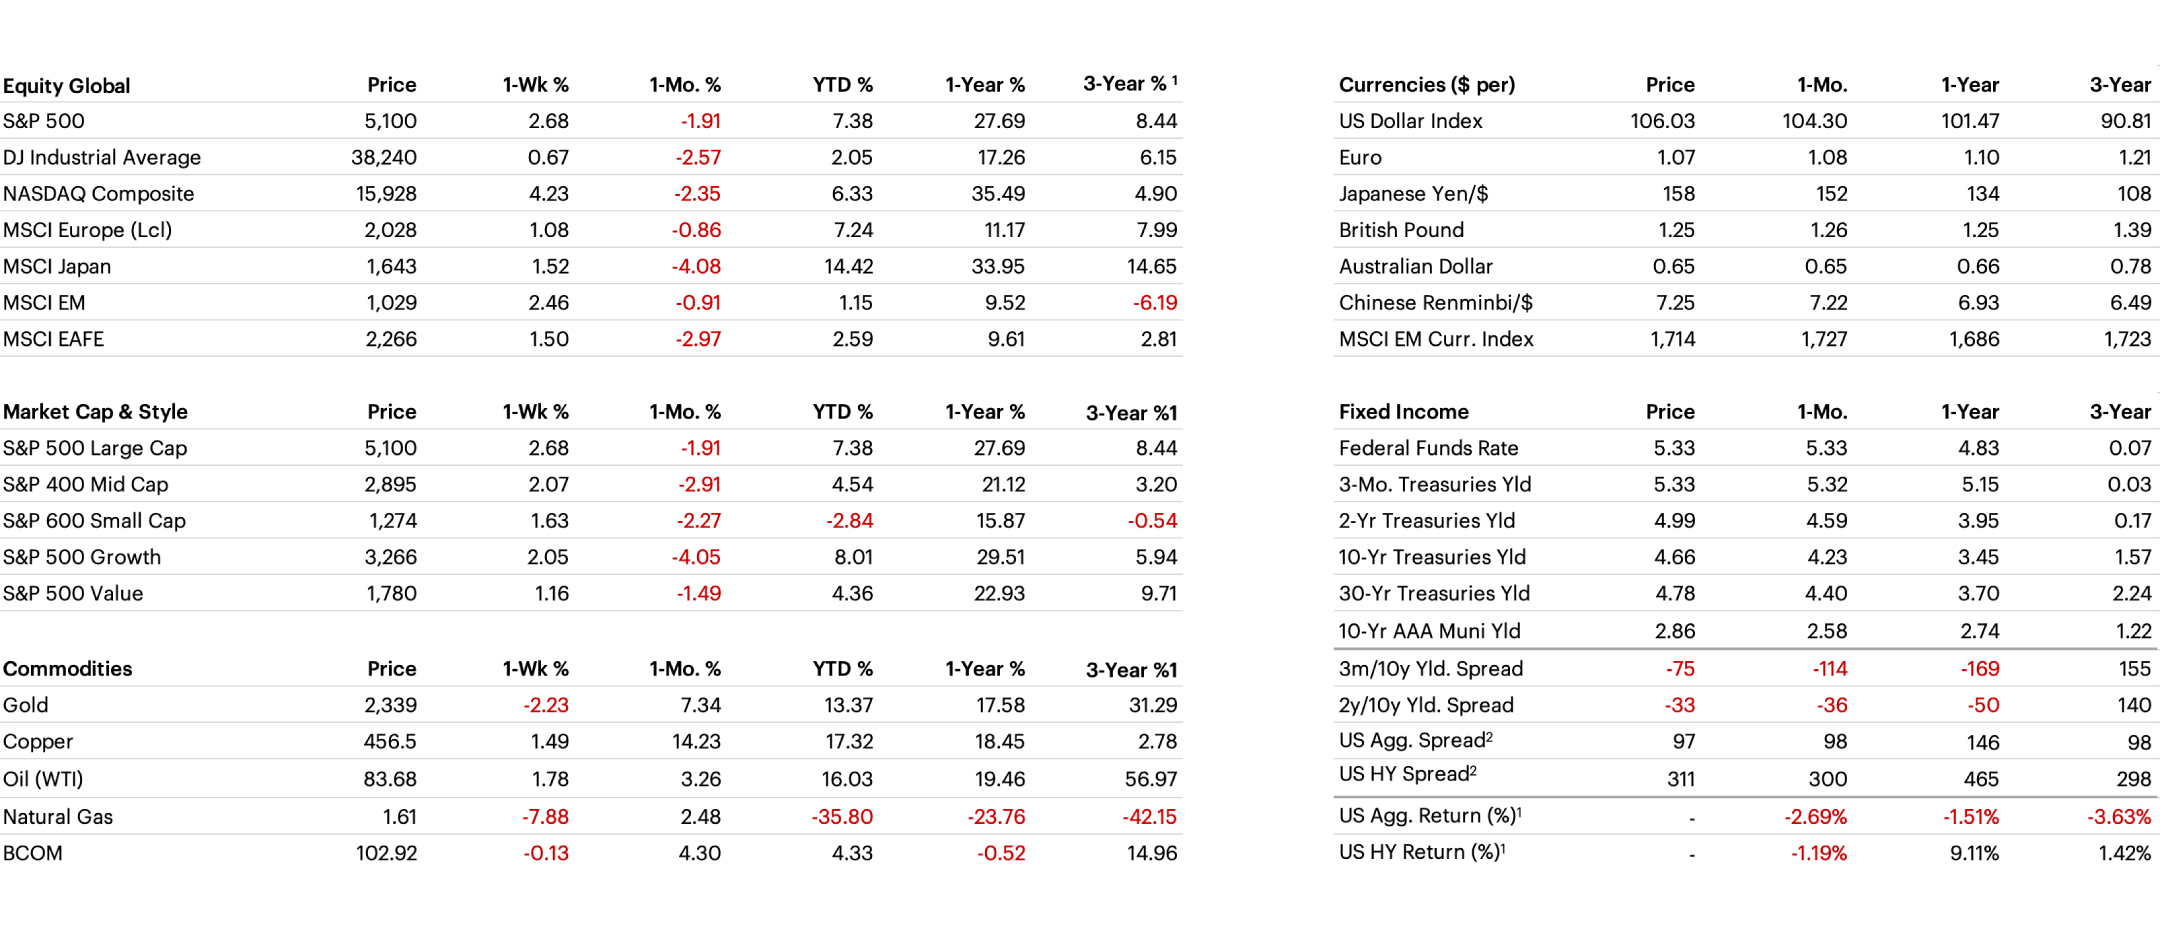
1) Annualized 3-year % return. 2) Option Adjusted Spread (OAS): OAS is a measurement of the spread of a fixed income security rate and the risk-free rate of return, which is adjusted to take into account an embedded option. Equity risk premium is the excess return that an individual stock or the overall stock market provides over a risk-free rate. The risk-free rate represents the interest an investor would expect from an absolutely risk-free investment over a specified period of time.
S&P 500 Sector Performance
Information Technology and Consumer Discretionary were the best performing S&P 500 sectors last week, while Energy and Materials performed worst
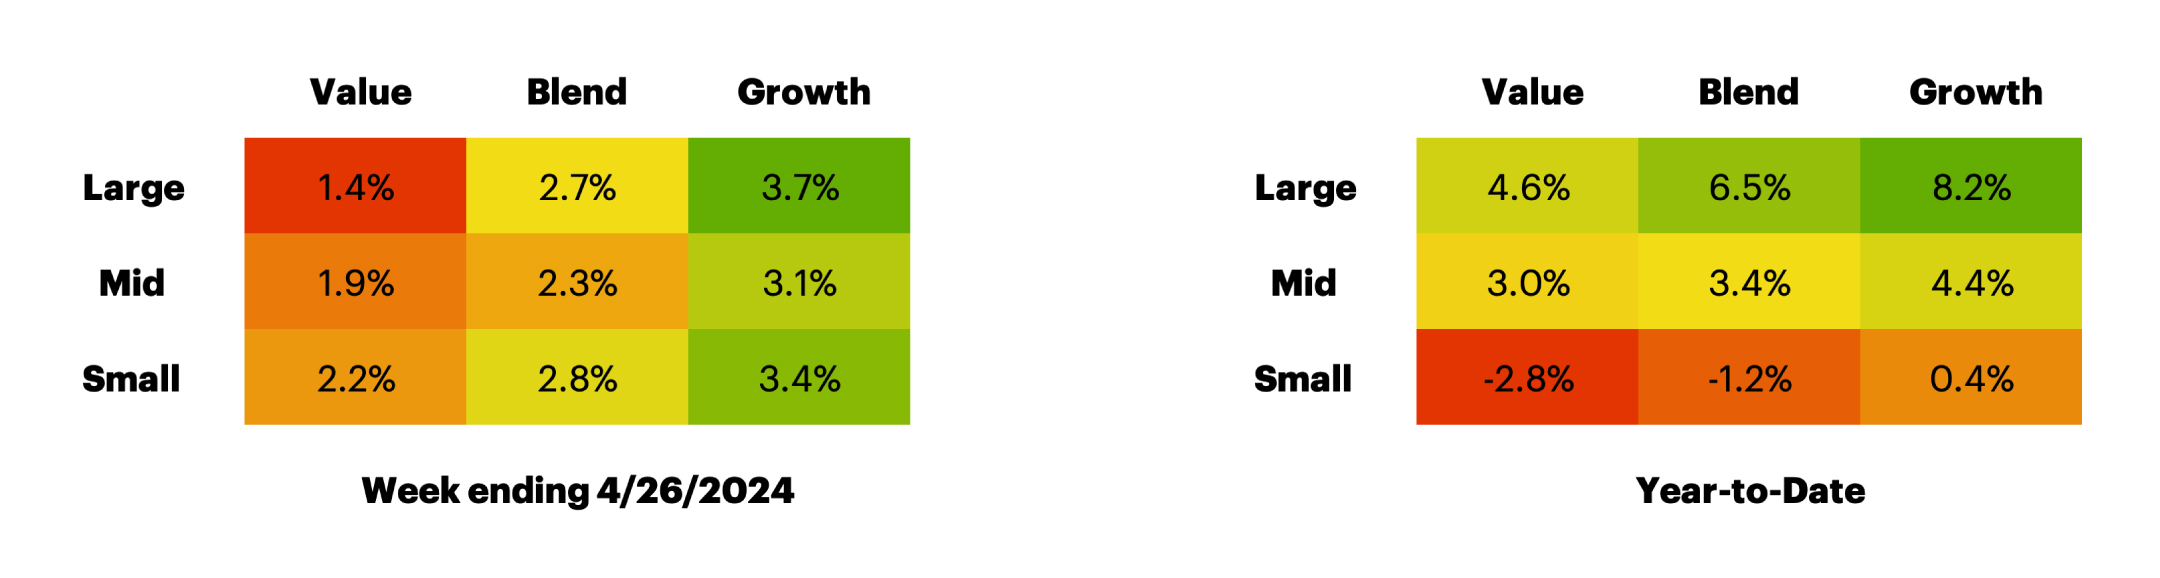
Russell US Equity Style Performance
Growth has significantly outperformed value
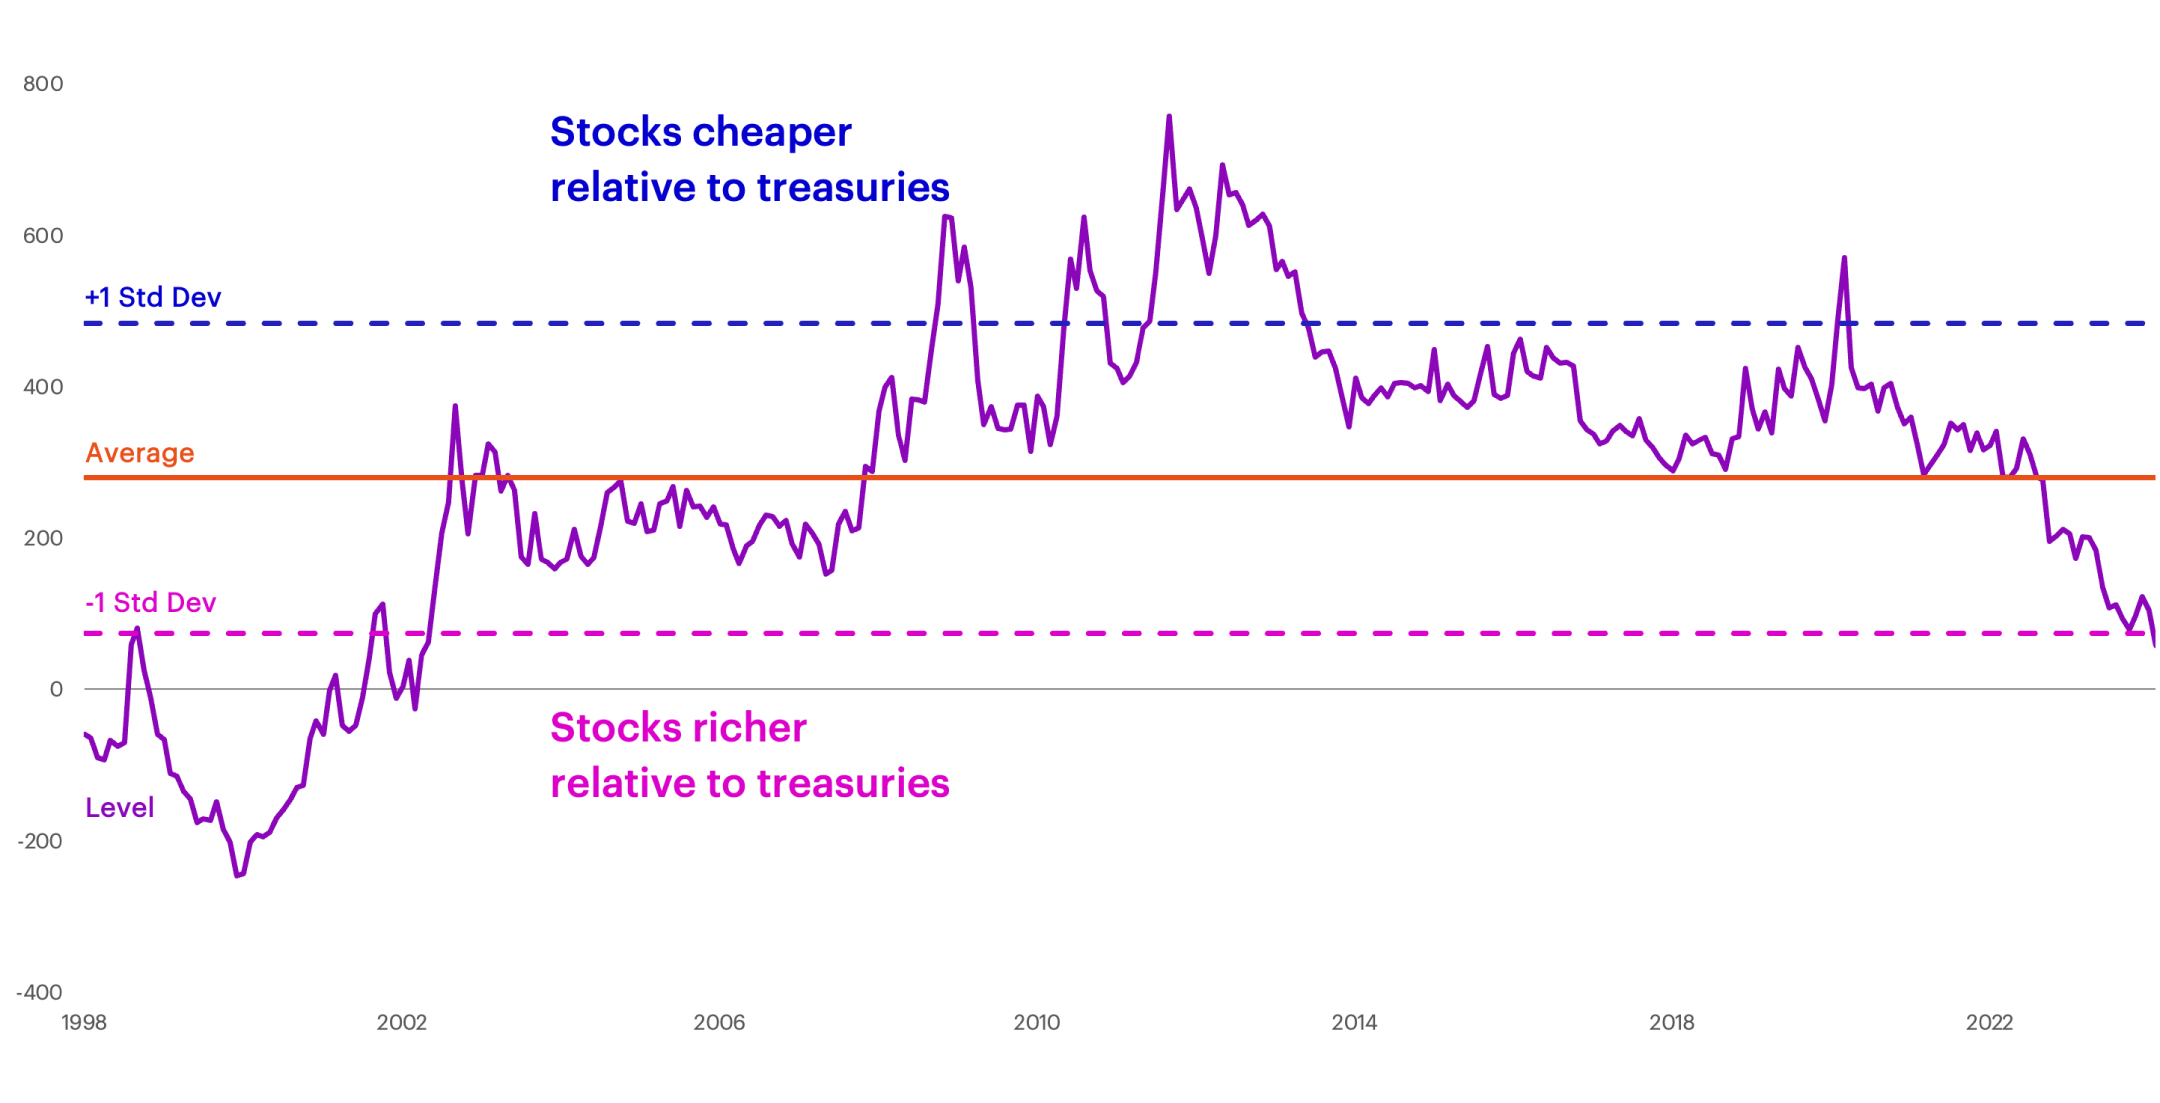
US Equity Valuation
S&P 500 Equity Risk Premium
Bonds continue to appear attractive relative to equities
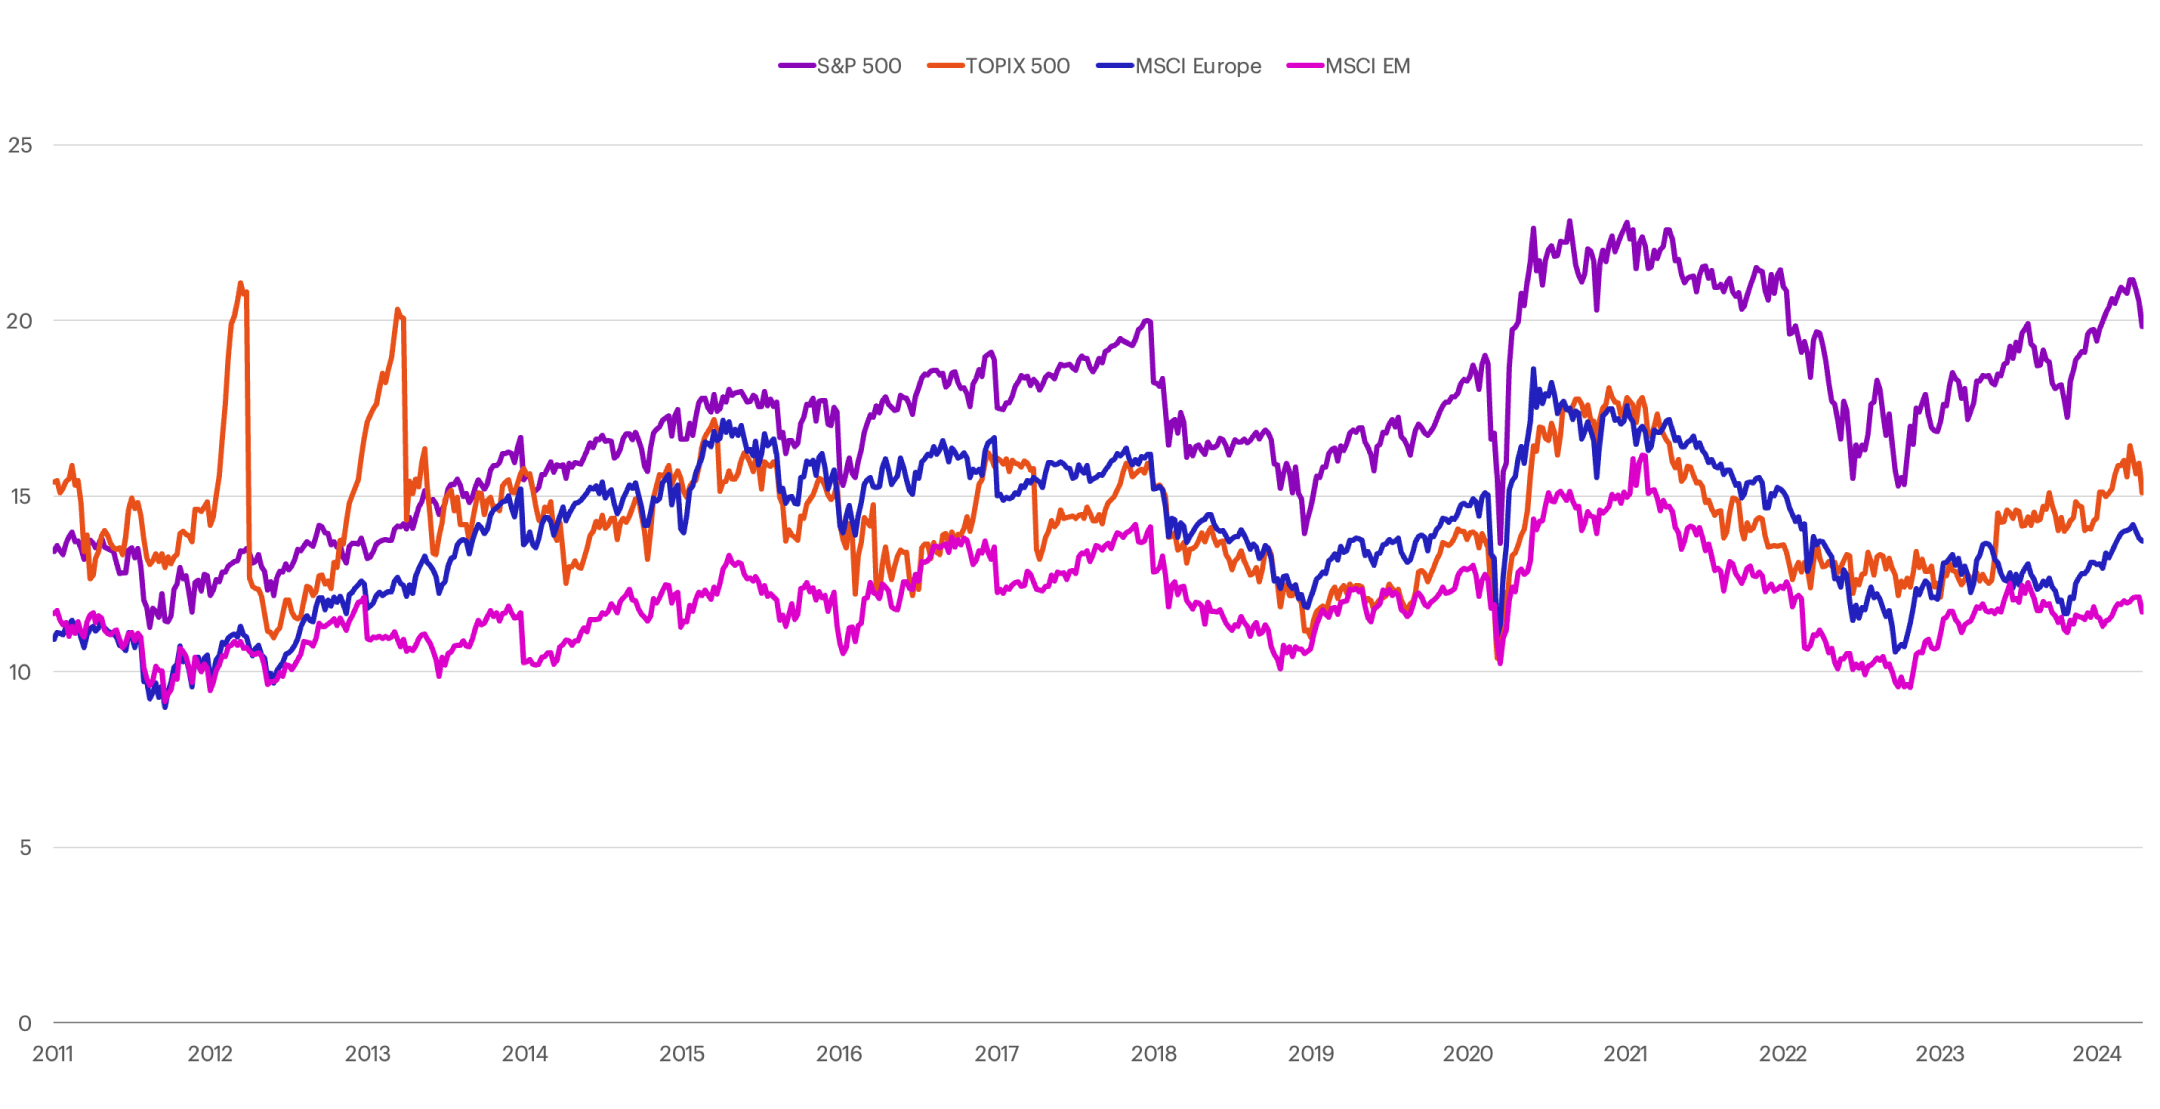
P/E Relative to Rest of World
The S&P 500 remains expensive relative to the rest of the world
US Fixed Income Valuation
Last week, the 10-year Treasury yield increased 4 bps to 4.66% and the two-year Treasury yield was flat at 4.99%
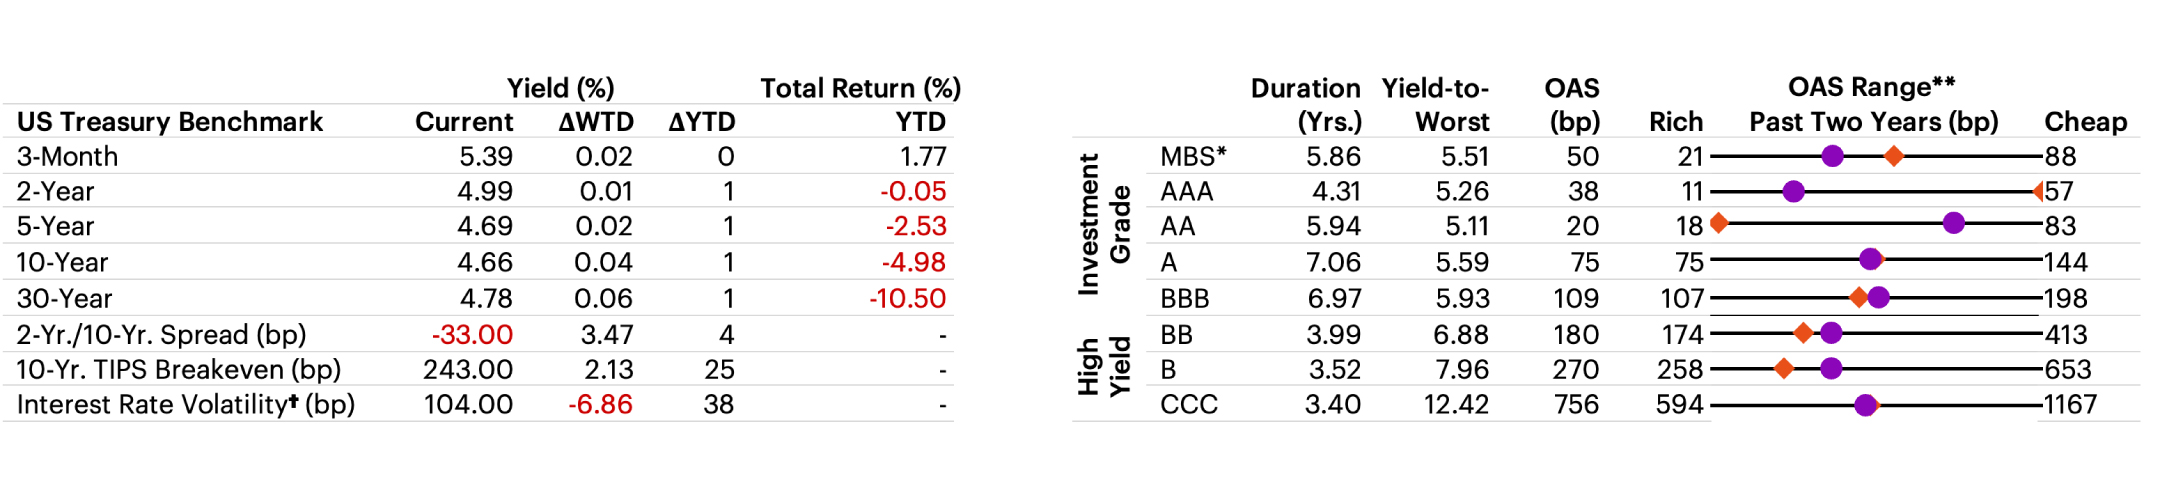
†Interest Rate Volatility as measured by ICE BofAML Option Volatility Estimate Index (MOVE); *Mortgage-backed securities (MBS) are debt obligations that represent claims to the cash flows from pools of mortgage loans, most commonly on residential property. Mortgage loans are purchased from banks, mortgage companies, and other originators and then assembled into pools by a governmental, quasi-governmental, or private entity; **Options Adjusted Spread (OAS): A measurement of the spread of a fixed income security rate and the risk-free rate of return, which is adjusted to take into account an embedded option
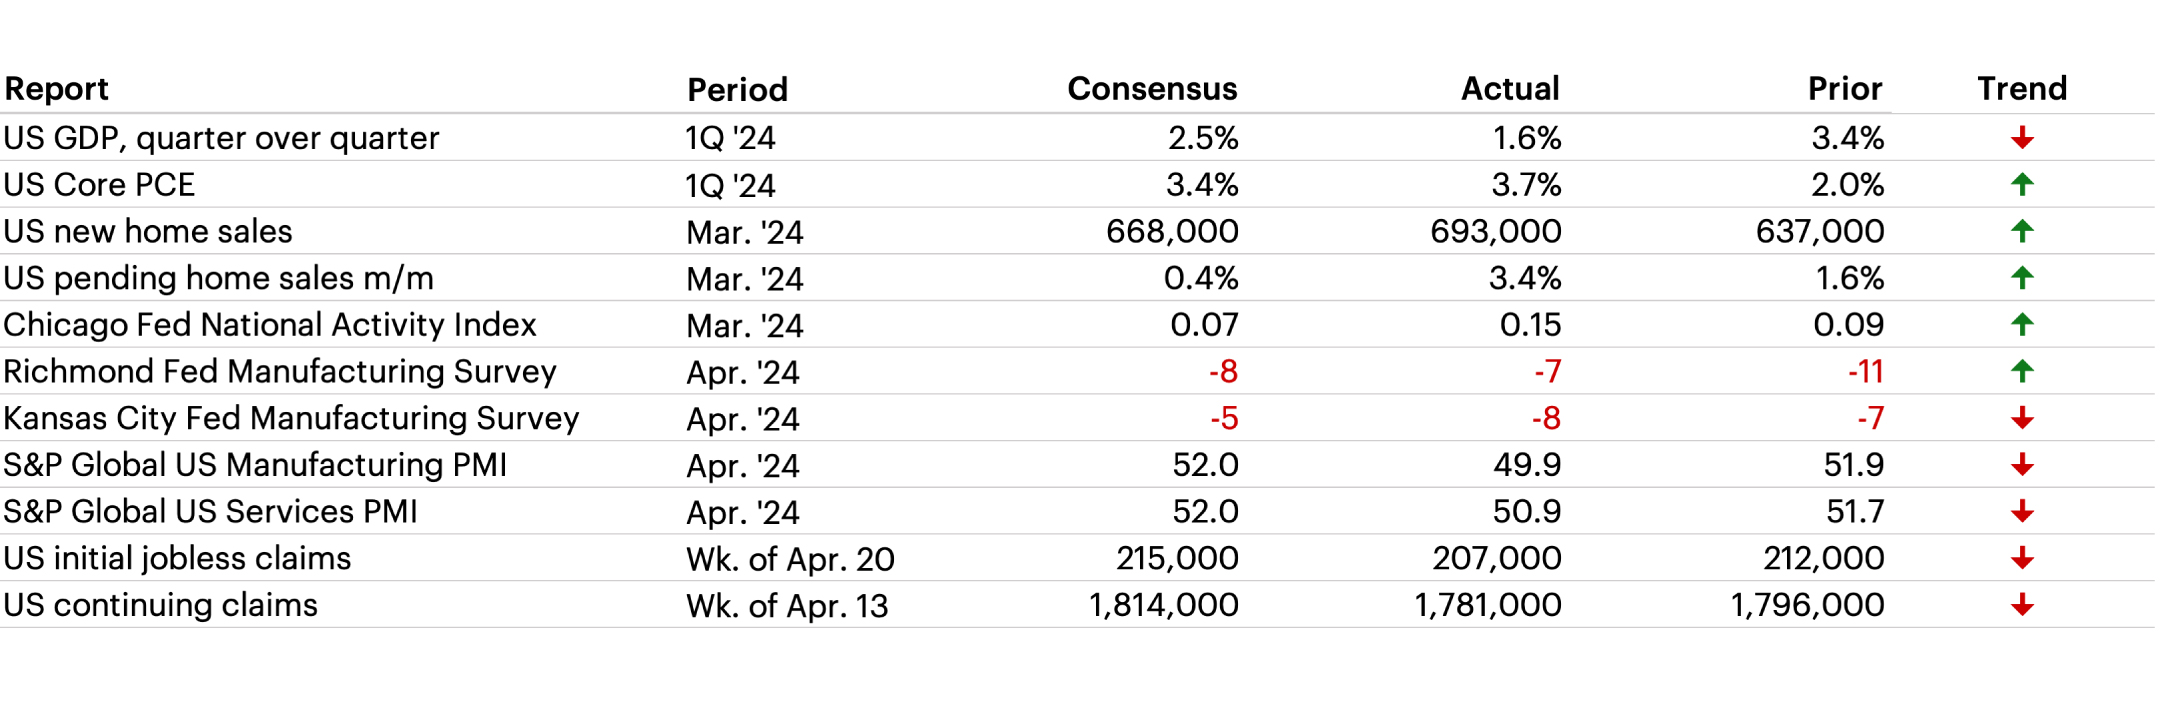
Latest Economic Data
GDP grew at a 1.6% annualized rate in Q1 2024, well below the consensus economist estimate of 2.5%. What’s more, the core PCE price index rose at a 3.7% annualized pace in Q1, exceeding the median estimate of 3.4%. Taken together, the data raised the specter of “stagflation,” which is seen as a negative backdrop for risk assets. The data also further muddles the timeline for the Fed to begin lowering interest rates.
Sources: Bloomberg, FactSet, Morgan Stanley Wealth Management Global Investment Committee
The Week Ahead
- Dallas Fed Manufacturing Activity Survey at 10:30 AM ET
- Domino’s Pizza Report Earnings
- Employment Cost Index at 8:30 AM ET
- FHFA House Price Index MoM at 9:00 AM ET
- MNI Chicago PMI at 9:45 AM ET
- Conference Board Consumer Confidence Index at 10:00 AM ET
- Amazon Reports Earnings
- ADP Employment Change at 8:15 AM ET
- US Construction Spending at 10:00 AM ET
- JOLTS Job Openings at 10:00 AM ET
- ISM Manufacturing PMI at 10:00 AM ET
- FOMC Meeting at 2:00 PM ET
- Mastercard Reports Earnings
- Challenger Job Cuts at 7:30 AM ET
- US Trade Balance at 8:30 AM ET
- US Nonfarm Productivity at 8:30 AM ET
- US Unit Labor Costs at 8:30 AM ET
- US Initial Jobless Claims at 8:30 AM ET
- US Continuing Claims at 8:30 AM ET
- US Factory Orders at 10:00 AM ET
- Apple Reports Earnings
- Change in Nonfarm Payrolls at 8:30 AM ET
- US Unemployment at 8:30 AM ET
- ISM Services Index at 10:00 AM ET
Index benchmarks
Cross-Asset Performance
S&P 500: A market capitalization-weighted index of 500 widely held stocks often used as a proxy for the stock market. It measures the movement of the largest issues. Standard and Poor's chooses the member companies for the 500 based on market size, liquidity and industry group representation. Included are the stocks of industrial, financial, utility, and transportation companies. Since mid-1989, this composition has been more flexible and the number of issues in each sector has varied. The returns presented for the S&P 500 are total returns, including the reinvestment of dividends each month.
Dow Jones Industrial Average: Computed by summing the prices of the stocks of 30 companies and then dividing that total by an adjusted value—one which has been adjusted over the years to account for the effects of stock splits on the prices of the 30 companies. Dividends are reinvested to reflect the actual performance of the underlying securities.
NASDAQ Composite: Measures the performance of all issues listed in the NASDAQ Stock Market, except for rights, warrants, units, and convertible debentures. Morningstar reports the NASDAQ Composite as a price return.
MSCI Europe IMI: This index captures large, mid and small cap representation across 16 Developed Markets countries in Europe. With 1,372 constituents, the index covers approximately 99% of the free float-adjusted market capitalization across the Developed Markets countries of Europe.
MSCI Japan IMI: This index is designed to measure the performance of the large, mid and small cap segments of the Japan market. With 1,134 constituents, the index covers approximately 99% of the free float-adjusted market capitalization in Japan.
MSCI EM (Emerging Markets) Index: A free float-adjusted market-capitalization index that is designed to measure equity market performance of emerging markets. The MSCI Emerging Markets Index consists of the following 23 emerging market country indexes: Brazil, Chile, China, Colombia, Czech Republic, Egypt, Greece, Hungary, India, Indonesia, Korea, Malaysia, Mexico, Peru, Philippines, Poland, Qatar, Russia, South Africa, Taiwan, Thailand, Turkey and United Arab Emirates. For more information, visit the MSCI web site.
MSCI EAFE (Europe, Australasia, Far East) Index: A free float-adjusted market-capitalization index that is designed to measure the equity market performance of developed markets, excluding the U.S. and Canada. The MSCI EAFE Index consists of the following 21 developed market country indexes: Australia, Austria, Belgium, Denmark, Finland, France, Germany, Hong Kong, Ireland, Israel, Italy, Japan, the Netherlands, New Zealand, Norway, Portugal, Singapore, Spain, Sweden, Switzerland, and the United Kingdom. For more information, visit the MSCI website.
S&P 400 Index: This index provides investors with a benchmark for mid-sized companies. The index measures the performance of mid-sized companies, reflecting the distinctive risk and return characteristics of this market segment.
S&P 600 Index: This index measures the small-cap segment of the U.S. equity market. The index is designed to track companies that meet specific inclusion criteria to ensure that they are liquid and financially viable.
S&P 500 Growth: This index is a style-concentrated index designed to track the performance of stocks that exhibit the strongest growth characteristics by using a style-attractiveness-weighting scheme.
S&P 500 Value: This index is a style-concentrated index designed to track the performance of stocks that exhibit the strongest value characteristics by using a style-attractiveness-weighting scheme.
Bloomberg Commodity Index: Made up of 22 exchange-traded futures on physical commodities. The index currently represents 20 commodities, which are weighted to account for economic significance and market liquidity.
US Trade-Weighted Dollar Index: A weighted average of the foreign exchange value of the US dollar against a subset of the broad index currencies that circulate widely outside the US.
MSCI Emerging Markets Currency Index: sets the weights of each currency equal to the relevant country weight in the MSCI Emerging Markets Index.
Bloomberg US Aggregate Index: The US Aggregate Index covers the dollar-denominated investment-grade fixed-rate taxable bond market, including Treasuries, government-related and corporate securities, MBS pass-through securities, asset-backed securities, and commercial mortgage-based securities. These major sectors are subdivided into more specific sub-indices that are calculated and published on an ongoing basis. Total return comprises price appreciation/depreciation and income as a percentage of the original investment. This index is rebalanced monthly by market capitalization.
Bloomberg US Corporate High Yield Bond Index: This index is composed of fixed-rate, publicly issued, non-investment grade debt.
S&P Sector Performance
The S&P 500 Consumer Discretionary sector comprises those companies included in the S&P 500 that are classified as members of the consumer discretionary sector.
The S&P 500 Consumer Staples sector comprises those companies included in the S&P 500 that are classified as members of the consumer staples sector.
The S&P 500 Energy sector comprises those companies included in the S&P 500 that are classified as members of the energy sector.
The S&P 500 Financials sector comprises those companies included in the S&P 500 that are classified as members of the financial sector.
The S&P 500 Health Care sector comprises those companies included in the S&P 500 that are classified as members of the health care sector.
The S&P 500 Industrials Sector comprises those companies included in the S&P 500 that are classified as members of the industrials sector.
The S&P 500 Information Technology Sector comprises those companies included in the S&P 500 that are classified as members of the information technology sector.
The S&P 500 Materials Sector comprises those companies included in the S&P 500 that are classified as members of the materials sector.
The S&P 500 Communications Services Sector comprises those companies included in the S&P 500 that are classified as members of the telecommunications services sector.
The S&P 500 Utilities Sector comprises those companies included in the S&P 500 that are classified as members of the utilities sector.
The S&P 500 Real Estate Sector comprises those companies included in the S&P 500 that are classified as members of the real estate sector.
US Equity Style Performance
Weekly and monthly style performance charts use Russell 1000, Russell Mid Cap, and Russell 2000 style indexes to represent large cap, mid cap, and small cap respectively.
Russell 1000: Consists of the 1000 largest companies within the Russell 3000 index. Also known as the Market-Oriented Index, because it represents the group of stocks from which most active money managers choose. The returns we publish for the index are total returns, which include reinvestment of dividends. Frank Russell Company reports its indexes as one-month total returns.
Russell 1000 Growth: Market-capitalization weighted index of those firms in the Russell 1000 with higher price-to-book ratios and higher forecasted growth values. The Russell 1000 includes the largest 1000 firms in the Russell 3000, which represents approximately 98% of the investable US equity market.
Russell 1000 Value: Market-capitalization weighted index of those firms in the Russell 1000 with lower price-to-book ratios and lower forecasted growth values. The Russell 1000 includes the largest 1000 firms in the Russell 3000, which represents approximately 98% of the investable US equity market.
Russell 2000: Consists of the smallest 2000 companies in the Russell 3000 Index, representing approximately 7% of the Russell 3000 total market capitalization. The returns we publish for the index are total returns, which include reinvestment of dividends.
Russell 2000 Growth: Market-weighted total return index that measures the performance of companies within the Russell 2000 Index having higher price-to-book ratios and higher forecasted growth values. The Russell 2000 Index includes the 2000 firms from the Russell 3000 Index with the smallest market capitalizations. The Russell 3000 Index represents 98% of the of the investable US equity market.
Russell 2000 Value: Market-weighted total return index that measures the performance of companies within the Russell 2000 Index having lower price-to-book ratios and lower forecasted growth values. The Russell 2000 Index includes the 2000 firms from the Russell 3000 Index with the smallest market capitalizations. The Russell 3000 Index represents 98% of the of the investable US equity market.
Russell Midcap: Measures the performance of the 800 smallest companies in the Russell 1000 Index, which represent approximately 25% of the total market capitalization of the Russell 1000 Index. As of the latest reconstitution, the average market capitalization was approximately $4.0 billion; the median market capitalization was approximately $2.9 billion. The largest company in the index had an approximate market capitalization of $12 billion.
Russell Midcap Growth: Market-weighted total return index that measures the performance of companies within the Russell Midcap Index having higher price-to-book ratios and higher forecasted growth values. The Russell Midcap Index includes firms 201 through 1000, based on market capitalization, from the Russell 3000 Index. The Russell 3000 Index represents 98% of the of the investable U.S. equity market.
Russell Midcap Value: Market-weighted total return index that measures the performance of companies within the Russell Midcap Index having lower price-to-book ratios and lower forecasted growth values. The Russell Midcap Index includes firms 201 through 1000, based on market capitalization, from the Russell 3000 Index. The Russell 3000 Index represents 98% of the of the investable U.S. equity market.
P/E Relative to Rest of World
TOPIX: This free-floated-adjusted index tracks all domestic companies of the exchange’s First Section.
US Fixed Income Valuation
ICE BofAML Option Volatility Estimate Index (MOVE): A yield curve-weighted index of the normalized implied volatility on one-month treasury option.
How can E*TRADE from Morgan Stanley help?
E-commerce
Check out investing opportunities in the surging business of online and mobile retailing.
Technology Pacesetters
Learn how to invest in leading technology innovators that are looking to change the way the world works.
Premium Savings Account
Boost your savings with 4.25% APY1
With rates 9X the national average2, plus FDIC protection up to $500,0003, and more.
Need help getting started with bonds?
To get started with bonds, visit our comprehensive Bond Resource Center. Use our Advanced Screener to quickly find the right bonds for you. Or call our Fixed Income Specialists at (877-355-3237) if you need additional help.