Signaling a breakout
- CLAR: Tight consolidation formed over the past several weeks
- Breakout potential? Options volatility high despite tightening range
- Open interest unusually high Monday morning
Just as using the wrong tool can make what should be an easy repair job an exercise in frustration, using the wrong strategy can ruin a spot–on market forecast.
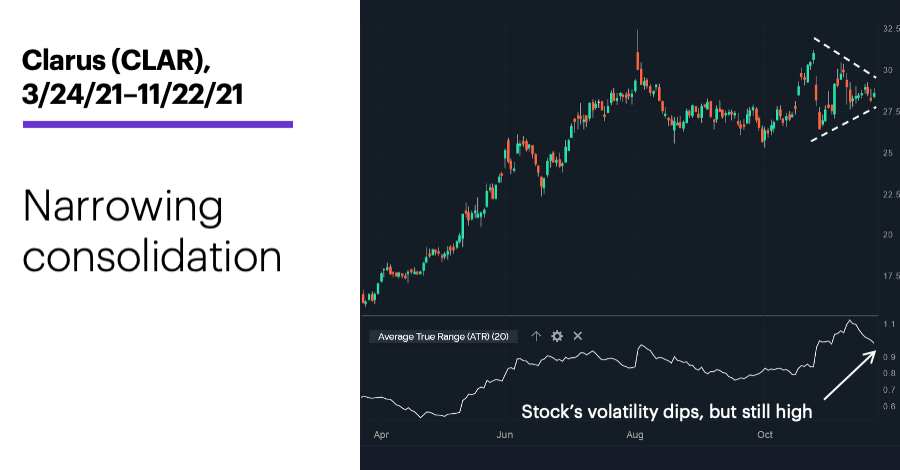
Yesterday provided a good example in outdoor retailer Clarus (CLAR). Since hitting an all-time closing high on October 25, CLAR had traded in an increasingly tight consolidation. While the stock swung $4.79 (a little more than 15%) in the first two days of forming its triangular congestion, as of early yesterday morning its average two-day range over the past week had shrunk to around $0.70:
Source: Power E*TRADE (For illustrative purposes. Not a recommendation.)
Consolidations like this, by definition, represent declines in volatility—a fact also reflected at the bottom of the chart by the downturn in the 20-day average true range (ATR) indicator, which simply measures the amount of day-to-day price movement, averaged over a certain period (in this case, 20 trading days).
While tightening consolidations often attract people looking for potential breakouts—and specifically, options traders wondering whether they can use a straddle or strangle to trade a move in either direction—the chart also shows that, despite the recent volatility contraction, CLAR’s ATR was still higher than it has been for several months. In other words, the stock may have gotten less active over the past week or two, but it was still relatively volatile from a longer-term perspective.
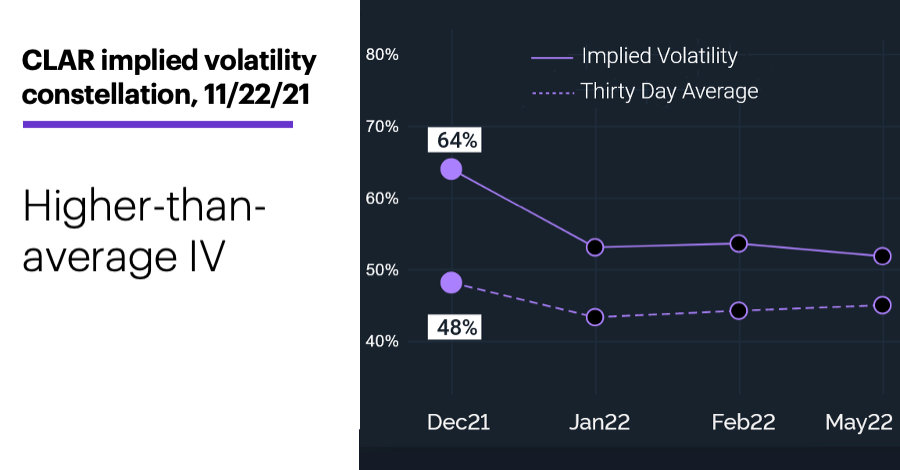
To understand why that may be important—especially for options traders—let’s look at CLAR’s options implied volatility (IV) as of Monday:
Source: Power E*TRADE (For illustrative purposes. Not a recommendation.)
Here we see that for the next several expirations, IV was well above its 30-day average (16 percentage points higher for the December options). Experienced options traders understand that high IV typically makes options more expensive, other pricing factors aside—and that can clutter the path to profitability for long–options strategies.
Also, some traders may have noticed that CLAR’s open interest (OI)—the number of unclosed options positions—was more than five times average yesterday morning. All else being equal, high or increasing OI means more traders are getting into a stock’s options than getting out of them—a potential sign those traders may expect the underlying stock to do something.
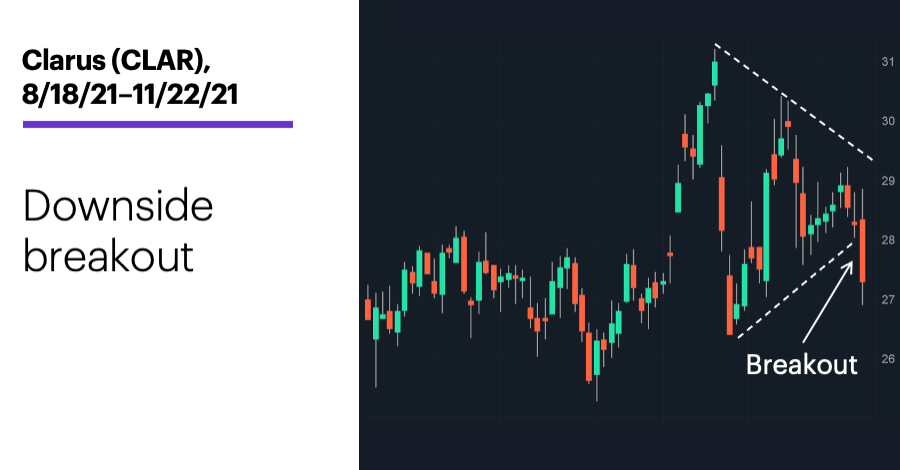
If the combination of increased options commitments and a market expecting future volatility to be higher than usual sounds like a potential recipe for a breakout, that’s exactly what happened later yesterday morning in CLAR:
Source: Power E*TRADE. (For illustrative purposes. Not a recommendation.)
But that’s often the rub in this type of situation: When many people are anticipating a breakout, the options market may price in those expectations with high IV, which typically makes options more expensive.
In this case, that may have been particularly true in the December options, which had the highest relative IV of the next few expirations. Also, because those options were the closest to expiration, they’d lose time value faster than the more distant options, which means traders who wanted to use them in a straddle or strangle would be potentially purchasing overpriced options that would lose value at an accelerated rate over the next few weeks.
So, while traders who expected a breakout was imminent in CLAR were correct, those who bought straddles or strangles may have found themselves at an immediate disadvantage.
The takeaway: The first step toward making money is to avoid losing money, and one of the best ways to do that is to know when a particular strategy isn’t likely to put the odds on your side.
Market Mover Update: BioNTech (BNTX) and Moderna (MRNA) both jumped higher on Monday, and both have rallied more than 20% over the past week (see “Vax stocks take their shots”).
Blink Charging’s (BLNK) sharp drop yesterday bumped up put premiums, and took some of the air out call options that had gotten pumped up after the stock’s upswing last week (see “Legging into a strangle”).
Electronic Arts (EA) also started the week on the downside, falling more than 5% intraday and edging closer to its 2021 lows around $125 (see “Games traders play”).
Today’s numbers include (all times ET): PMI Composite Flash (9:45 a.m.).
Today’s earnings include: J.M. Smucker (SJM), HP (HPQ), Analog Devices (ADI), Best Buy (BBY), Dollar Tree (DLTR), Burlington Stores (BURL), Dick's Sporting Goods (DKS), Nordstrom (JWN), Gap (GPS).
Click here to log on to your account or learn more about E*TRADE's trading platforms, or follow the Company on Twitter, @ETRADE, for useful trading and investing insights