Intraday swings and volatility pings
- The S&P 500 formed a rare one-day pattern on Wednesday
- Similar days have occurred during exceptionally volatile periods
- Popular market volatility gauge hit highest levels since Feb.
Longtime traders would likely argue it’s not a good idea to attach too much significance to a single day’s price action. But once in while a day pops ups that offers some especially useful insights about the way markets work, even if it looks relatively inconspicuous at first glance.
The stock market’s behavior on Wednesday is a good example. The S&P 500 (SPX) closed down a little more than 1%— no doubt, a larger-than-average daily decline, but the index has closed down at least that much more than 1,600 other times since 1970, and more than 600 times over just the past decade.1
But the SPX didn’t just close down more than 1% on Wednesday, it did it after it was up more than 1% earlier in the day and had traded above Tuesday’s high. It also ended the day below its open, again emphasizing that traders were more bearish at the end of the session than they were at its beginning:
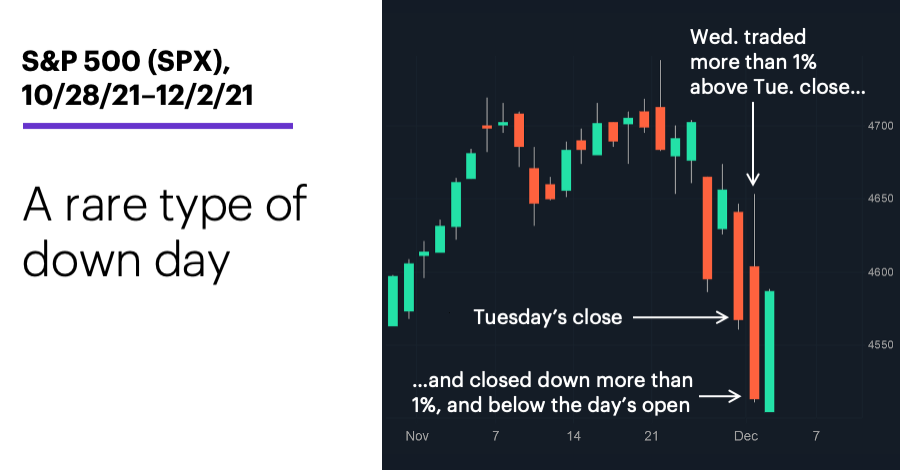
Source: Power E*TRADE (For illustrative purposes. Not a recommendation.)
When you factor in these other characteristics, that universe of roughly 1,600 1%-plus down days shrinks to just 37, which means such days have occurred, on average, less than once a year.
For some traders, that slim sample size would be enough to disqualify the pattern from analysis—which is unfortunate, because the typical price action after it this suggests it may have something to say about the market’s condition.
Take a look at what the SPX did, on average, in the 10 trading days (two weeks) after days like Wednesday vs. its historical average 10-day return:
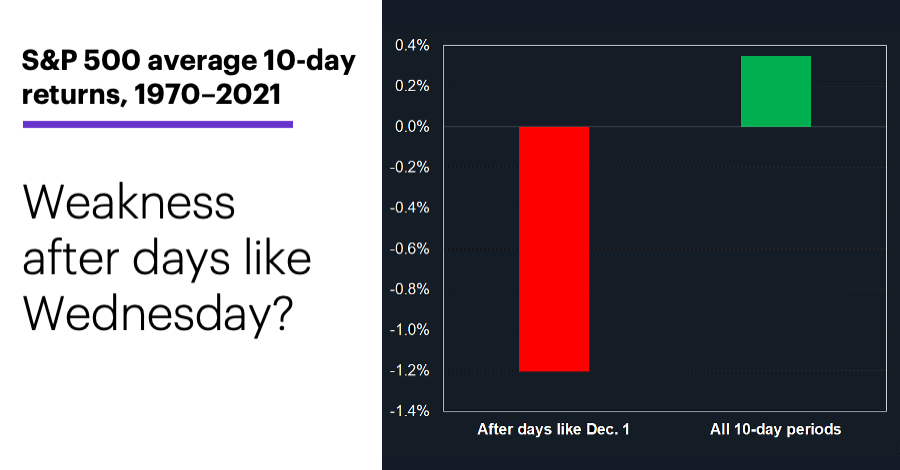
Source: Power E*TRADE (For illustrative purposes. Not a recommendation.)
While that’s a significant difference, it’s also important to point out the market didn’t continue to fall after every one of these days—the SPX was higher in 16 of the 37 cases (43% of the time) at the 10-day mark, although that’s well short of the index’s long-term record of gaining ground in 59% of 10-day periods. Also, the SPX closed lower the day after the pattern more often than not, so yesterday’s big rebound—which, unlike Wednesday’s, didn’t evaporate by the close—means the market wasn’t necessarily following the historical script.
But here’s some additional contextual information some traders may find interesting. The four most recent examples occurred during some of the more unique volatility episodes of recent years: March 2020 (the COVID sell-off), December 2018 (worst December since the Great Depression, amid Brexit and China-slowdown concerns), August 2011 (European debt crisis and the first-ever downgrade of US debt), and May 2010 (the aftermath of the “Flash Crash”).
In other words, even though the current pullback isn’t yet particularly deep, some of the market’s below-the-surface behavior may have suggested its uncertainty level this week was well above average.
Market Mover Update: In another sign of heightened market anxiety, on Wednesday the Cboe Volatility Index (VIX) hit its highest point (32.61 intraday) since February 1, just three days after it made one of its biggest one-day percentage up moves (+54%) of the past 30 years.
Today’s numbers include (all times ET): Employment Report (8:30 a.m.), PMI Composite Final (9:45 a.m.), Factory Orders (10 a.m.), ISM Services Index (10 a.m.).
Today’s earnings include: Big Lots (BIG).
Click here to log on to your account or learn more about E*TRADE's trading platforms, or follow the Company on Twitter, @ETRADE, for useful trading and investing insights
1 All figures based on daily S&P 500 (SPX) price data, 1970–2021. Supporting document available upon request.