VIX for traders
- The VIX estimates market volatility; typically moves contrary to stock prices
- Based on the implied volatility of S&P 500 options
- Traders often use it as a contrarian indicator
What did the VIX do today?
That’s a question often on the lips of stock traders, especially when the market surf is rough—as it has been for much of this year.
There’s a good reason traders keep tabs on this indicator. The Cboe Volatility Index (VIX) is probably the most widely watched market “fear gauge,” and its basic behavior is straightforward enough:
●When stocks drop, and traders think they could drop more, the VIX typically reflects that elevated fear by spiking higher, as it did during the February–March COVID sell-off, and to a lesser degree during the June and September pullbacks.
●When the market rallies, the VIX tends to decline—as it generally did from August 2019–January 2020—reflecting low levels of market anxiety.
But there’s a little more to the story than “rising VIX means more fear, falling VIX means less fear.”
First, what does the VIX measure—that is, how does it define “fear?” Technically, the VIX is an estimate of the near-term (approximately 30-day) future volatility of the S&P 500 (SPX)—the higher the VIX, the higher the expected SPX volatility, and vice versa. Without delving into the math, the VIX reflects the implied volatility (IV) of a wide range of SPX call and put options,1 which tends to move in the opposite direction of the index itself: When the market falls, IV tends to increase (especially for put options); when the market rallies, IV typically decreases.
For most traders, of course, the question is not whether the VIX accurately forecasts volatility, but whether it helps forecast the stock market’s direction. Contrary to popular belief, there’s no evidence that any specific VIX level objectively separates “high” from “low” volatility or implies a certain move in the stock market. In other words, it’s impossible to say, “The VIX hit x yesterday—that means fear of increased volatility is high and the market will drop over the next few weeks.”
Here are three basic VIX principles to keep in mind:
1. The VIX is an estimate of future market volatility. Like all estimates, it has its limitations.
2. Even an accurate volatility forecast does not necessarily translate easily into a tradable stock-market forecast.
3. That said, many traders find the VIX most useful as a contrarian indicator—that is, when it’s most likely to be “wrong.” For example, extremely high VIX readings, which are forecasts of higher future volatility—i.e., fear of falling stock prices—often accompany significant market lows (as was the case in March). Extremely low VIX readings (especially sustained low readings), which are forecasts of low future market volatility, sometimes occur near market tops, before pullbacks or downturns.
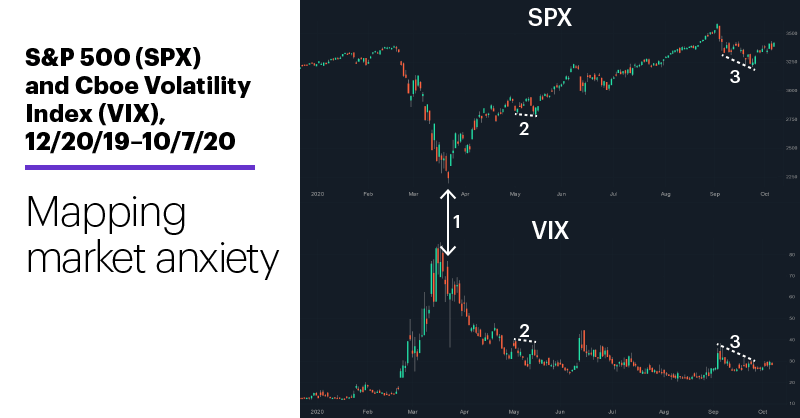
Also, in practice many traders look for opportunities when the VIX and the SPX diverge from their typical relationship (SPX up/VIX down, and vice versa). When that happens, it can signal the potential for a reversal—if only a short-lived one—in the stock market. The following chart highlights a few of the more conspicuous examples of this type of behavior from this year:
Source: Power E*TRADE
Keeping in mind that the “normal” relationship is for the VIX to continue to increase when the SPX falls to increasingly lower levels (as it did in late February and early March), here’s how things played out at these key points:
1. When the SPX hit its COVID sell-off low March 23—at which point it had fallen more than 10% in five days—the VIX closed 26% lower than it had five days earlier. Typically, a sharp sell-off like this would be expected to trigger higher VIX readings. The fact that it didn’t suggested fear-based selling was potentially reaching an exhaustion point.
2. In mid-May when the SPX fell to a lower low, the VIX made a lower high, suggesting traders were less fearful in mid-May even though stock prices were lower than they had been in early May. The SPX then rallied 14.3% from May 13 to June 8.
3. The same pattern played out in September, and was again followed by a market upturn—which, as of yesterday, was still intact.
Bottom line, when the VIX doesn’t do what it “should,” it can highlight potential SPX reversal points. Just as it’s always darkest before the dawn, the market sometimes bottoms when the fear that it will fall is at its most extreme.
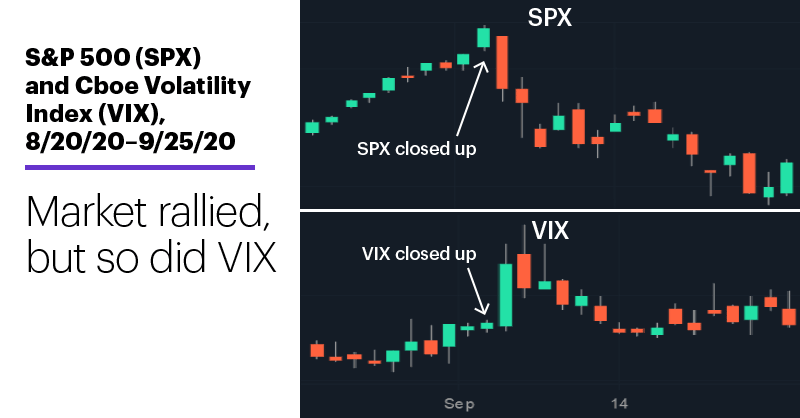
The following chart shows the flipside of this dynamic—an increase in the VIX, instead of a decline, when the SPX rallied to a new long-term high. On the final day of the rally—when the SPX gained 1.5% to hit a new record high on September 2—the VIX also closed higher, indicating anxiety had increased even though the market posted a strong gain:
Source: U.S. Census Bureau
The fact that this signal was followed immediately by a sharp sell-off and lengthy (nearly three-week) total decline is more the exception than the rule, since this type of VIX signal, when correct, tends to be followed by briefer and less-severe price drops.2 But they can nonetheless be useful for shorter-term traders, regardless of whether they’re already long or looking to go short.
There’s often a wide gap between theory and practice in the markets—between generalized rules and the nuts-and-bolts of placing trades and managing risk. Traders should make sure they fully understand any tool they use, and not rely on passed-down “wisdom” that sometimes perpetuates mistaken assumptions instead of market realities.
And to go back to the question that started this article: Although yesterday wasn’t a new long-term high for the SPX (like September 2), it was a big up day—but the VIX closed higher instead of lower.
Market Mover Update: It was just the first day of the week, but on Monday small cap stocks lagged the rest of the market, with the Russell 2000 (RUT) gaining less than half as much as the SPX.
Today’s numbers (all times ET): NFIB Small Business Optimism Index (6 a.m.), Consumer Price Index, CPI (8:30 a.m.).
Today’s earnings include: Citigroup (C), JPMorgan Chase (JPM), BlackRock (BLK), Fastenal (FAST), Johnson & Johnson (JNJ).
Click here to log on to your account or learn more about E*TRADE's trading platforms, or follow the Company on Twitter, @ETRADE, for useful trading and investing insights.
1 Cboe.com. Cboe VIX White Paper Cboe Volatility Index. 2019.
2 Based on S&P 500 (SPX) and Cboe Volatility Index (VIX) daily prices from 5/27/97–9/4/20. VIX-SPX pattern (141 examples): A day the SPX hits its highest high and closing price in at least 50 trading days, when the VIX closes higher a day after closing lower. Supporting document available upon request.