Traders make their moves
- BBIO put volume 36 times average last week
- Stock has consolidated since last week’s swings
- July could be key to stock’s near-term
After rallying more than 5% on June 27 and 10% on June 28, BridgeBio (BBIO) took a step back on June 30, falling more than 6% intraday as its put volume topped 17,000—more than 36 times the daily average.
As the stock slipped from a nearly four-month intraday high of $18.18 to below $17 that day, most of the options activity was taking place in the July puts, with particularly heavy volume in four out-of-the-money strikes:
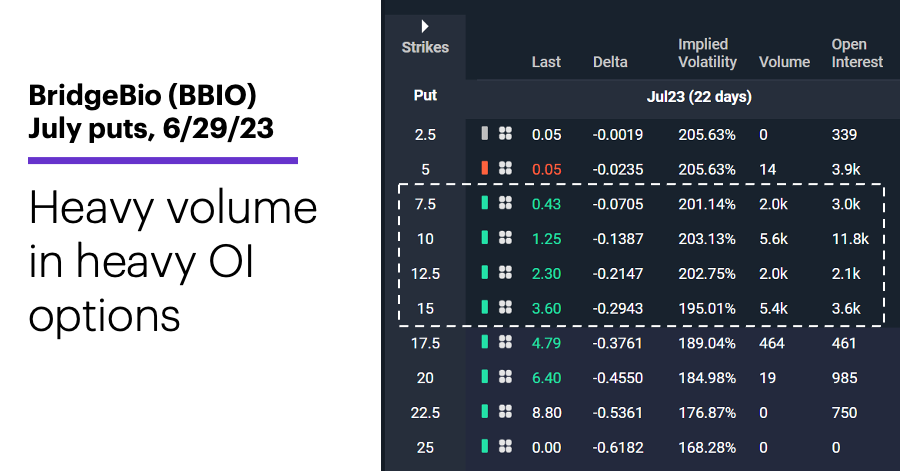
Source: Power E*TRADE. (For illustrative purposes. Not a recommendation.)
There was also notable volume in two September contracts: 1,000 of the $10 puts and 548 of the $12.50 puts.
Those were conspicuous strike prices, since they also happened to be the ones with the heaviest open interest (OI). Before looking into what positions look like a week later, it’s worth delving into why this flurry of activity may have taken place at all.
Later this month, the Street expects BBIO to release long-awaited clinical trial results for its heart-disease drug, Acoramidis. Such test results often trigger volatile price moves, but in this case, there’s a particularly interesting back story. This is actually the second go-round for Acoramidis. BridgeBio released trial results in late-December 2021 that showed the drug failed to significantly outperform a placebo. The stock tumbled 72% (from $40.62 to $11.38) in one day.
The following chart shows BBIO has consolidated since last week’s surge, and is currently trading a little below its March high—which was as high as the stock had been since the December 2021 breakdown (the weekly inset shows prices since the stock began trading in June 2019):
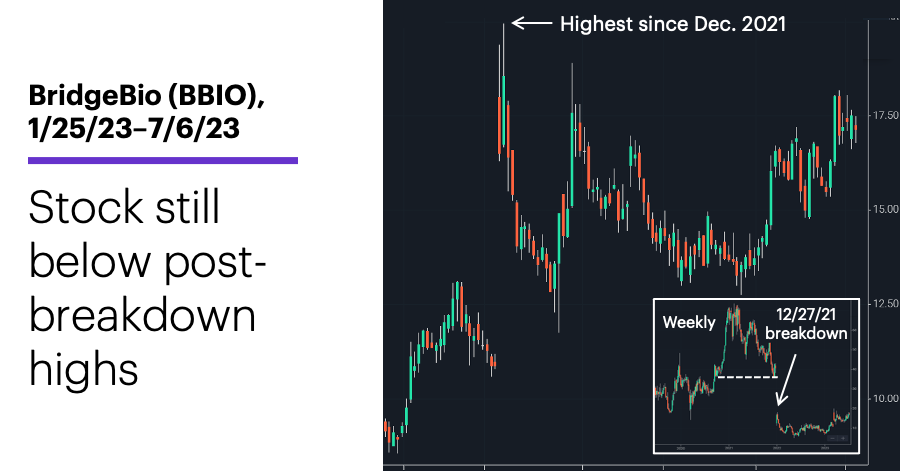
Source: Power E*TRADE. (For illustrative purposes. Not a recommendation.)
Meanwhile, OI in all of last week’s most active BBIO options increased across the board. As of Thursday:
•July $7.5 puts down to 2,900
•July $10 puts down to 3,500 (after jumping to 15,500 on July 29)
•July $12.50 puts up to 2,800
•July $15 puts down to 3,300
•September $10 puts up to 1,000—plus volume of 5,100 on Thursday
•September $12.50 puts up to 550
Meanwhile, OI in the August $10 puts increased to 19,800, and OI in the August $15 puts stood at 12,200. In other words, while traders may have shifted their holdings to different strike and expirations over the past week, for the most part they appear to have expanded their net positions in BBIO puts.
Will the second time be the charm for Acoramidis? No one knows what the drug’s follow-up trial results will reveal, but recent activity in BBIO’s stock and options suggests traders are giving serious thought to what could happen.
Today’s numbers include (all times ET): Employment Report (8:30 a.m.), EIA Natural Gas Report (10:30 a.m.).
Today’s earnings include: AZZ (AZZ).
Click here to log on to your account or learn more about E*TRADE's trading platforms, or follow the Company on Twitter, @ETRADE, for useful trading and investing insights.