Traders forecast the range
- DOCU down more than 10% from Feb. high after 51% rally
- Earnings scheduled for next week
- Spread suggesting bigger move than implied volatility?
Like several other symbols on Thursday’s LiveAction scan for stocks with 30-day implied volatility (IV) higher than 30-day historical volatility (HV), DocuSign (DOCU) has an impending earnings release (next Thursday, March 9).
While HV measures past volatility, IV estimates future volatility—and with a potentially volatility-inducing event on the horizon, it made sense the options market expected DOCU and the other stocks to be more volatile than they had been in the near past.
What made DOCU interesting was that it highlighted some differences in the way the options market was forecasting how much the stock would possibly move. Since June 2018, DOCU’s earnings-day price moves have ranged from +21.7% to -42.2%, with an average of +/-10.5%. Over the most recent four quarters, though, the average earnings move was +/-16.24% (yellow dashed line):
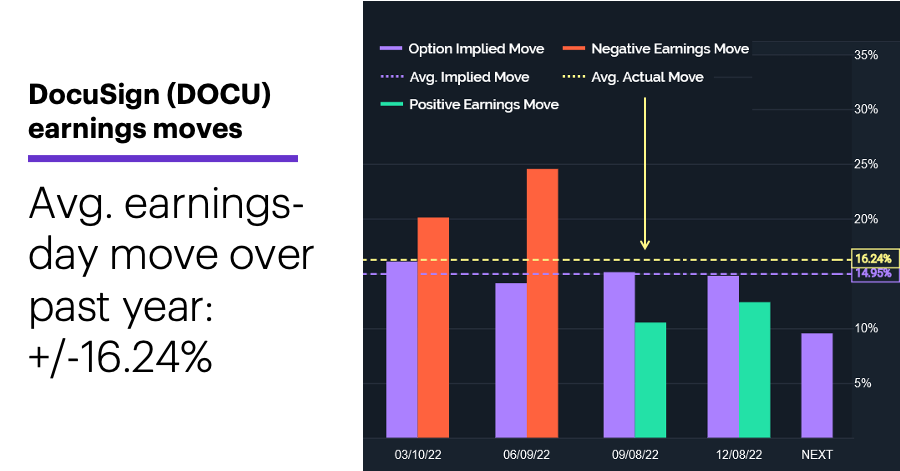
Source: Power E*TRADE. (For illustrative purposes. Not a recommendation.)
The purple columns show the options market’s estimated earnings moves (derived from IV). The actual moves are represented by the green (up) and red (down) columns. Yesterday, the options market was estimating the earning-day move would be a little less than 10%, up or down (final purple column, labeled “NEXT”). That’s much closer to the longer-term average than it is to the one-year average.
For a different perspective, we can check the price of an at-the-money (ATM) straddle—the combination of an ATM call and ATM put option with the same strike price and expiration. While a straddle is neutral about price direction (because it can profit regardless of whether the stock moves up or down), it is not neutral about volatility direction. A trader who is long the straddle (i.e., buys the call and put) needs volatility to increase—that is, needs the stock to move enough, higher or lower, to offset the combined cost of the two options.
Since a trader who sells a straddle profits from the opposite—a price move that is less than the combined premiums of the two options—the price of a straddle essentially represents a snapshot of how much options traders think a stock could move.
Yesterday morning, for example, when DOCU was trading around $59.80, the March ATM ($60) straddle was priced around $9.35. That means, at expiration, DOCU would need to be trading above $69.35 or below $50.65 (the strike price plus or minus the straddle premium) for the straddle buyer to realize a gain, while the straddle seller could profit only if the stock was trading between these two levels:
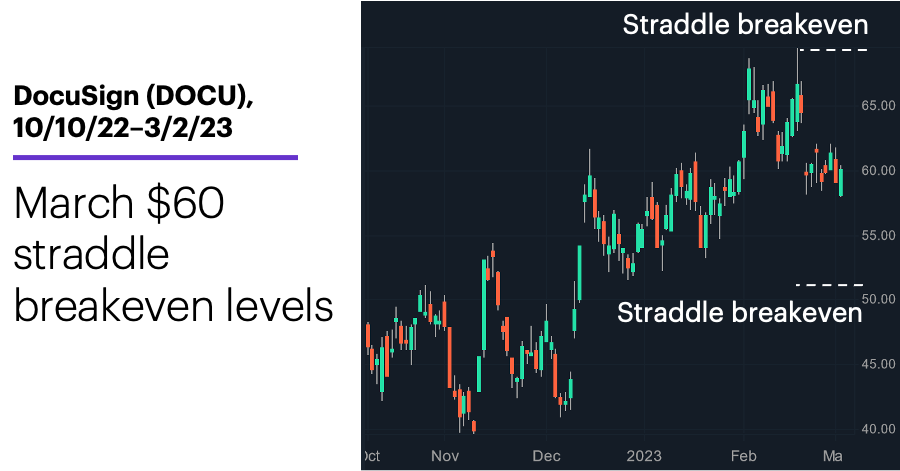
Source: Power E*TRADE. (For illustrative purposes. Not a recommendation.)
Interestingly, $9.35 represents a 15.6% move above or below $60—which is much closer to the +/-16.24% earnings-day move over the past year than it is to the longer-term average of 10.5%.
Of course, these prices will continue to change, but keeping tabs on straddle prices can be a good way to get quick, easy-to-grasp indication of how much traders think a stock is likely to move.
Today’s numbers include (all times ET): S&P Global Services (9:45 a.m.), ISM Services Index (10 a.m.).
Today’s earnings include: Hibbett (HIBB), Hurco (HURC).
Click here to log on to your account or learn more about E*TRADE's trading platforms, or follow the Company on Twitter, @ETRADE, for useful trading and investing insights.