What happens after down years?
- Down years less common than usual since 2003
- Multi-year losing streaks have been relatively rare
Bear-weary investors may be surprised to learn that, even though 2022 has been red for the US stock market, down years have been less frequent over the past couple of decades.
This year will mark the first negative year for the S&P 500 (SPX) since 2018, and just the fifth in the past two decades—a once-every-four-years average that was notably below the once-every-three-years average of the previous 75 years. Overall, the US market had 30 losing years between 1928–2021, ranging from essentially flat returns (-0.0032% in 2011) to deep corrections (-47.1% in 1931):1
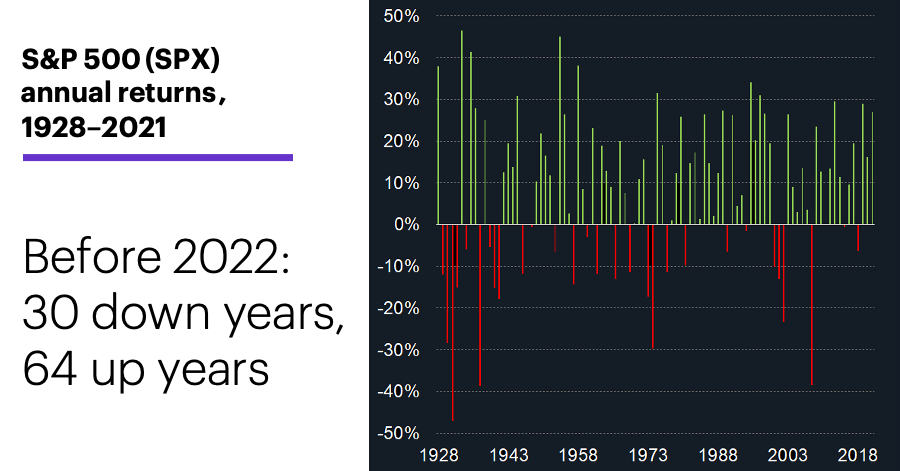
Source (data): Power E*TRADE. (For illustrative purposes. Not a recommendation.) Note: Pre-1957 “S&P 500” returns reflect the “Composite Index” published by Standard & Poor’s and its predecessor companies.
Most of the down years were one-offs: Since 1928, the US stock market has had just four multi-year losing streaks: 1929–1932, 1939–1941, 1973–1974, and 2000–2002. But as the chart shows, the Great Depression accounted for a disproportionate number of the market’s negative years—seven between 1929 and 1939. Over the past five decades, the SPX has had only 14 down years.
Overall, the market rallied—i.e., had a positive return—after 70% (21 of 30) down years. And excluding the 1930s, the market followed 18 of its 23 down years with up years (78% of the time). The SPX’s average return the year after a down year was 10%, with an average gain of 23.4% for the up years and an average loss of -23.7% for the down years.
While these historical statistics may seem to suggest 2023 has favorable odds of being an up year, favorable odds don’t represent a guarantee. Nor does the historical track record suggest next year will be a strong up year if stocks do, in fact, rally. (Morgan Stanley & Co. analysts have made the case that the US stock market may “tread water” next year, although it’s likely to make plenty of significant swings throughout the year.2)
Finally, market trends don’t fit neatly into calendar years. It remains to be seen whether the current bear market will extend into 2023—and if it does, by how much. “Tracking the bear” and “Follow the bouncing bear” outlined some of the key parameters of bear markets and bear-market rallies, respectively.
Today’s numbers include (all times ET): Final Q3 GDP estimate (8:30 a.m.), Weekly Jobless Claims (8:30 a.m.), Chicago Fed National Activity Index (8:30 a.m.), Leading Economic Indicators Index (10 a.m.), EIA Natural Gas Report (10:30 a.m.).
Today’s earnings include: Apogee Enterprises (APOG), CarMax (KMX), Limoneira (LMNR), Paychex (PAYX).
Click here to log on to your account or learn more about E*TRADE's trading platforms, or follow the Company on Twitter, @ETRADE, for useful trading and investing insights.
1 All figures reflect S&P 500 (SPX) annual returns, 1928–2021. Note: The S&P 500 did not expand to include 500 stocks until 1957. Here, pre-1957 “S&P 500” returns refer to the “Composite Index” published by Standard & Poor’s and its predecessor companies. Supporting document available upon request.
2 MorganStanley.com. 2023 Global Investment Outlook: A Year for Yield. 12/12/22.