Stock surges, options shift
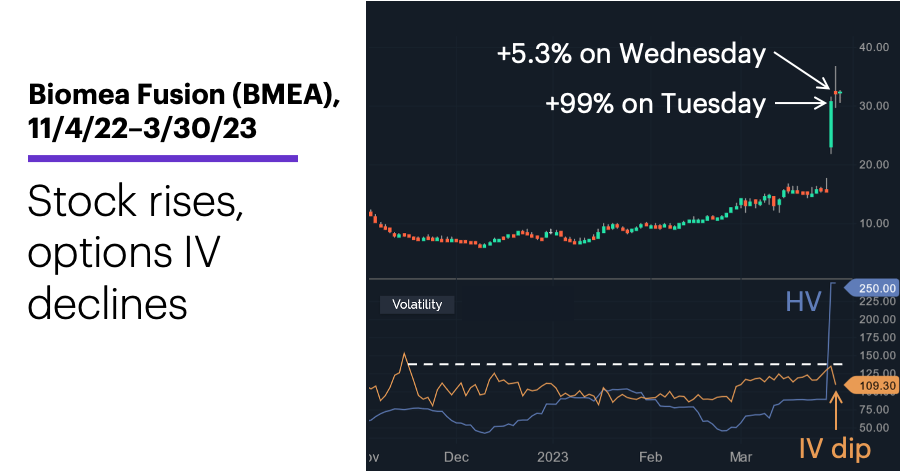
- BMEA hit record highs on Tuesday and Wednesday
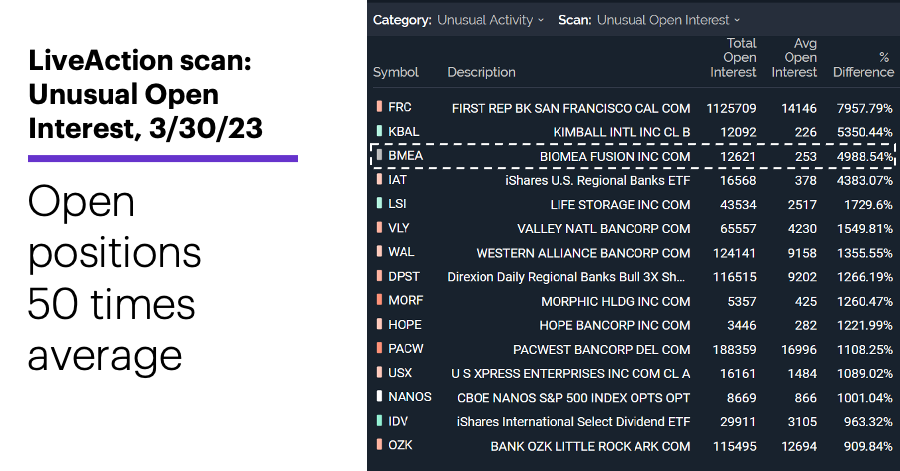
- 99% rally on Tuesday, OI 50 times average on Thursday
- IV dipped on Wednesday despite 5.3% stock gain
Stocks don’t double in price every day, so when one does, it’s worthwhile to watch what happens—in its options as well as in the stock itself.
On Tuesday, Biomea Fusion (BMEA) jumped 99% after positive test data about its Type-2 diabetes therapy.1 It followed up with a 19.4% intraday rally on Wednesday that pushed shares as high as $36.68, although the stock closed in the lower half of its range, up a little more than 5%:
Source: Power E*TRADE. (For illustrative purposes. Not a recommendation.)
While BMEA’s typical daily volume prior to the price surge was less than 200,000 shares, more than 24 million changed hands on Tuesday–Wednesday.
The bottom of the chart shows some equally dramatic developments on the volatility front. On Tuesday, BMEA’s historical volatility (HV) soared to its highest point on record, while options implied volatility (IV) hit its highest level since November, when the stock was in the midst of a nine-day, 35% sell-off. A key detail: IV dropped on Wednesday even as the stock gained more than 5%—and rallied nearly four times that intraday. (Implied volatility is shown with a one-day lag, so the final IV data point on the chart is from Wednesday.)
While lower-than-average IV tends to make options more affordable, high IV can make them pricier than they would be otherwise. In other words, there’s a chance traders who bought options on Tuesday paid a premium, so to speak, relative to Wednesday or Thursday prices, because of the exceptionally high IV on the day of the surge. Option sellers, on the other hand, may have had an opportunity to sell at inflated prices on Tuesday.
Meanwhile, on Thursday BMEA was third from the top on the LiveAction scan for unusual open interest (OI), with nearly 50 times its average number of options positions—the majority of which were April monthly options:
Source: Power E*TRADE. (For illustrative purposes. Not a recommendation.)
But while there were more April call positions than put positions, traders got into these positions at different times. While the majority of the open call positions were in place before the stock’s Tuesday rally, most of the put positions, including the three strikes with the highest OI on Thursday (the April $15, $20, and $25 puts), traded on Tuesday and Wednesday.
In other words, traders were more active in calls before the price surge, at which point puts—especially out-of-the-money puts expiring in roughly three weeks—became more popular.
Today’s numbers include (all times ET): Personal Income and Outlays (8:30 a.m.), PCE Price Index (8:30 a.m.), Chicago PMI (9:45 a.m.), Consumer Sentiment (10 a.m.).
Today’s earnings include: Seabridge Gold (SA), Provention Bio (PRVB).
Click here to log on to your account or learn more about E*TRADE's trading platforms, or follow the Company on Twitter, @ETRADE, for useful trading and investing insights.
1 BioPharma Dive. A small biotech’s shares double on diabetes drug results. 3/29/23.