VIX in spotlight as market hugs highs
- Volatility Index (VIX) usually declines when the stock market rallies
- VIX measures market “fear” via SPX options prices
- Most recent SPX-VIX “high” patterns have marked pauses or pullbacks
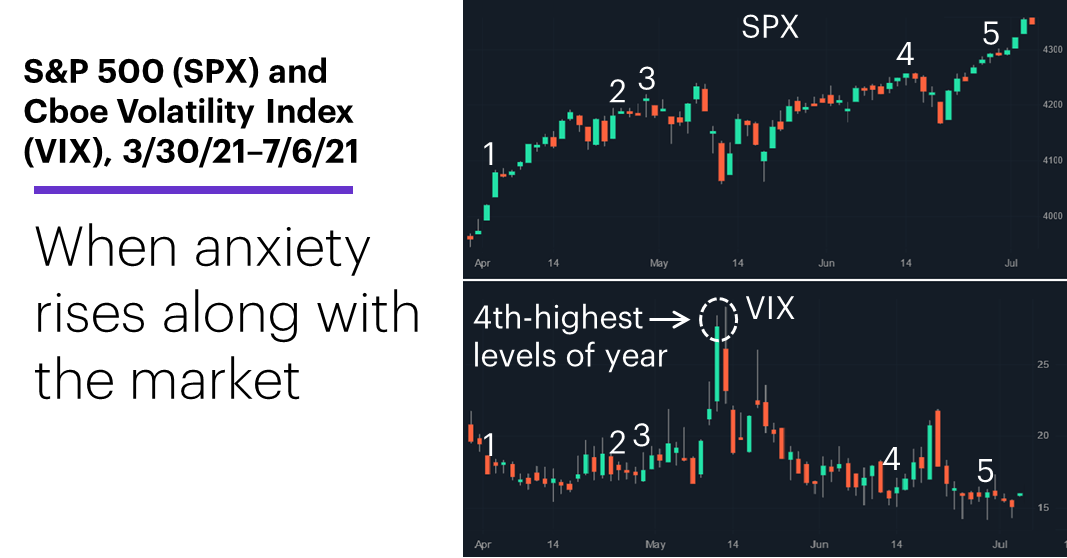
In terms of the stock market, what do April 5, April 26, April 29, June 14, and June 29 have in common?
In truth, not much—other than being recent days the Cboe Volatility Index (VIX) closed higher on the same day as the S&P 500 (SPX):
Source: Power E*TRADE
But they also throw some light on a tendency some stock traders may be watching as the market continues to extend its rally.
Many traders probably think about the VIX in terms of the highs it often makes when the stock market sells off—like the one highlighted above, which corresponded to the SPX’s mid-May pullback low. Similar VIX highs accompanied market lows in January, February, and March.
But as the days numbered 1-5 illustrate, the VIX sometimes provides a more subtle heads-up about potential upside exhaustion in the stock market by rallying on the same day the SPX rallies—exactly the opposite of what the “fear gauge” is supposed to do, since a rising stock market is generally greeted by less anxiety among investors and traders, and less anxiety typically results in a lower VIX reading.
These examples highlight a specific SPX-VIX pattern: days the VIX rallied when the SPX made at least a 50-day new high,1 suggesting elevated anxiety even as the market was making a significant high. But the mixed results after them underscore the challenge of attempting to identify stock market tops in real time. While two of the examples (3 and 4) were followed by pullbacks, two others (1 and 2) were merely followed by one- to two-day pauses, and the last (5) was followed by more gains.
In other words, most of the time this type of signal won’t indicate a significant sell-off or a longer-term market top. If you want to find an example that was followed by a meaningful downturn, you have to go back to September 2 of last year, when the SPX sold off around 10% over a three-week span.
Nonetheless, after 150 of these SPX-VIX signals since March 1997, the SPX has closed lower the next day 62% of the time—worth remembering, since the SPX’s long-term probability of closing higher on any given day is around 54%.
But in a market that has continued to press to the upside, it may be worthwhile to stay on top of information that suggests stocks may be poised to take their foot off the gas, if only temporarily.
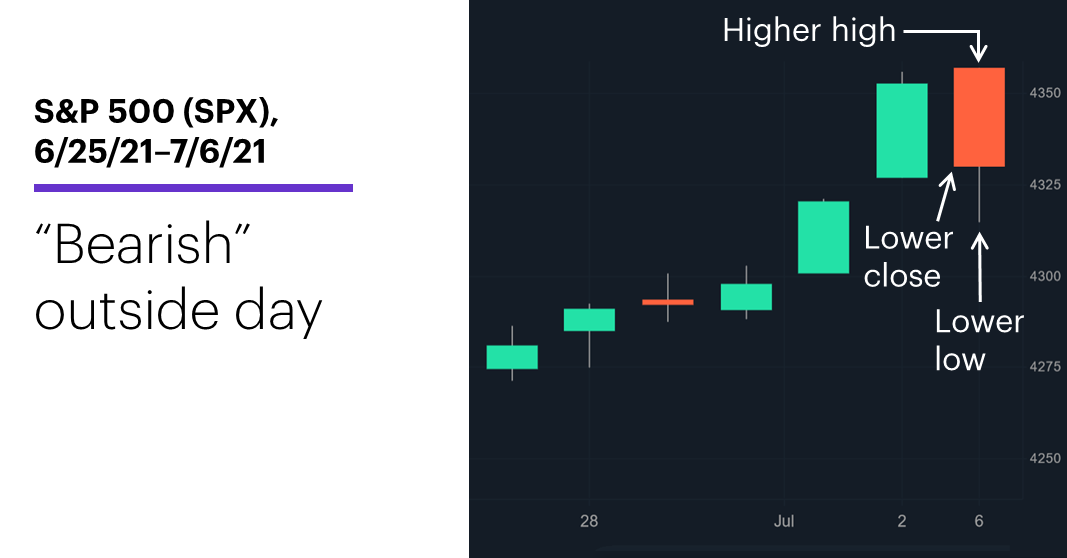
Finally, speaking of potential top signals, some traders probably noticed the SPX’s “outside-day” pattern on Tuesday:
Source: Power E*TRADE
The SPX first traded above the previous day’s high (setting a new record in the process), then sold off to trade below its low, and ultimately closed down for the day (and below the opening price). The classic interpretation of this type of “bearish” outside day is that apparent uncertainty (probing above and below the previous day’s range) matched with intraday weakness (a lower close) implies the potential for more short-term selling.
Unfortunately, that armchair hypothesis doesn’t match with reality, since these days have more often than not (61% of the time) been followed by a higher SPX close the next day.2
Market Mover Update: Crude oil’s rally to a six-year high yesterday got a lot of attention, but fewer people pointed out that the market reversed intraday to close at a three-day low. Also, the energy sector, which trailed the market last week, was the S&P 500’s weakest segment on Tuesday.
Today’s numbers include (all times ET): JOLTS (10 a.m.), FOMC minutes (2 p.m.).
Today’s earnings include: WD-40 (WDFC), MSC industrial (MSM).
Click here to log on to your account or learn more about E*TRADE's trading platforms, or follow the Company on Twitter, @ETRADE, for useful trading and investing insights.
1 Reflects S&P 500 (SPX) and Cboe Volatility Index (VIX) closing prices, 3/7/97–7/6/20. Pattern referenced consists of a day 1) the SPX makes its highest close and intraday high of at least the past 50 trading days, and 2) the VIX closes higher after closing lower the day before. Supporting document available upon request.
2 Reflects S&P 500 (SPX) daily prices, 3/7/97–7/6/20. Supporting document available upon request.