Bottom-up view of market’s “top” pattern
- S&P 500 has pulled back this week after testing resistance
- Index fell 1.9% intraday after Monday’s 3-month high
- Pattern similar to reversal that unfolded in March
Traders who thought the S&P 500 (SPX) might face some resistance when it challenged its February–April highs were “rewarded” by a nearly 2% intraday sell-off on Tuesday:
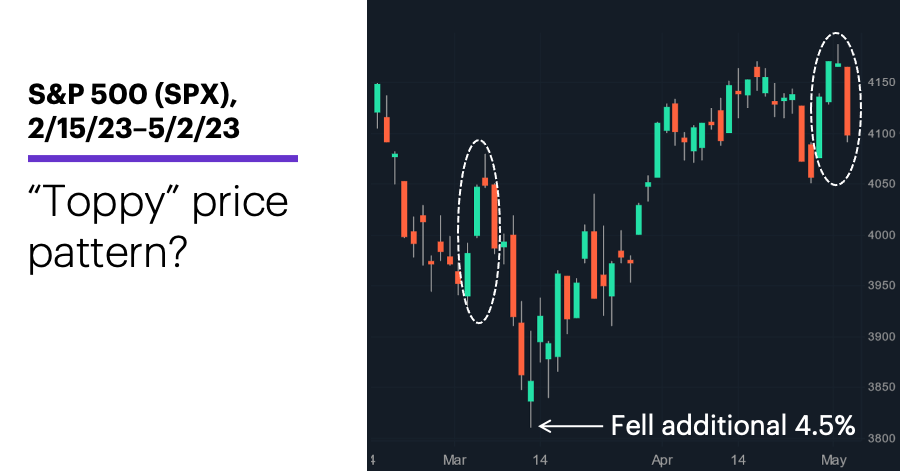
Source: Power E*TRADE. (For illustrative purposes. Not a recommendation.) Note: It is not possible to invest in an index.
If this turnabout feels familiar, that’s because a nearly identical move unfolded in March, when the index capped a two-day upswing with a day that rallied to a higher high but reversed to close toward the bottom of its range, then sold off sharply the next day. The SPX fell an additional 4.5% over the next four days to hit a low of 3,808.86 on March 13.
Traders inclined to assume a similar decline will unfold this time may want to take a look at the four arrows in the following chart, which highlight the final days of comparable patterns that appeared in November, January, and February:
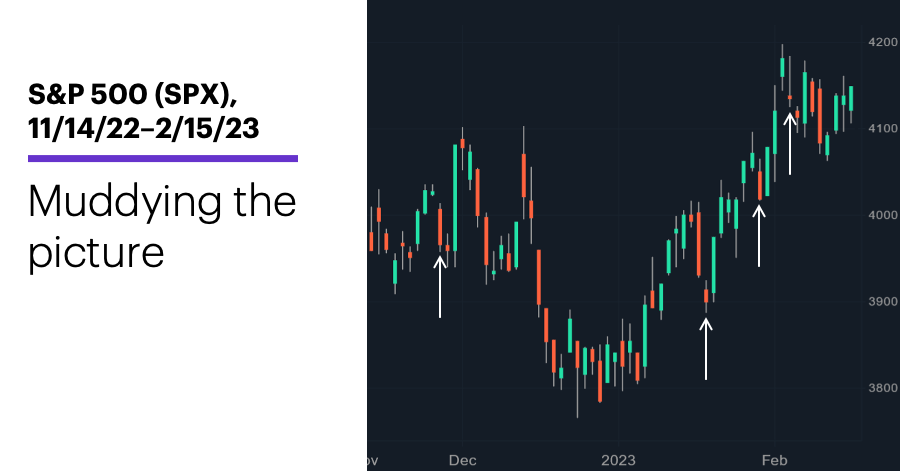
Source: Power E*TRADE. (For illustrative purposes. Not a recommendation.)
In each instance, a sharp one-day sell-off (-1% or larger) reversed an upswing that had pushed the SPX to its highest level in at least a week. Unlike the March example, though, in each of these cases the market turned higher—sometimes temporarily, but quite sharply—no less than two days later. In other words, these examples may cast some doubt in the minds of traders looking for a repeat of March’s follow-through selling.
That said, four additional examples are hardly conclusive. But 164 similar patterns that have appeared since 1960 provide a little more perspective. Five trading days (one week) later, the SPX closed above the close of the sharp down day 52% of the time, with an average return of 0.08%. While that’s weaker than the SPX’s average five-day return of 0.16% since 1960 and its 56.2% probability of rallying in a five-day period, it still suggests the market was more likely to move up than down after these patterns—i.e., the March example may have been more the exception than the rule.
But after 10 trading days the picture was a little different: The SPX was higher 62.2% of the time after the pattern (with an average return of 0.8%), while overall, the SPX had a positive return in only 58.4% of all 10-day periods (with an average gain of just 0.3%).
In other words, just because a pattern appears to be bearish or bullish—especially because of a recent example—it doesn’t mean that’s the way it usually plays out.
Market Mover Update: June WTI crude oil (CLM3) suffered its biggest one-day sell-off since mid-March, falling more than 5% intraday to a five-week low below $71.50. Patterson–UTI Energy (PTEN) fell more than 6.5% intraday, challenging its 14-month lows around $10.40 (see “Traders drill down on energy options”).
Today’s numbers include (all times ET): Mortgage applications (7 a.m.), ADP Employment Report (8:15 a.m.), S&P Global Services PMI (9:45 a.m.), ISM Services Index (10 a.m.), EIA Petroleum Status Report (10:30 a.m.), Fed interest rate announcement (2 p.m.).
Today’s earnings include: CVS Health (CVS), Barrick Gold (GOLD), Phillips 66 (PSX), SunPower (SPWR), Verisk Analytics (VRSK), World Wrestling Entertainment (WWE), Yum Brands (YUM), Etsy (ETSY), Qualcomm (QCOM), Qorvo (QRVO), Sunrun (RUN), SolarEdge (SEDG), Sarepta Therapeutics (SRPT).
Click here to log on to your account or learn more about E*TRADE's trading platforms, or follow the Company on Twitter, @ETRADE, for useful trading and investing insights.
1 All figures reflect S&P 500 (SPX) daily price data, 1960–2023. The specific pattern consists of a day the SPX: 1) rallied to its highest intraday high and close of at least the past five trading days, 2) made a higher high the next day, and 3) closed down 1% or more the following day. Supporting document available upon request.