Bouncing into September
- Tech and small caps lead extension of market rebound
- Yields down, inflation steady, jobs cool, oil hot
- This week: factory orders, Beige Book, productivity
Last week the market made a valiant effort to erase the August pullback, but came up a little short.
On the other hand, last week’s rally helped the S&P 500 (SPX) recoup nearly two-thirds of August’s 219.25-point intramonth decline. And despite stumbling toward the end of the week, the SPX also posted its biggest weekly gain in nearly two months amid signs of a cooling jobs market:
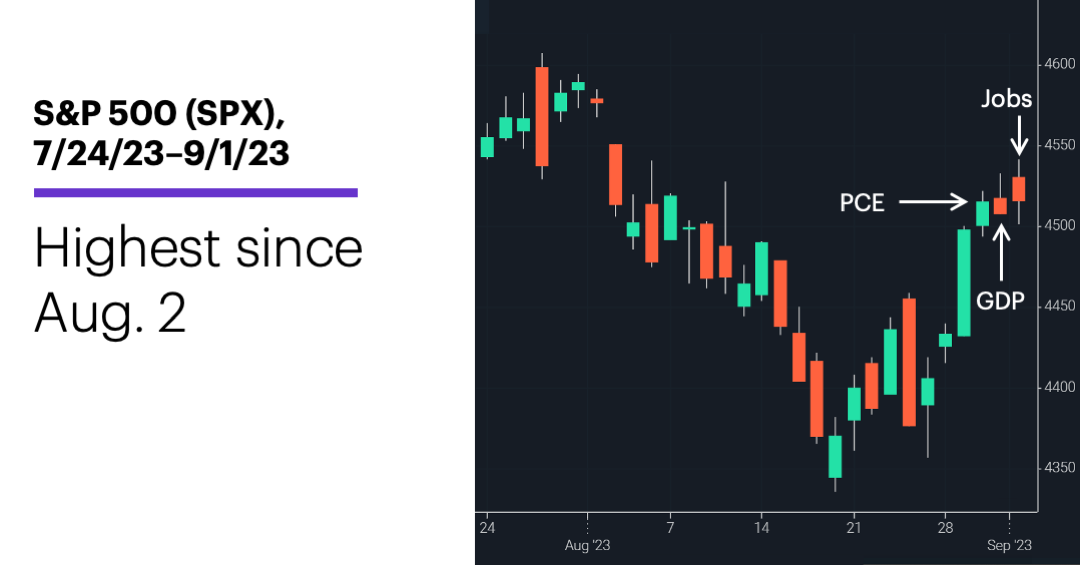
Source: Power E*TRADE. (For illustrative purposes. Not a recommendation. Note: It is not possible to invest in an index.)
The headline: Down for August, but up for week.
The fine print: Last week’s data provided a few signs of a slowing economy. Second-quarter GDP was revised lower from 2.4% to 2.1%, while job listings shrank notably and the monthly jobs report was on the soft side. But the Fed’s preferred inflation gauge, the PCE Price Index, was steady to higher for August.
The number: 8. Despite losing ground last month, the SPX’s 17.4% year-to-date return through the end of August was its eighth-strongest of the past 40 years.
The move: The SPX closed above its 50-day moving average last Tuesday—two weeks to the day after it closed below it for the first time since March.
The scorecard: Tech and small caps led the market last week, with the Nasdaq 100 (NDX) and Russell 2000 (RUT) posting the biggest gains:
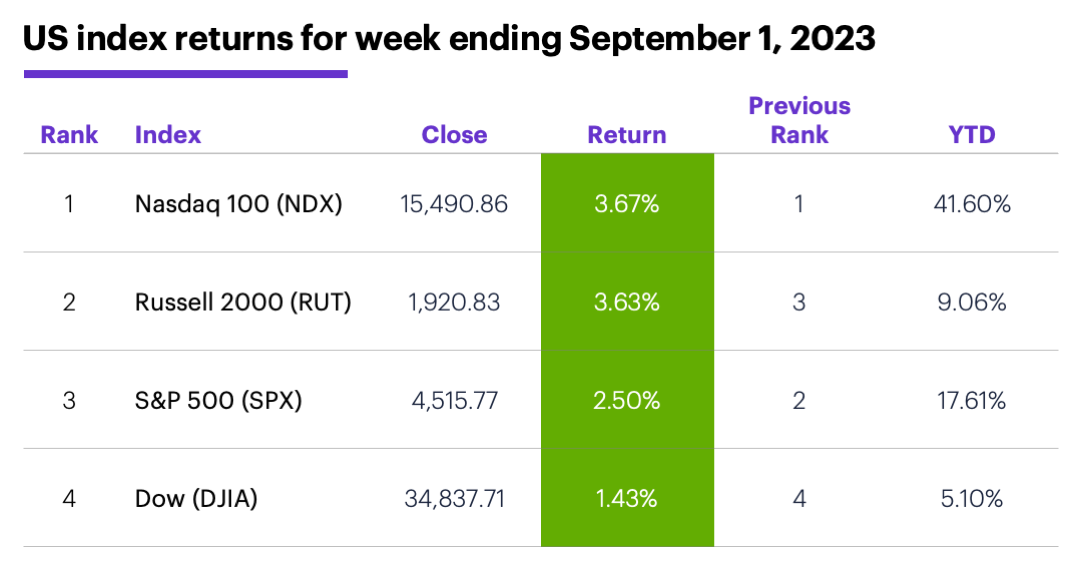
Source (data): Power E*TRADE. (For illustrative purposes. Not a recommendation.)
Sector returns: The strongest S&P 500 sectors last week were information technology (+4.4%), energy (+3.7%), and materials (+3.7%). The weakest sectors were utilities (-1.7%), consumer staples (-0.3%), and health care (+0.03%).
Stock movers: Hawaiian Electric (HE) +45% to $13.97 on Monday, Marathon Digital Holdings (MARA) +29% to $13.68 on Tuesday. On the downside, NovoCure (NVCR) -38% to $18.61 on Monday, VinFast Auto (VFS) -44% to $46.25 on Tuesday.
Futures: October WTI crude oil (CLV3) topped its August highs on Friday, ending the week at $85.89 (highest level since November). December gold (GCZ3) hit a nearly four-week high, closing Friday at $1,966.90. (Last week, Morgan Stanley analysts argued in favor of buying gold on weakness or interest rate declines.1) Week’s biggest gains: October WTI crude oil (CLV3) +7.6%, November Brent crude oil (BX3) +5.8%. Week’s biggest losses: September VIX (VXU3) -13.8%, December hard red wheat (KWZ3) -5.5%.
Coming this week
This week’s numbers include:
●Tuesday: Factory Orders, vehicle sales
●Wednesday: Trade Balance, S&P Global Services PMI, ISM Services Index, Fed Beige Book
●Thursday: Productivity and Labor Costs
●Friday: Wholesale Inventories, Consumer Credit, used car prices
This week’s earnings include:
●Tuesday: AeroVironment (AVAV), HealthEquity (HQY), Zscaler (ZS)
●Wednesday: American Eagle Outfitters (AEO), C3 AI (AI), Copart (CPRT), Dave & Busters (PLAY)
●Thursday: Designer Brands (DBI), G-III Apparel (GIII), Science Applications (SAIC), DocuSign (DOCU), Limoneira (LMNR), National Beverage (FIZZ)
●Friday: Kroger (KR)
Check the Active Trader Commentary each morning for an updated list of earnings announcements, IPOs, economic reports, and other market events.
September stands alone
Almost any way you slice it, September has been, historically, the weakest month of the year for stocks. Since 1957, September has been a down month for the SPX 37 times and an up month only 29 times, with an average return of -0.8%.
Two charts help illustrate the market’s behavior in September. The first shows the return profile for every September since 1957—i.e., each line shows how much the SPX was up or down on a percentage basis throughout the month:2
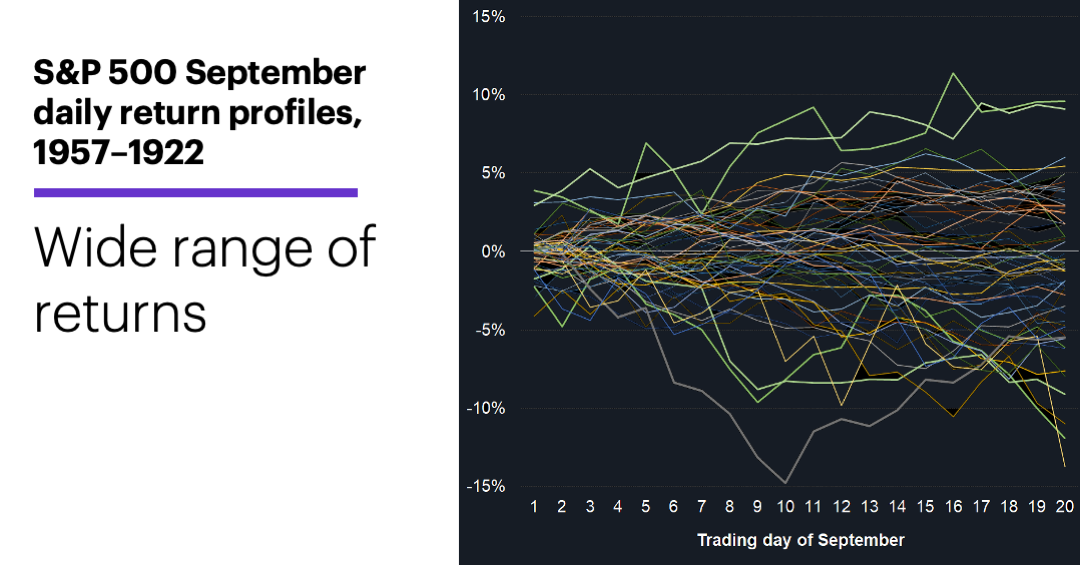
Source (data): Power E*TRADE. (For illustrative purposes. Not a recommendation.) Note: It is not possible to invest in an index.
The market’s September performance, obviously, varied significantly from year to year. But if we simplify this bowl of data spaghetti by averaging the returns at each day, we get the following composite profile:
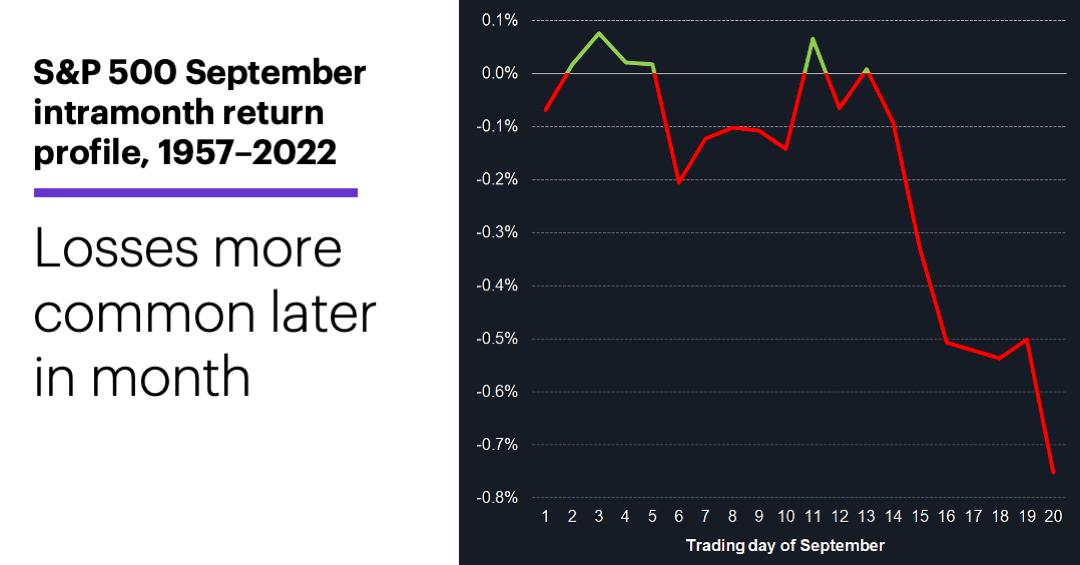
Source (data): Power E*TRADE. (For illustrative purposes. Not a recommendation.) Note: It is not possible to invest in an index.
This chart shows that the bearishness was, on average, more pronounced toward the end of September—not that the preceding portion of the month was particularly bullish.
Finally, last month was the SPX’s fifth negative August of the past 10 years, and the second in a row. After the 28 other down Augusts since 1997, September has been negative 15 times and positive 13 times—although since 1990 the results have tilted the other way, with September positive after nine of the past 16 negative Augusts.
Click here to log on to your account or learn more about E*TRADE's trading platforms, or follow the Company on Twitter, @ETRADE, for useful trading and investing insights.
1 MorganStanley.com. The GIC Weekly: Not so Fast, Goldilocks. 8/28/23.
2 All figures reflect SPX (SPX) daily closing prices, 1985–2022. Note: Charts reflect first 20 trading days of September only (which may or may not be the final trading day of the month), with returns measured from the last trading day of August. Supporting document available upon request.