Mixed messages
- Economy rolls, stocks flip-flop around inflation data
- US crude oil tops $90, dollar highest since March
- This week: Fed rate decision, housing starts, leading indicators
Coming off a post-Labor Day pullback, US stocks followed through to the downside last week as stronger-than-expected economic data and inflation readings kept alive worries that the Fed could raise interest rates later this year, if not this week.
The S&P 500 (SPX) looked like it was headed for a positive week after Thursday’s strong rally, but a sharp downturn on Friday erased the week’s gains:
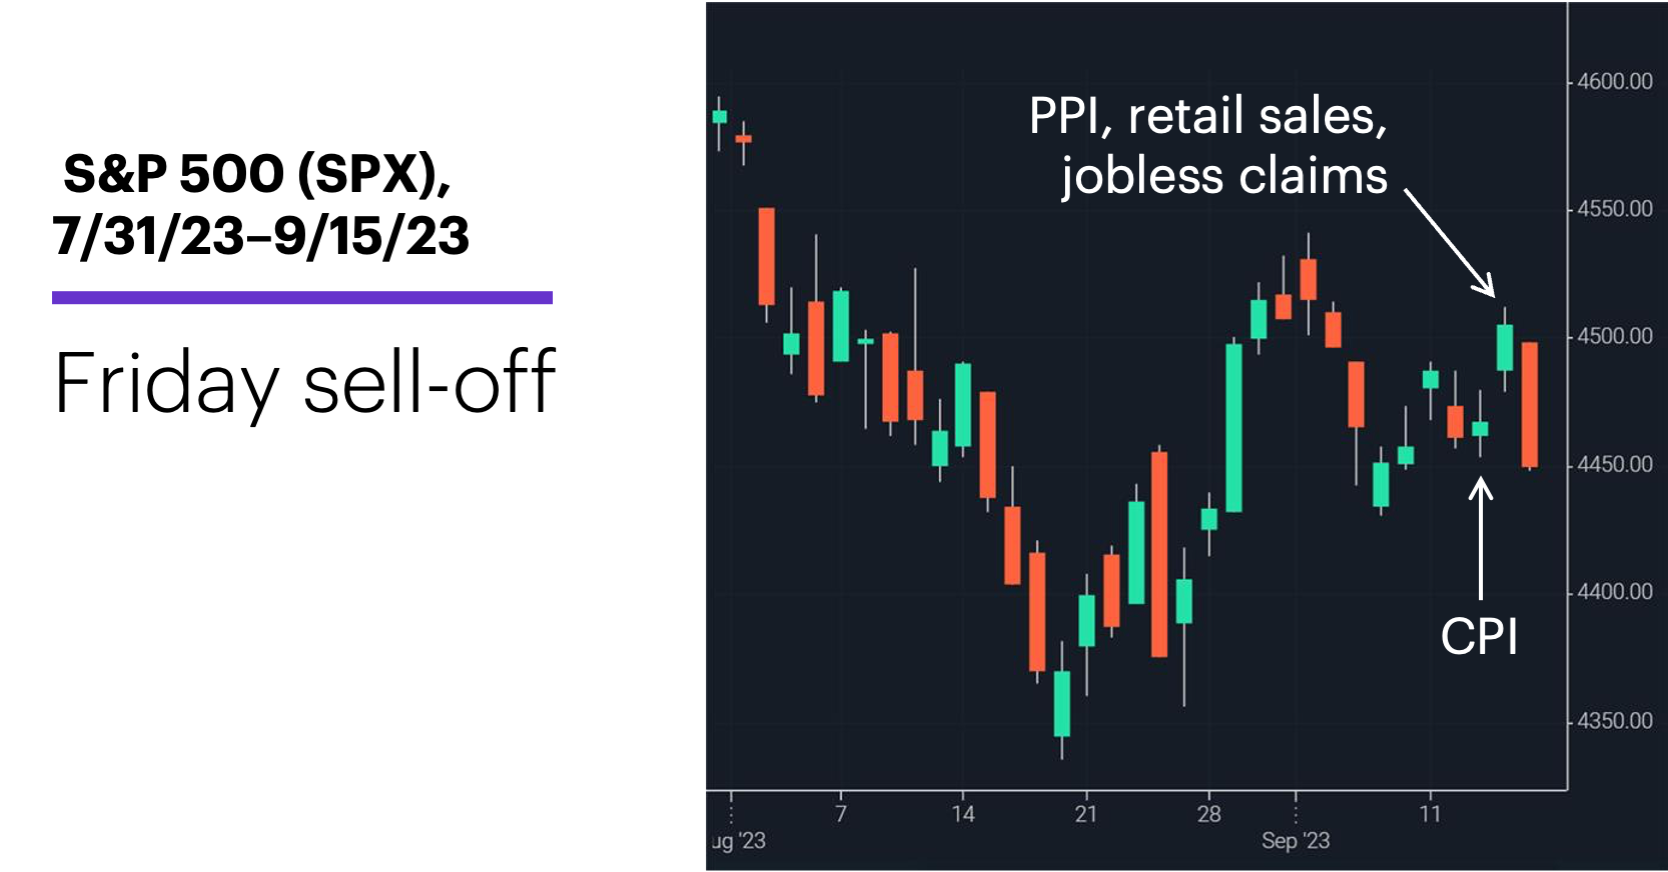
Source: Power E*TRADE. (For illustrative purposes. Not a recommendation. Note: It is not possible to invest in an index.)
The headline: Stocks choppy amid strong economy, stubborn inflation.
The fine print: The Consumer Price Index (CPI) was up month over month (but in line with estimates), Thursday’s Producer Price Index (PPI) was hotter than anticipated, retail sales surprised to the upside, weekly jobless claims were (again) low, and oil prices continued to climb. Stock investors initially appeared to be focusing on the good news part of the equation (the US economy is strong) rather than the potential bad news (the Fed will remain hawkish on rates). It remains to be seen whether Friday’s sell-off hinted at a change in sentiment.
The move: Last Thursday US crude oil prices topped $90 for the first time in more than 10 months.
The deals: J.M. Smucker (SJM) announced a plan to buy Hostess (TWNK) for $5.6 billion. Chip designer Arm (ARM) closed 13.4% above its opening price after Thursday’s high-profile IPO, but closed lower on Friday.
The scorecard: The Dow was the only major index that wasn’t in the red at the end of the week:
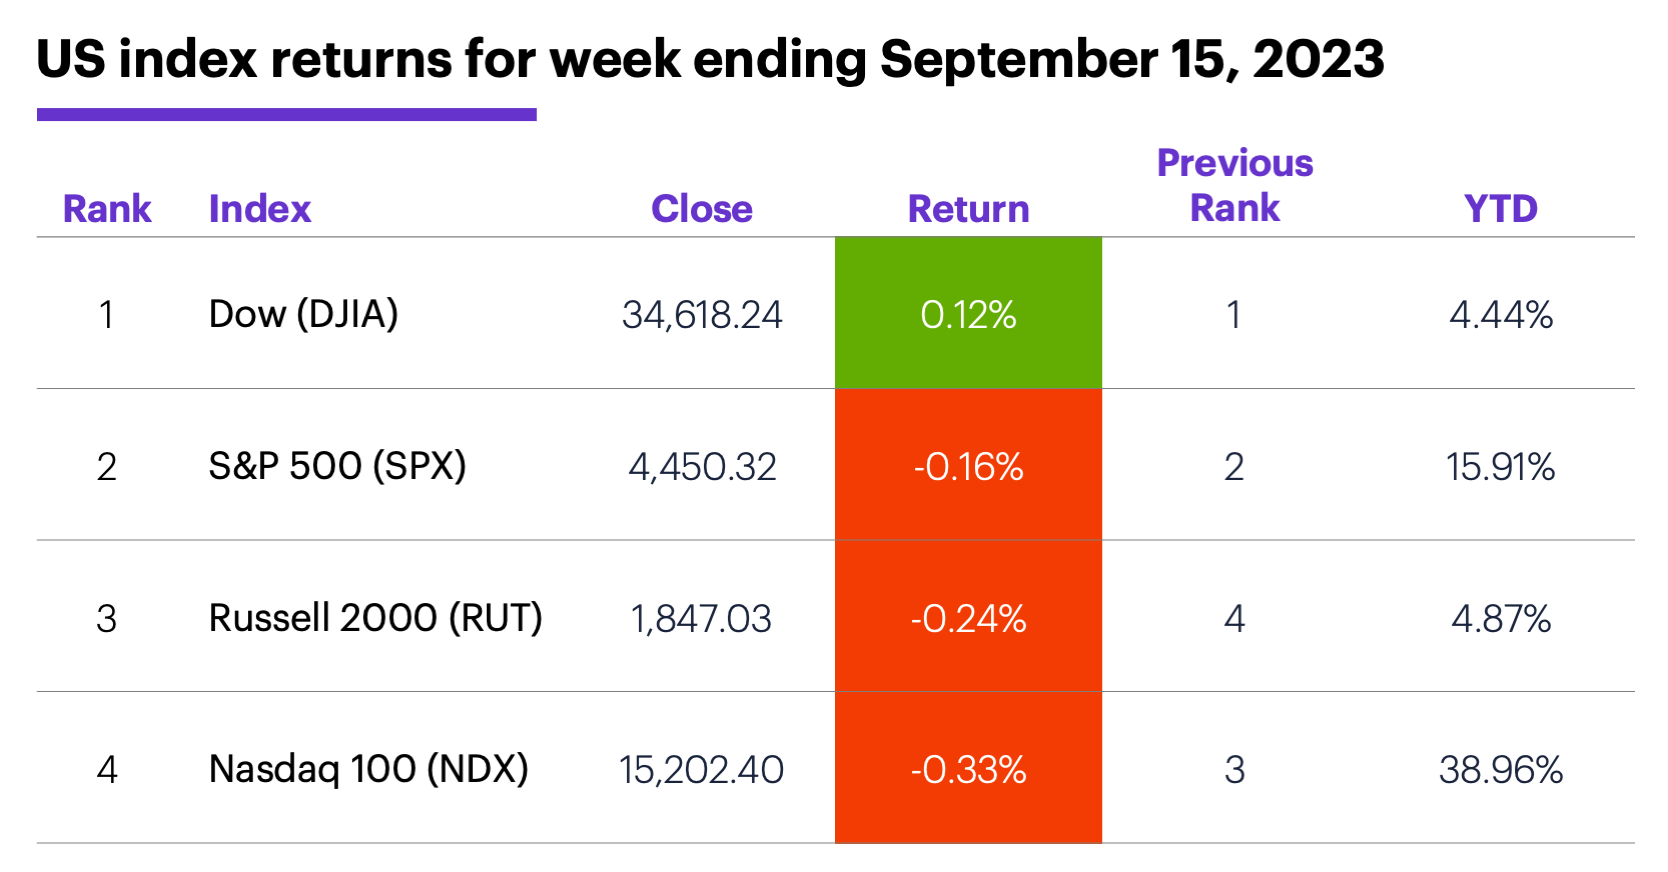
Source (data): Power E*TRADE. (For illustrative purposes. Not a recommendation.)
Sector returns: The strongest S&P 500 sectors last week were utilities (+2.8%), consumer discretionary (+1.7%), and financials (+1.4%). The weakest sectors were information technology (-2.3%), industrials (-0.6%), and materials (-0.2%).
Stock movers: Crinetics Pharmaceuticals (CRNX) +63% to $26.08 on Monday, Rocket Pharmaceuticals (RCKT) +39% to $21.23 on Wednesday. On the downside, Acelyrin (SLRN) -54% to $12.80 and Orthofix (OFIX) -30% to $13.01, both on Tuesday.
Futures: October WTI crude oil (CLV3) extended its rally, ending the week up more than $3 at $90.77. December gold (GCZ3) tagged its lowest low ($1,921.70) in more than three weeks last Thursday, but pivoted to end the week slightly higher at $1,946.20. Week’s biggest gains: October ethanol (ZKV3) +8.1%, December coffee (KCZ3) +7.1%. Week’s biggest losses: October milk (DCV3) -4.6%, December oats (ZOZ3) -4.2%.
Coming this week
In addition to the Fed’s interest rate announcement, traders will get a look at housing numbers and leading indicators:
●Monday: NAHB Housing Market Index
●Tuesday: Housing Starts and Building Permits
●Wednesday: Fed interest rate announcement
●Thursday: Current Account Q2, Existing Home Sales, Leading Economic Indicators Index
●Friday: S&P Global Manufacturing and Services PMI (flash)
This week’s earnings include:
●Tuesday: Apogee Enterprises (APOG), AutoZone (AZO)
●Wednesday: General Mills (GIS), FedEx (FDX), KB Home (KBH)
●Thursday: Darden Restaurants (DRI), FactSet Research (FDS), Scholastic (SCHL)
Check the Active Trader Commentary each morning for an updated list of earnings announcements, IPOs, economic reports, and other market events.
Checking in on the VIX
Last Friday’s lower close for the SPX may not have had any particular significance, but it also may have reflected a pattern tied to what the Cboe Volatility Index (VIX) did a day earlier.
On Thursday, the VIX closed at 12.82, which was its lowest close since January 17, 2020. While there’s no evidence a specific VIX level implies a certain type of market behavior—that is, there’s no threshold separating “bullish” VIX readings from “bearish” ones—we decided to look at what the stock market has done after the VIX fell to other significant lows.
For simplicity, we measured the SPXs performance after the VIX closed at a three-year low (756 trading days).1 There was some possible evidence of short-term market underperformance after the 55 other times this happened since 1990: The SPX closed lower the next day (as it did last Friday) 60% of the time, and after one week it was lower 53% of the time.
Click here to log on to your account or learn more about E*TRADE's trading platforms, or follow the Company on Twitter, @ETRADE, for useful trading and investing insights.
1 All figures reflect S&P 500 (SPX) and Cboe Volatility Index (VIX) daily prices, 1990–2023. Pattern refers to a day the VIX closed below it its previous 756 closes (i.e., three years) following a day it did not close below its previous 756 closes. Supporting document available upon request.