Checking in on the Santa Claus Rally
- Market in the red for December with eight days remaining
- The four days before and after Christmas more bullish than average
- Some of those days have tended to be stronger than others
While December has, historically, been one of the more bullish months for stocks, this year shows how even the seemingly strongest seasonal tendencies aren’t a given. With the S&P 500 (SPX) down more than 6% for the month as of Monday, the market was facing an uphill battle to close out 2022 on an up note.
Including today, though, there are eight trading days left in the year—a period that, depending on what definition you reference, captures the bulk of the “Santa Claus Rally,” when the stock market is supposed to be in an especially giving mood.
There is, in fact, some evidence of above-average bullishness in the four (trading) days before Christmas and the four after it. Since 1990, S&P 500 (SPX) has posted a net gain in this period 69% of the time, with a median net return of 1.1%.1 By comparison, the SPX’s median return for all eight-day periods was only 0.3%, and only 60% of them had positive returns.
There have also been a few noticeable tendencies for some of the individual days in this trading window:
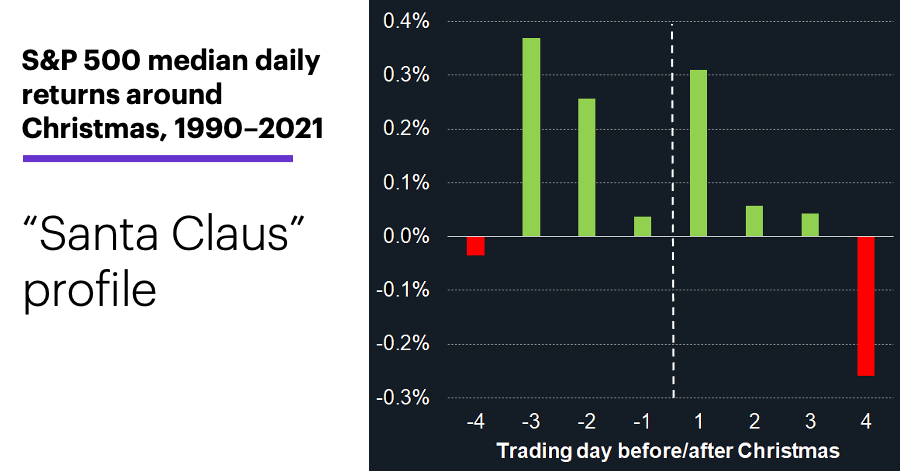
Source (data): Power E*TRADE. (For illustrative purposes. Not a recommendation.)
The second day before the Christmas holiday and the day after it had the strongest combination of return size (both above 0.25%) and likelihood of closing higher (both above 70%). The third day before the holiday had the highest median return, but it was an up day only 62.5% of the time.
Santa appeared to wrap up business toward the end of the year, though. The fourth day after Christmas—which, depending on the year, is the last or second-to-last trading day of the year—tended to be the weakest day in this stretch. It had a median return of -0.26% and closed lower 19 out of 32 times. (The final trading day of the year, regardless of whether it was the fourth or fifth day after Christmas, closed lower 62.5% of the time.)
Last year’s price action during this window reflected a few of these tendencies:
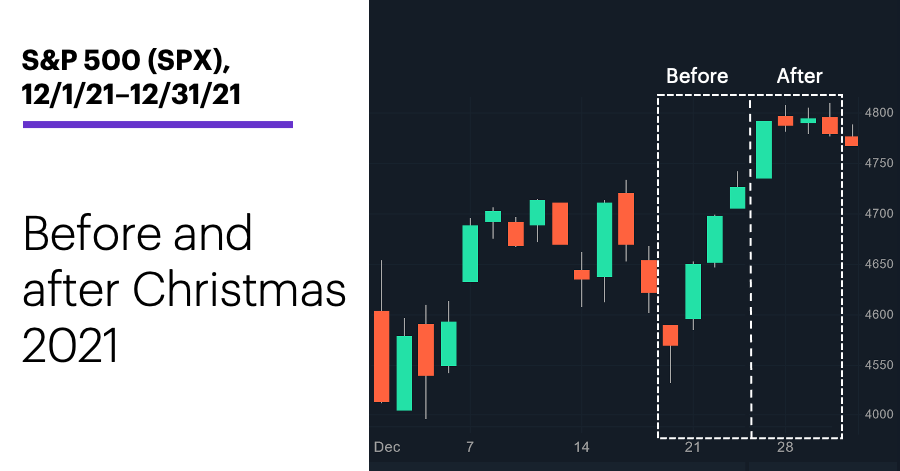
Source: Power E*TRADE. (For illustrative purposes. Not a recommendation.)
The SPX gained 3.4% during the eight-day window, the fourth days before and after Christmas were both negative, the last three days before Christmas and the first day after it were positive, and the final day of the year was negative.
This example notwithstanding, experienced traders remember that even if a seasonal pattern unfolds, it won’t necessarily match the composite picture created by its average performance over many years.
Market Mover Update: NovoCure (NVCR) started this week quietly by extending its multi-month trading range, but its options implied volatility continued to climb (see “Breakout signals and volatility realities”).
Today’s numbers include (all times ET): Housing Starts and Building Permits (8:30 a.m.).
Today’s earnings include: General Mills (GIS), Nike (NKE).
Click here to log on to your account or learn more about E*TRADE's trading platforms, or follow the Company on Twitter, @ETRADE, for useful trading and investing insights.
1 All figures reflect S&P 500 (SPX) daily closing prices, December 1990 through December 2021. “Christmas” refers to the day the markets close in observance of the holiday, not December 25. Supporting document available upon request.