Price surge meets resistance?
- XPO rallied 27% in 2 days last week, 48% in 3 weeks
- Move recently stalled near resistance at prior high
- IV below HV a week before earnings
Many traders like to compare different types of volatility, or the same type of volatility on different time frames, to see if what’s happening “beneath the surface” confirms or contradicts a stock’s price action.
On Tuesday morning, for example, freight transportation company XPO (XPO) appeared on the LiveAction scan for stocks with historical volatility (HV) greater than their implied volatility (IV), with 30-day average HV a little more than 18 points above its 30-day average IV:
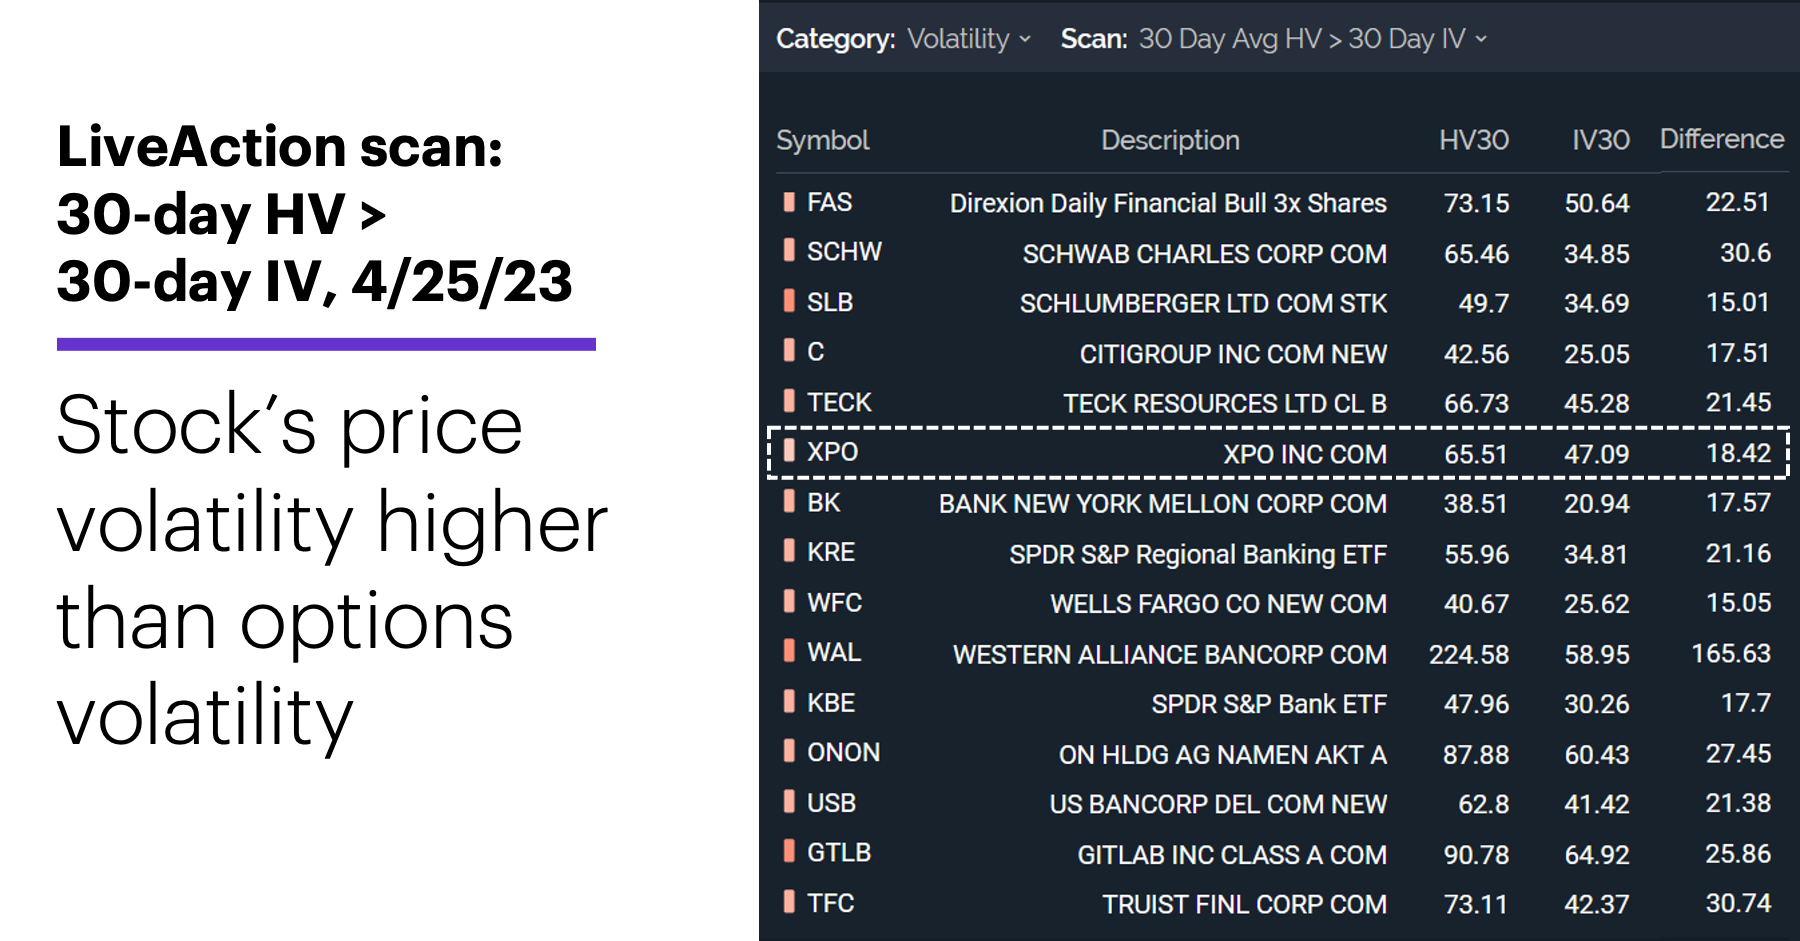
Source: Power E*TRADE. (For illustrative purposes. Not a recommendation.)
While HV measures how much a stock has moved in the past, IV reflects how much the options market expects it to move in the future—and the more they expect it to move, the higher options prices tend to be, all other factors aside. In effect, this scan means options traders are saying, “We don’t expect these stocks to move as much over the next 30 days as they’ve moved over the past 30 days.”
That doesn’t mean the options market is always correct, and this statement can also mean different things in different situations. It could mean the options market thinks a stock that has been stuck in the mud recently is likely to move even less in the near future. Or it could mean the market thinks the stock could, in fact, move quite a bit over the next month—just not as much as it did over the past month. In other words, IV itself can be relatively high, but it may be low compared to the stock’s recent volatility.
In this case, the fact that XPO’s IV is below its HV may strike some traders are unusual, since XPO is currently scheduled to announce earnings on May 4, and IV is often higher than average before a company releases its numbers. But the following chart shows XPO has been quite volatile recently: It jumped 27% last Thursday–Friday after announcing it had hired an executive from one of its competitors to be its new CEO.1 The stock challenged its February highs and extended its rally since April 5 to 48%:
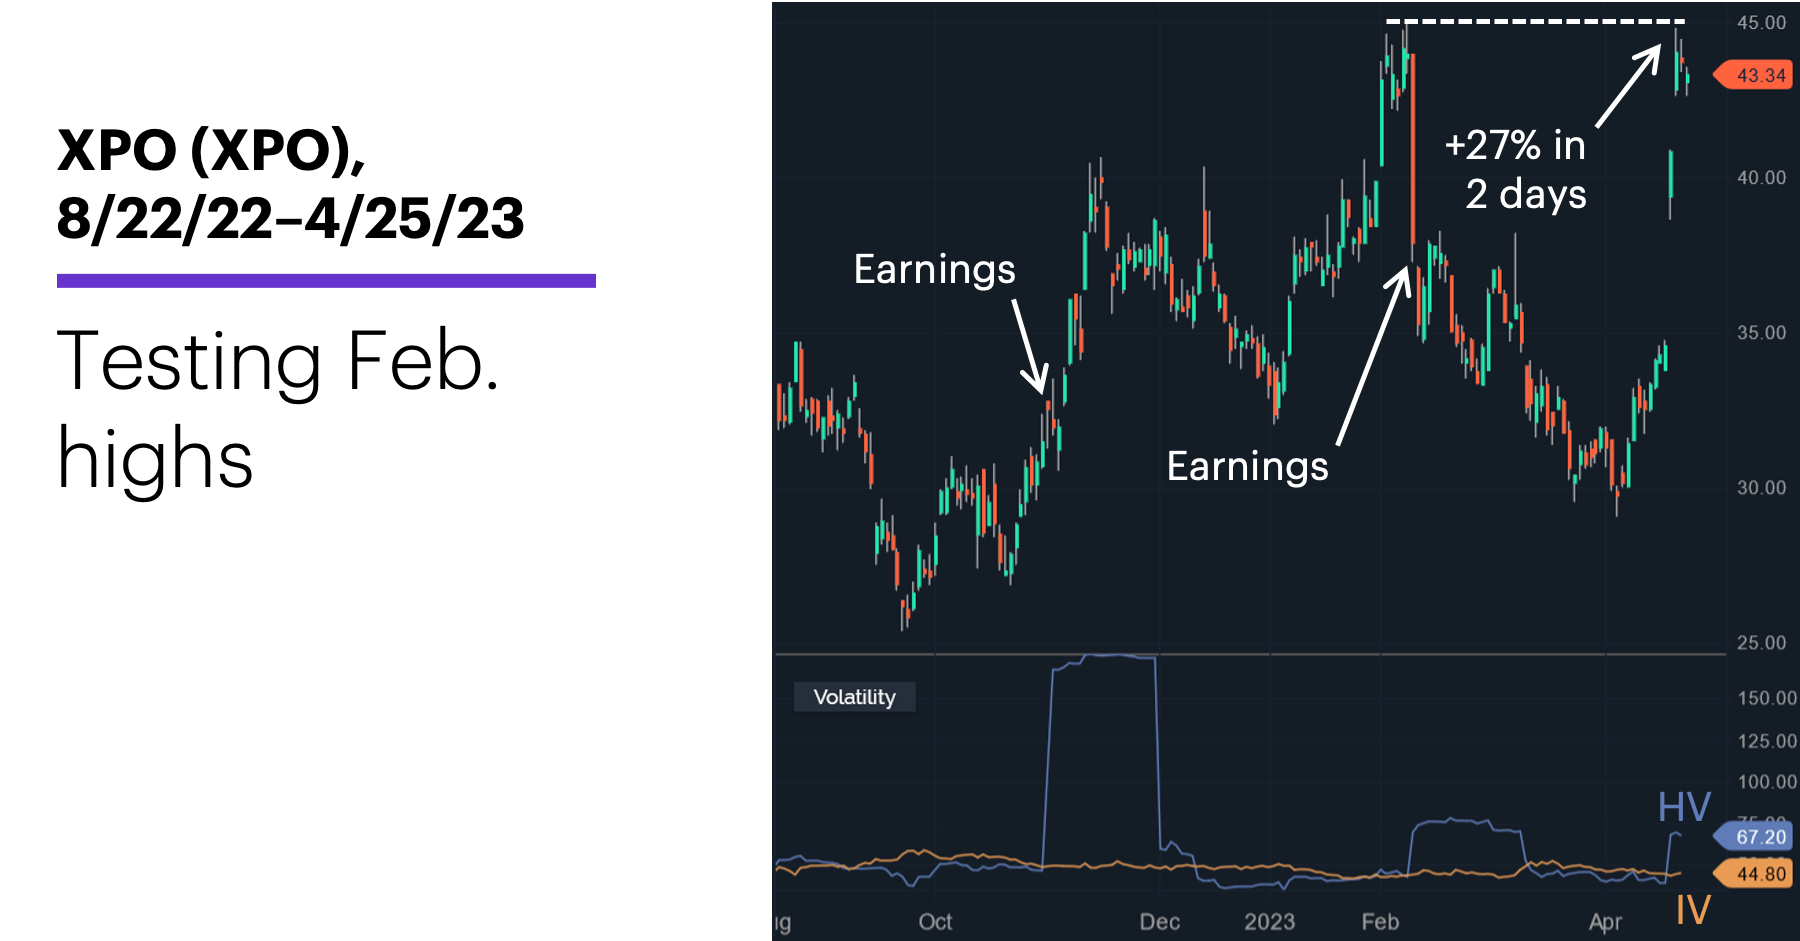
Source: Power E*TRADE. (For illustrative purposes. Not a recommendation.)
As extreme as last week’s jump appears to be on the chart, XPO has actually enjoyed a fair number of two-day, 20% (or larger) rallies—23 since 2003. Here’s what it did afterward:2
•After one week, XPO was lower 18 out of 23 times with a median return of -4.8%.
•After two weeks, XPO was lower 12 out of 23 times with a median return of -3.4%.
•After three weeks, XPO was lower 13 out of 23 times with a median return of -1.9%.
•After four weeks, XPO was lower 15 out of 23 times with a median return of -5.8%.
Aside from implication that the stock tended to rebound a bit in weeks 2 and 3 (the median losses were smaller than at week 1, and the stock wasn’t down as often), the gist of these statistics is that the two-day price surges were followed, more often than not, by near-term price declines.
That doesn’t guarantee the same pattern will unfold this time, but developing a well-balanced picture of market activity usually requires synthesizing more than one piece of information. Volatility can tell you how much prices have moved in the past, or how much the market expects them to move in the future, but it doesn’t tell you anything about the direction prices may take.
Market Mover Update: Rapid7 (RPD) fell more than 6% intraday on Tuesday, but had one of the day’s highest (approximately 420:1) call-put ratios. The biggest trades: 2,800 of the May $50 calls (vs. open interest of 18,700) 5,500 of the May $55 calls (vs. open interest of 967) and 5,100 of the May $60 calls (vs. open interest of 13,800).
Today’s numbers include (all times ET): Mortgage Applications (7 a.m.), Durable Goods Orders (8:30 a.m.), Advance International Trade in Goods (8:30 a.m.), Advance Retail and Wholesale Inventories (8:30 a.m.), EIA Petroleum Status Report (10:30 a.m.).
Today’s earnings include: Boeing (BA), General Dynamics (GD), eBay (EBAY), Mattel (MAT), Meta (META), O’Reilly Automotive (ORLY), Roku (ROKU), Spirit Airlines (SAVE), Teladoc (TDOC), Teradyne (TER), Waste Connections (WCN), Waste Management (WM).
Click here to log on to your account or learn more about E*TRADE's trading platforms, or follow the Company on Twitter, @ETRADE, for useful trading and investing insights.
1 American Journal of Transportation. XPO appoints Bates as Chief Operating Officer. 4/20/23.
2 All figures reflect XPO (XPO) daily closing prices, October 2002–April 2022. Supporting document available upon request.