Puts, calls, and capitulation signals
- LW has fallen to multiple 52-week lows in recent months
- Last Friday’s large sell-off was accompanied by a high put–call ratio
- Options activity signaling a potential sentiment extreme?
Friday’s spike by the Cboe Volatility Index (VIX) was a useful reminder that many traders like to use options and volatility data as contrarian indicators. The premise: The sentiment extremes represented by such moves can sometimes mark turning points—i.e., the market goes down when bulls have gotten about as bullish as they can get, or the market goes up when the bears have pushed the limits of bearishness.
The principle is straightforward enough, and the markets offer plenty of examples. Just compare charts of the VIX and the S&P 500 (SPX) over the past several years and you’ll get an idea of how frequently VIX highs—which represent extreme levels of investor concern—correspond to bearish “capitulation” and stock-market lows. But as with everything else in the markets, context is king.
For example, traders also sometimes use high put–call ratios (high put volume relative to call volume) to identify potential bearish sentiment extremes, since people often buy put options when they’re worried about a particular stock (or the overall market) falling.
But heavy put volume when a market has been trending upward and is near a longer-term high can represent something very different than heavy put volume in a market that has already sold off significantly. Traders often view the latter condition as a more fertile ground for a bearish capitulation and upside reversal, since markets can only reverse a down move after all the people who want to sell have sold. With that in mind, take a look at the following LiveAction scans from last Friday:
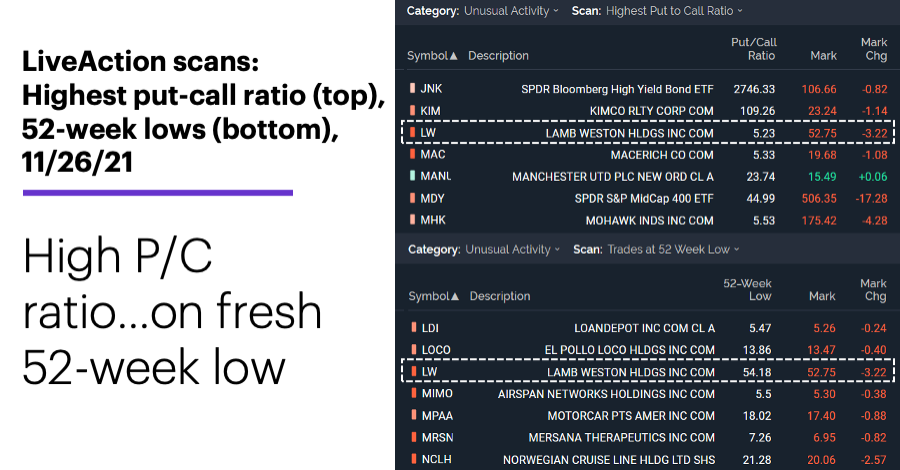
Source: Power E*TRADE (For illustrative purposes. Not a recommendation.)
Lamb Weston (LW) was just one of 30 or so stocks that appeared on the LiveAction scan for high put-call ratios (top), but it was the only one that was also on the scan for stocks making new 52-week lows (bottom). Yesterday, LW’s put–call ratio was even higher than Friday’s.
The following price chart shows the stock, which has been trending lower since June, also sold off 5.8% last Friday, breaking down out of a seven-week consolidation in the process:
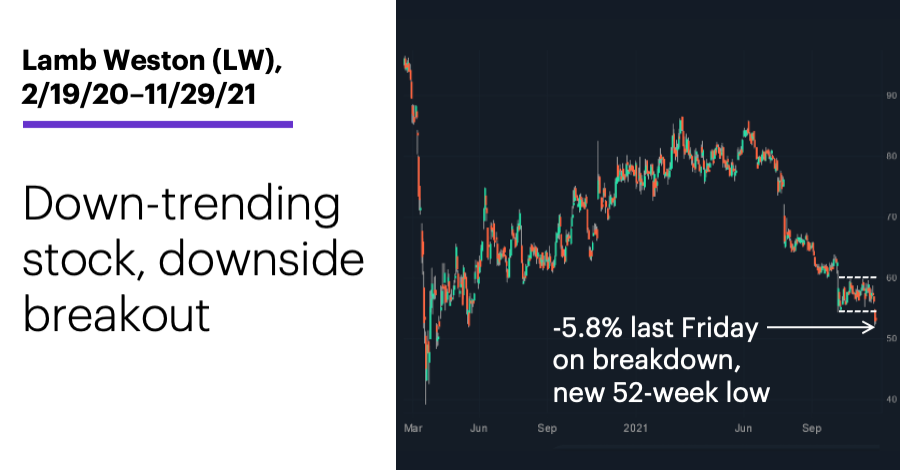
Source: Power E*TRADE (For illustrative purposes. Not a recommendation.)
In a nutshell, some traders may have felt the fact that this stock had already been declining for five months could increase the odds that selling pressure was closer to its end than its beginning, and that a high put-call ratio could signal a bearish sentiment extreme.
The market action reflected in an indicator like the put–call ratio doesn’t represent a “stop sign”—in any situation there may be valid reasons for a price trend to continue despite an apparent reversal signal—but traders who monitor such signals tend to pay more attention when other market factors are pointing in the same direction.
Market Mover Update: The VIX’s 54% surge last Friday was its biggest one-day jump since January, and the fourth-largest over the past 20 years. As was the case after the other three 50%-plus VIX spikes—January 27, 2021, February 5, 2018, and February 27, 2007—the SPX closed higher yesterday.
Today’s numbers include (all times ET): S&P Case-Shiller Home Price Index (9 a.m.), FHFA Housing Price Index (9 a.m.), Chicago PMI (9:45 a.m.), Consumer Confidence (10 a.m.).
Today’s earnings include: Box (BOX), Salesforce.com (CRM), NetApp (NTAP), Ambarella (AMBA), Zscaler (ZS).
Click here to log on to your account or learn more about E*TRADE's trading platforms, or follow the Company on Twitter, @ETRADE, for useful trading and investing insights