Pre-earnings fireworks
- CGNX down Tuesday, off more than 12% since July 18
- Put options volume 95 times average
- Company scheduled to release earnings Thursday
During earnings season, stocks that have just posted earnings often dominate unusual options activity scans. Surprises can trigger big price moves in the stock and big prints on the options tape, as traders caught flatfooted attempt to adjust their positions and others jump into the market to take advantage of the move.
On Tuesday, though, a stock scheduled to release its numbers on Thursday made its presence felt on a few options scans, most notably unusual put activity. In early trading, Cognex’s (CGNX) put volume was more than 95 times average, including two positions in the out-of-the-money August $45 and $50 puts:
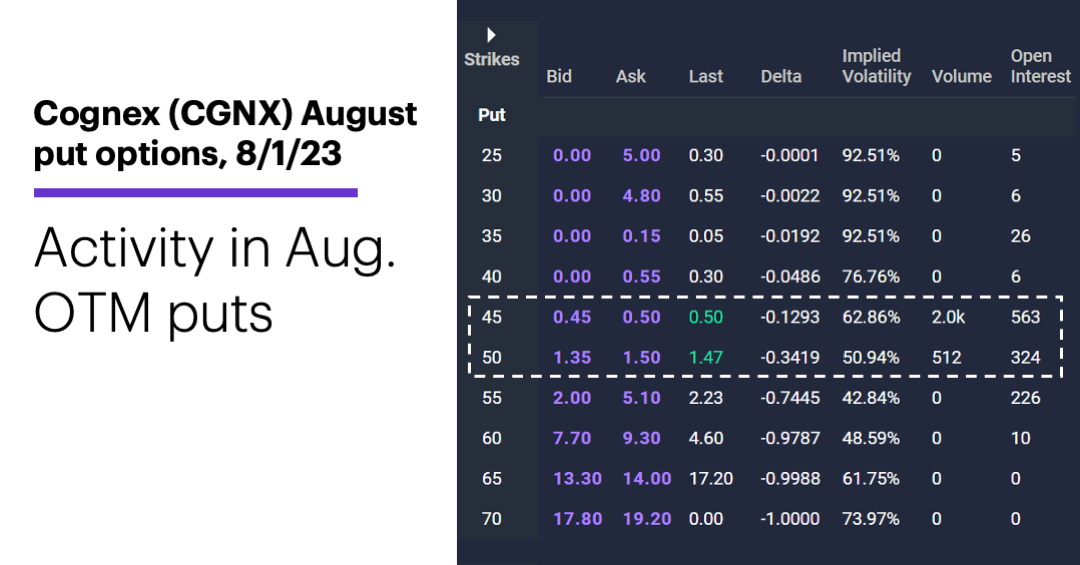
Source: Power E*TRADE. (For illustrative purposes. Not a recommendation.)
While those may not appear to be particularly big positions, they are for CGNX, which averages around 27 puts per day. And with the volume in both contracts larger than the open interest, there’s a good chance at least some of the activity consisted of traders opening new positions.
Meanwhile, CGNX shares fell more than 6% intraday Tuesday morning, tagging their lowest level since mid-May a little less than two weeks after they hit their highest high since May 2022:
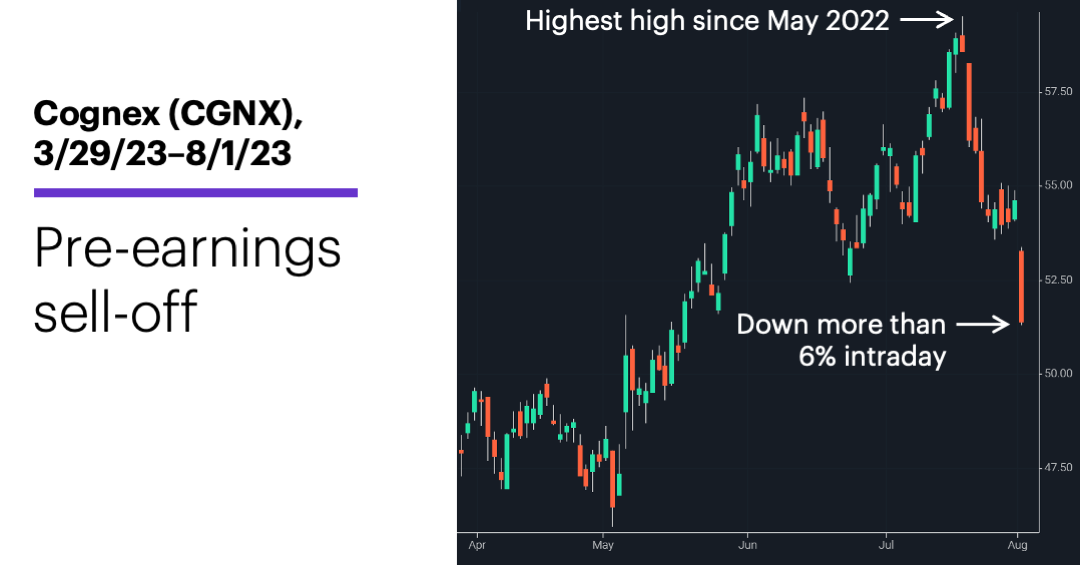
Source: Power E*TRADE. (For illustrative purposes. Not a recommendation.)
Although as of Tuesday CGNX was down more than 12% from its July 18 close of $58.93, it was still a little above the average Street analyst target of $49.40 (the high–low range is $58-$40).1
The stock’s earnings-day history shows CGNX has closed up or down 6%, on average, after releasing earnings (yellow dashed line, below). The green and red columns, which represent the stock’s gains or losses, respectively, for each earnings release, show CGNX has rallied on earnings day in 11 of the past 19 quarters, but has fallen in six of the past 10:
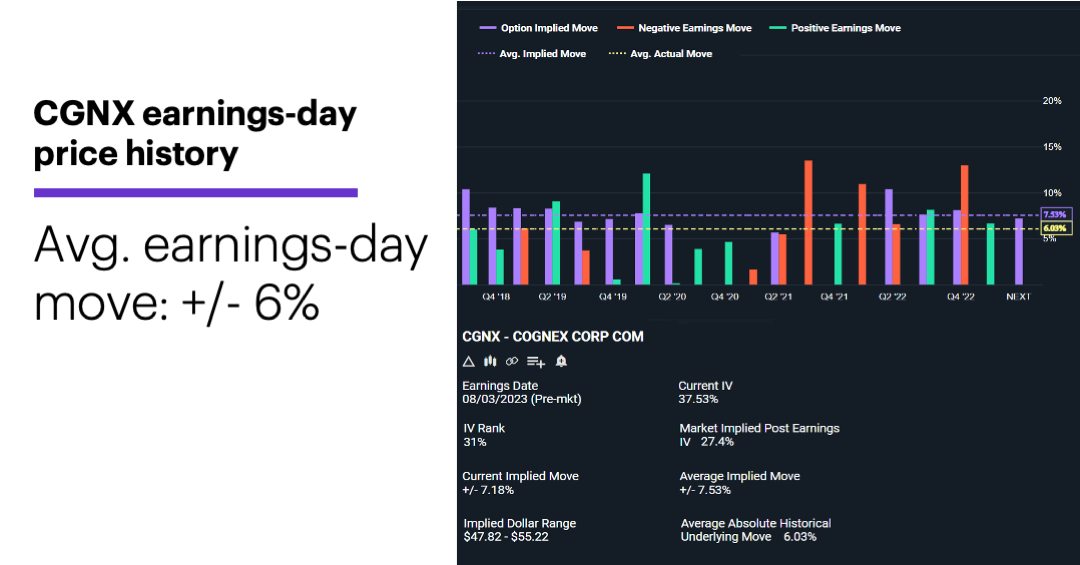
Source: Power E*TRADE. (For illustrative purposes. Not a recommendation.)
There were no headlines Tuesday that may have explained why CGNX was on the move. While it could be tempting to interpret yesterday’s stock sell-off and heavy put volume as a sign of bearishness on the eve of an earnings release, a single day’s price activity can be misleading. Cognex is scheduled to release its earnings after the close on Thursday, and two more days could completely change the picture painted by Tuesday’s trades.
But traders were opening or adjusting relatively significant positions on Tuesday, which could make CGNX an interesting story over the next few days.
Market Mover Update: September WTI crude oil (CLU3) dipped on Tuesday, a day after it closed at its highest level since last November (see “Oil rally nears test”).
Today’s numbers include (all times ET): Mortgage applications (7 a.m.), ADP Employment Report (8:15 a.m.), EIA Petroleum Status Report (10:30 a.m.), Vehicle Sales.
Today’s earnings include: CVS (CVS), Kraft Heinz (KHC), Phillips 66 (PSX), Yum Brands (YUM), DoorDash (DASH), Etsy (ETSY), Occidental Petroleum (OXY), PayPal (PYPL), Qualcomm (QCOM), Qorvo (QRVO), Sunrun (RUN), Shopify (SHOP).
Click here to log on to your account or learn more about E*TRADE's trading platforms, or follow the Company on Twitter, @ETRADE, for useful trading and investing insights.
1 TipRanks. Cognex (CGNX) Stock Forecast & Price Target. 8/1/23.