Short term, long term
- HUBS closed down after reversing post-earnings rally
- Result was a “bearish” outside day pattern
- History shows two-part reaction to similar days
After topping earnings estimates on Wednesday afternoon,1 HubSpot (HUBS) formed a so-called “outside day” on Thursday, trading above Wednesday’s high and below its low.
In this case, it was also one of the stock’s most volatile days of the past few months, with HUB initially rallying more than 5% intraday before falling as much as 6% and closing lower for the day:
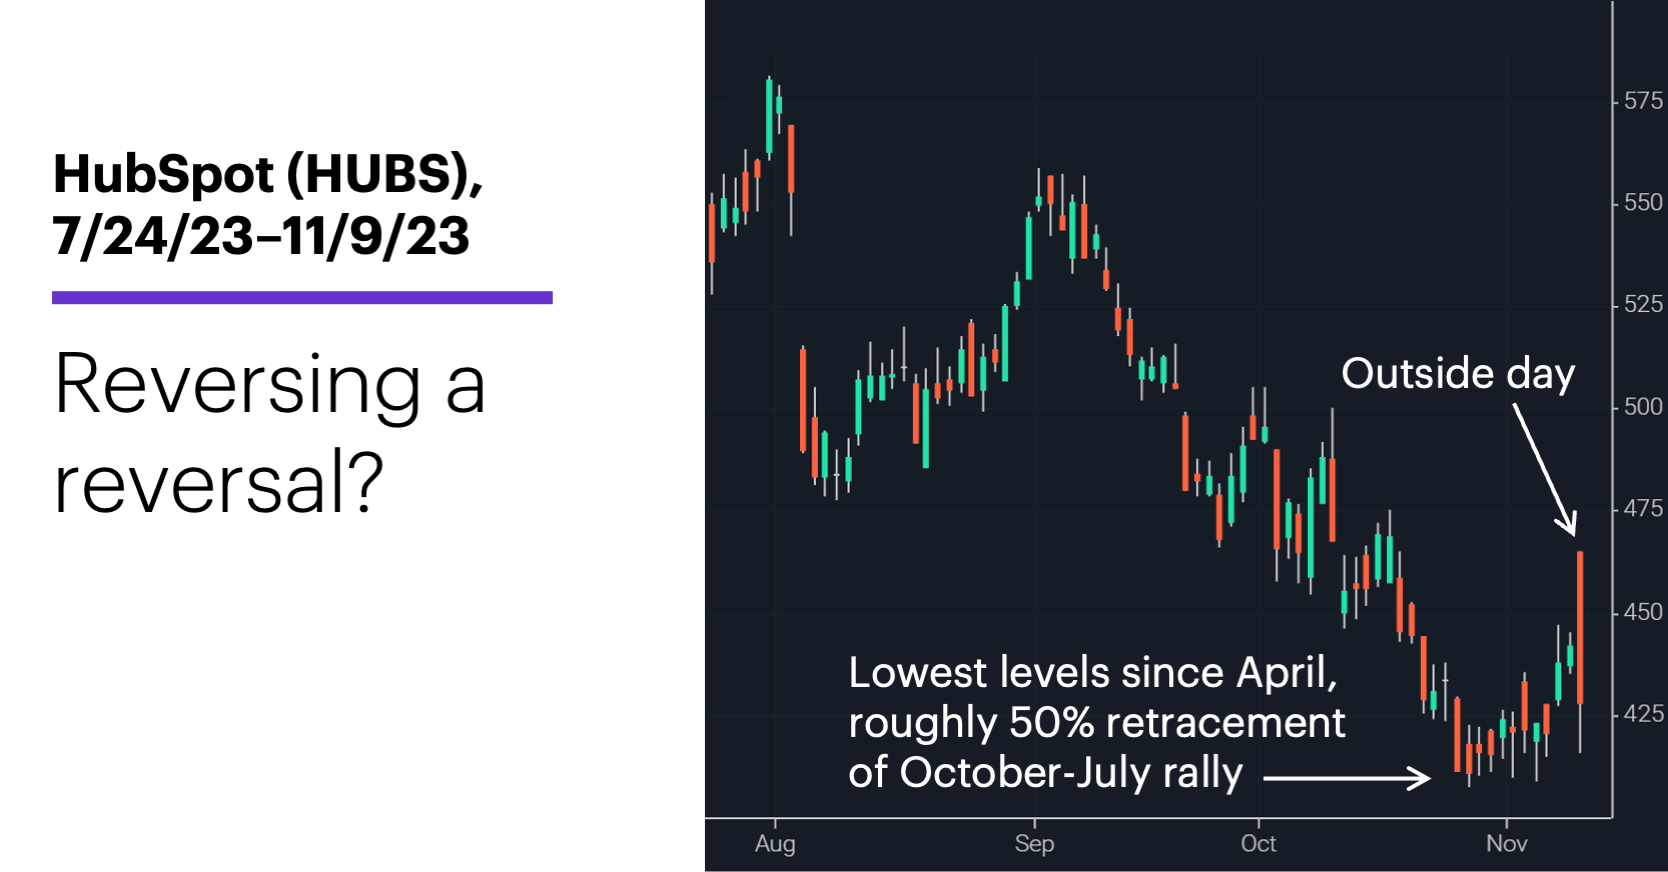
Source: Power E*TRADE. (For illustrative purposes. Not a recommendation.)
A knee-jerk—and arguably logical—interpretation of the day’s price action is that the market “changed its mind” about the stock, deciding the initial enthusiasm was misplaced. That was likely a disappointment to bulls who had recently watched HUBS stabilize after falling to its lowest levels in more than six months and retracing approximately half of its 127% October 2022-July 2023 rally. Was what looked like a potential reversal off these lows now in danger of getting reversed?
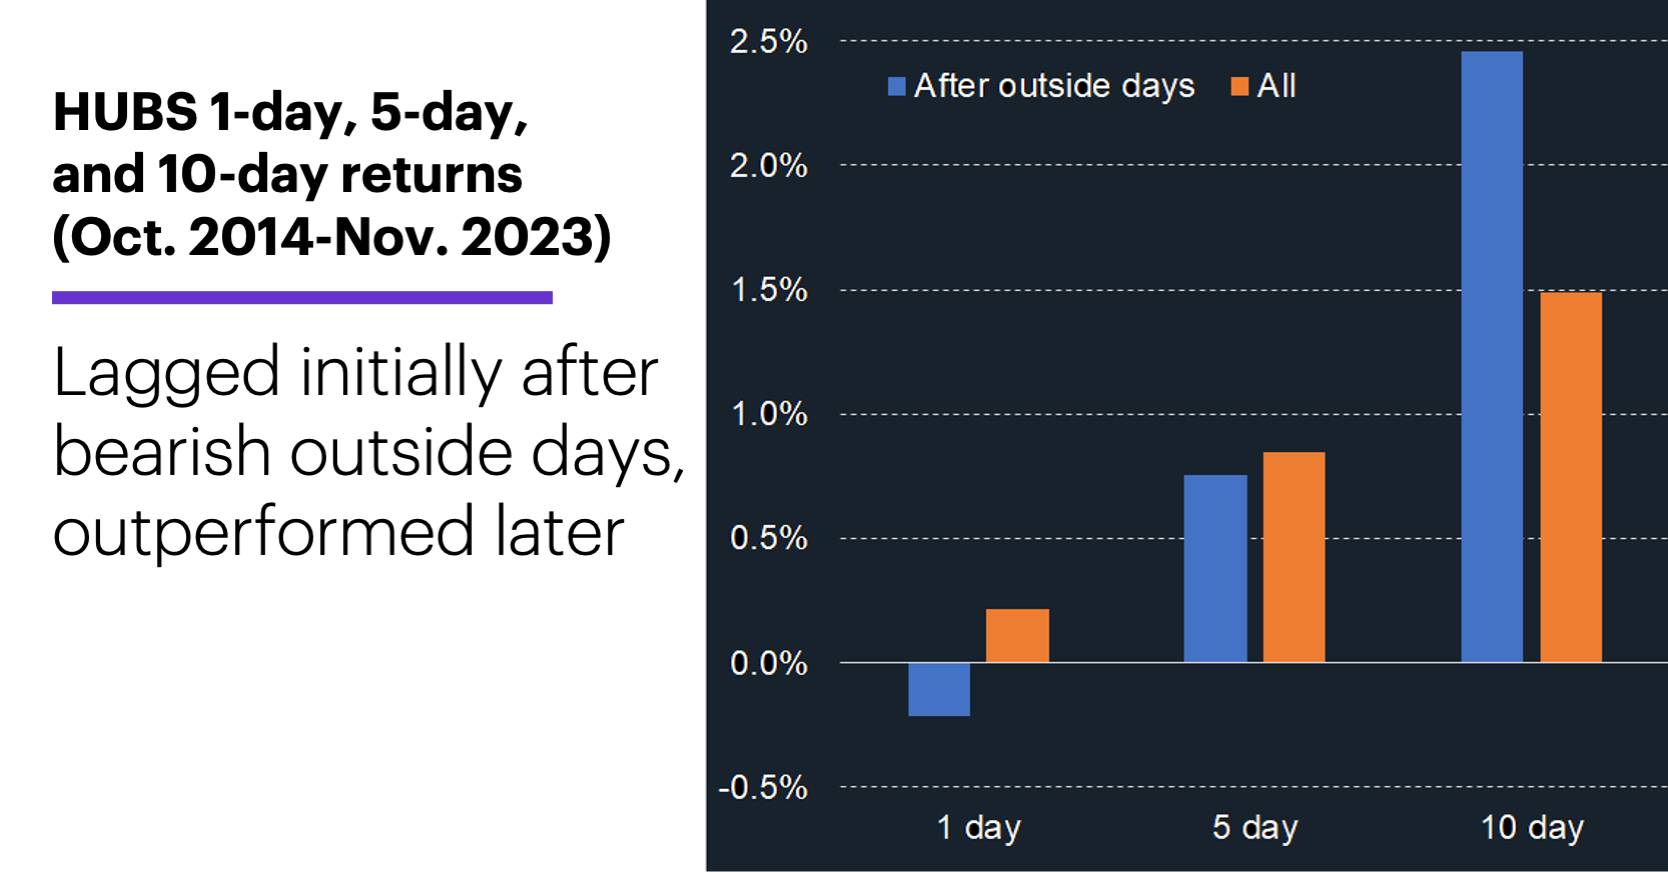
As is always the case in the markets, research and analysis offer a good antidote to quick assumptions. This was far from the first “bearish” (down-closing) outside day in HUBS’ nine-year history. In fact, the stock has formed 131 other outside days like Thursday since 2014. The following chart compares HUBS’ one-, five-, and 10-day median returns after these days (blue) to its median returns for all one-, five, and 10-day periods since 2014 (orange):
Source: Power E*TRADE. (For illustrative purposes. Not a recommendation.)
In the (very) short term, at least, the bearish outside day appeared to live up to its reputation. The stock’s median return the day after the outside days was -0.2%, while its overall one-day return was +0.2%.2 (The stock closed lower more often than it closed higher on the first two days after the outside days.) After five days, the median return after the outside days was comparable to the overall five-day benchmark.
At the 10-day mark, though, HUBS’ median return after the outside days was nearly 2.5%, above the stock’s 1.5% return. Also, 10 days after the outside days, the stock was higher 66% of the time, vs. 58% of the time for all 10-day periods. While it's impossible to know whether HUBS will follow a similar path this time around, the price history shows that, more often than not, this type of outside day was followed by additional short-term weakness, then by upside outperformance over a two-week time horizon.
Stocks are often volatile after earnings, and that volatility can lead to emotional decision-making—especially when prices form a seemingly “bearish” or “bullish” pattern. Putting that volatility in historical context can be a good way to separate short-term noise from longer-term factors.
Market Mover Update: December WTI oil futures (CLZ3) inverted HUBS’ price action on Thursday, forming an “inside day” by trading entirely within Wednesday’s high-low range. The market interrupted its recent sell-off by closing up (although well off its intraday high), but it’s still poised for a down week, as well as its biggest three-week decline in more than a year.
A large trader may have rolled a put options position in Nutrien (NTR) on Thursday. The 10,500 contracts that traded in the November monthly $52.50 puts looked like a possible trade liquidation (open interest stood at 10,600), but 10,500 contracts also traded in the $50 puts expiring on December 22, where open interest was only five contracts.
Today’s numbers include (all times ET): Consumer Sentiment (10 a.m.).
Today’s earnings include: StoneCo (STNE).
Click here to log on to your account or learn more about E*TRADE's trading platforms, or follow the Company on Twitter, @ETRADE, for useful trading and investing insights.
1 StreetInsider.com. HubSpot (HUBS) delivers stronger-than-expected results, guidance; Shares rally. 11/8/23.
2 All figures reflect HubSpot (HUBS) daily closing prices, October 2014-November 2023. The specific outside day pattern refers to a day 1) the stock traded above the previous day’s high and below its low, 2) within 5-10 trading days after the stock 3) closed at its lowest level in at least 20 trading days. Supporting document available upon request.