Balancing volatility and time in a trade
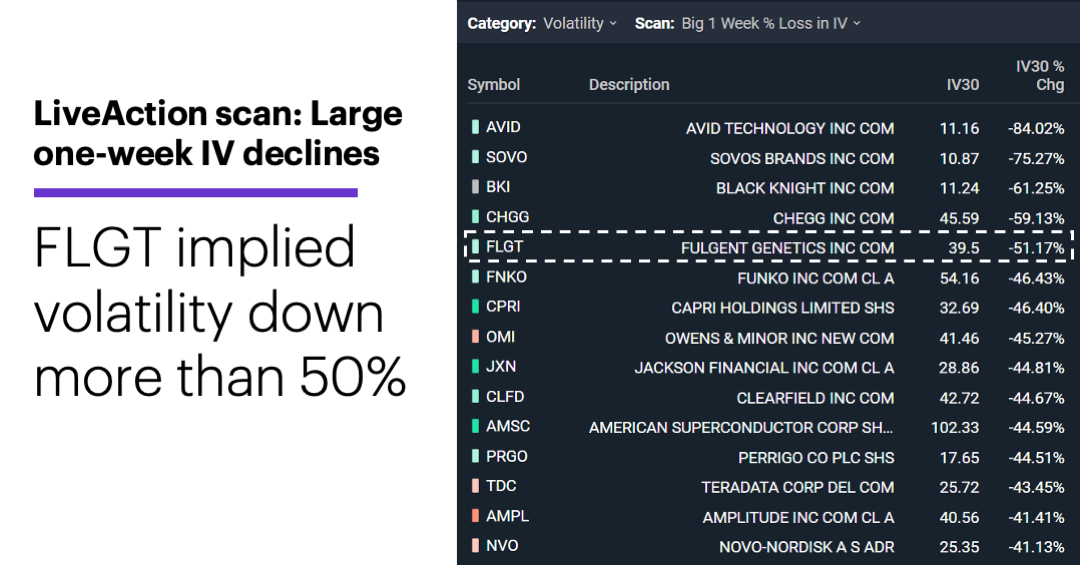
- FLGT options IV down sharply from last week
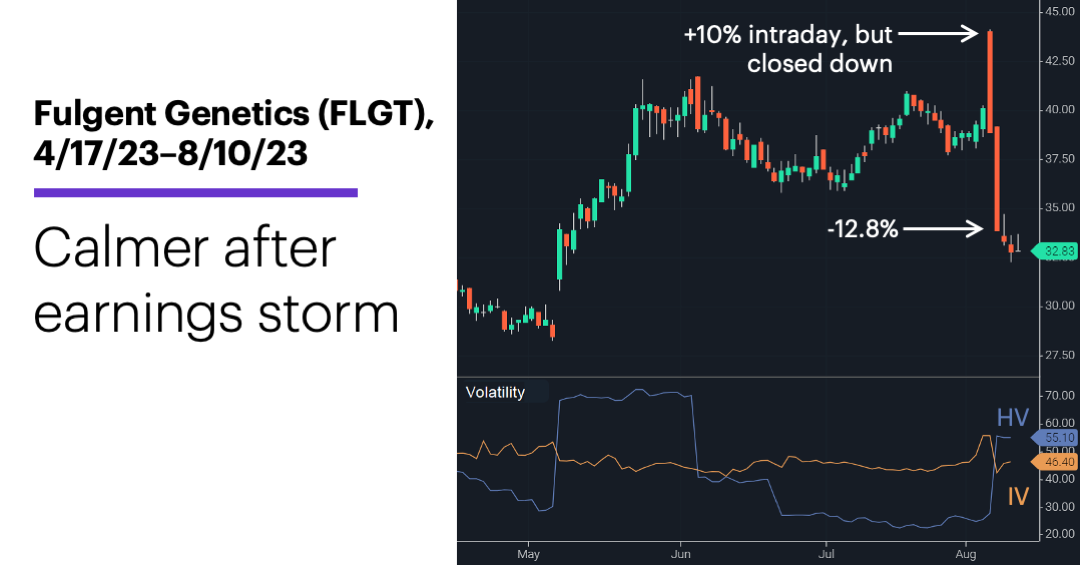
- Stock rallied 10% after earnings before selling off
- Spreads a possible solution to volatility–time conflict
Like many of the other stocks with large one-week declines in options implied volatility (IV), Fulgent Genetics (FLGT) is coming off a recent earnings release. On Thursday—four trading days after announcing its numbers—its IV was down a little more than 51% from a week earlier:
Source: Power E*TRADE. (For illustrative purposes. Not a recommendation.)
That’s typical, in that pre-earnings uncertainty often drives up IV. After that uncertainty is removed, IV can drop just as sharply.
In this case, FLGT shares certainly delivered volatility around earnings. While the company topped its headline numbers, it appeared to disappoint on forward guidance.1 The stock rallied 10% intraday on August 4 before closing down 3%, then sold off an additional 12.8% on August 7. The stock has fallen more since then, but much less aggressively:
Source: Power E*TRADE. (For illustrative purposes. Not a recommendation.)
The bottom of the chart also shows the IV decline since earnings, even though historical volatility (HV), which represents the stock’s price movement, is still high. Because lower IV can translate into lower options prices, some traders may have considered buying FLGT options in recent days—regardless of whether they were bullish or bearish on the stock.
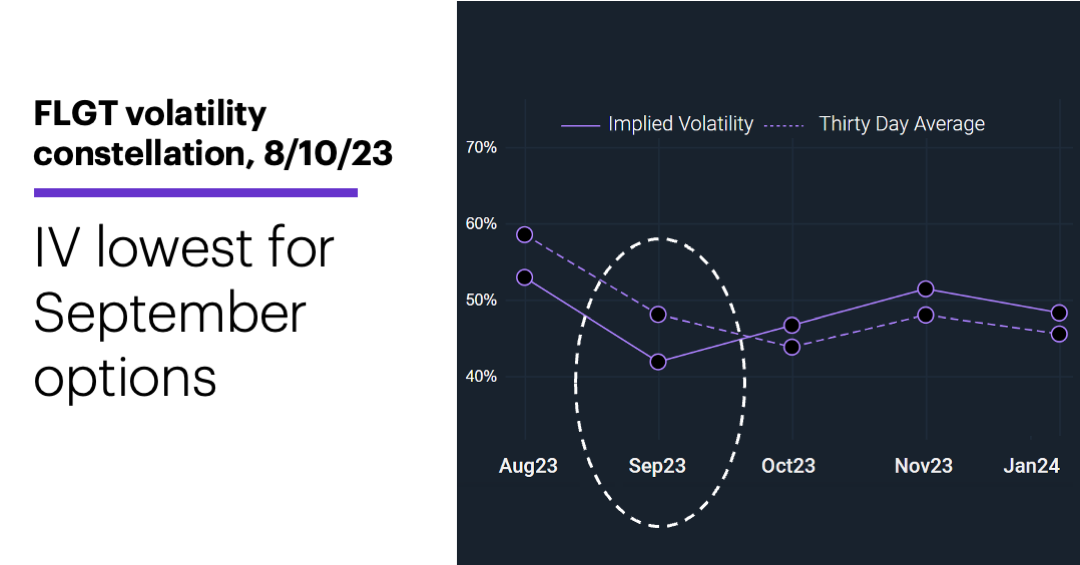
Fair enough, but FLGT’s volatility constellation highlighted a potential complication for would-be options buyers. Of the next five expirations, the September options had the lowest outright IV, which was also below its 30-day average:
Source: Power E*TRADE. (For illustrative purposes. Not a recommendation.)
It stands to reason that some potential option buyers may have thought the September options were a good choice for long options trades, all else being equal. The catch: With just five weeks until expiration, it wouldn’t be too long before these options began losing their time value at an accelerated rate. In other words, the options that may have looked most attractive from a volatility perspective may not have been the best choice in terms of time decay. For very short-term traders, this may not be an issue. But for those operating on time frames of weeks rather than hours or days, it can have a real impact.
That’s why some traders use vertical options spreads. For example, instead of simply buying an at-the-money call, a bullish trader could simultaneously sell an out-of-the-money call with the same expiration—say, pairing a long September $35 with a short September $45 call. The resulting bull call spread has the potential to profit if the stock rallies (up to the short option’s strike price), and the short option—which benefits from time decay—offsets some of the long option’s loss of time value. Similarly, a trader who thought the stock had more downside could buy an at-the-money put and sell an out-of-the-money (lower strike) put to create a bear put spread.
Volatility and time are just two of the factors affecting an options price. While having any factor working in your favor is an advantage, traders need to make sure a potential edge in one area isn’t being offset by a disadvantage in another. In the right circumstances, spreads may help traders bridge that gap.
Market Mover Update: Stocks initially rallied Thursday after the Consumer Price Index (CPI) showed inflation was steady to lower last month, but the market gave up almost all of its gains as the day wore on. The S&P 500 (SPX) closed marginally higher, while the Nasdaq 100 (NDX) closed up only 0.2% after being gaining as much as 1.8% intraday (see “Nasdaq highs and lows”).
September WTI crude oil futures (CLU3) hit a fresh year-to-date intraday high of $84.89 on Thursday before reversing to close sharply lower (see “Oil rally nears test”).
Mattel (MAT) return in the 20 trading days ending July 13 (about a week before the “Barbie” movie premiere): +14.7%, more than four times as much as the SPX. Mattel (MAT) return in the 20 trading days since: -1.3% (see “Welcome to the trading dollhouse”).
Today’s numbers include (all times ET): Producer Price Index (8:30 a.m.), Consumer Sentiment (10 a.m.).
Today’s earnings include: Spectrum Brands (SPB).
Click here to log on to your account or learn more about E*TRADE's trading platforms, or follow the Company on Twitter, @ETRADE, for useful trading and investing insights.
1 StreetInsider.com. Fulgent Genetics, Inc. (FLGT) Tops Q2 EPS by 25c. 8/4/23.