Options trade inventory
- XP put volume exceptionally high as stock tested lows
- Put volume more than 135 times the daily average
- Related trades in different expirations highlight possible “rollovers”
Some of Thursday’s most heavily traded stock options showed why traders would be wise to run through a quick checklist before jumping to conclusions about the implications of headline-grabbing trade activity.
Although Brazilian financial services company XP (XP) was far from being one of Thursday’s biggest decliners, it did have the distinction of hitting a new all-time low, trading one cent below its former record intraday low of $13.77 from December 19:
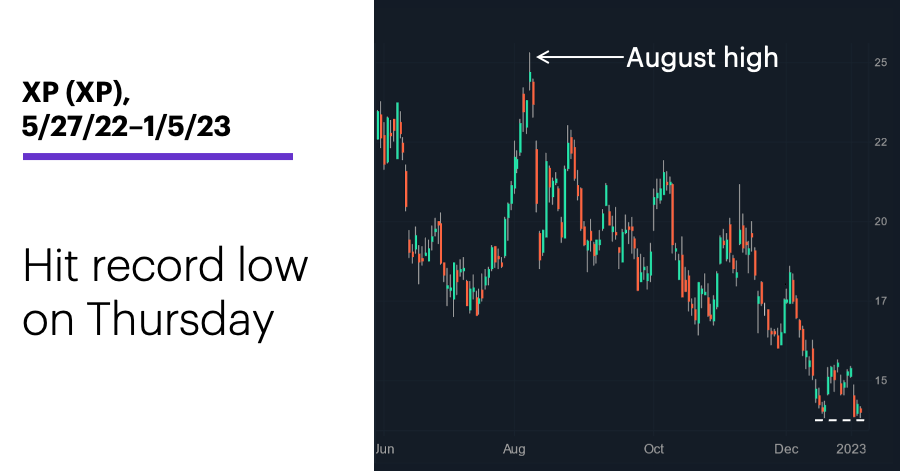
Source: Power E*TRADE. (For illustrative purposes. Not a recommendation.)
That represented a 44% decline from the stock’s August 2022 high, and a 73% drop from its September 2021 record close of $55.17.
Coincidentally or not, traders were notably busy in XP put options—volume was more than 137 times the daily average, and around 179 times the day’s call volume. As noted many times in this space, one of the first steps in gauging whether unusual options volume may be potentially bullish or bearish is to track open interest (OI): An increase in OI means traders established new positions in a contract, while a decrease means they were closing positions.
Comparing trades in different expirations goes hand in hand with OI analysis. For example, an exceptionally large options trade in one contract that is matched by an identical trade in a later expiration may mean a trader was “rolling” a position—liquidating a trade in a nearby contract but re-establishing it in a later month.
Take a look at the following activity in XP’s January and February puts, which accounted for more than half of Thursday’s total put volume. Five thousand contracts traded in both the January $12 and $14 puts (top half of screen). Because the OI in these contracts was greater than 5,000, it’s possible—although not certain—a trader was getting out of these positions:
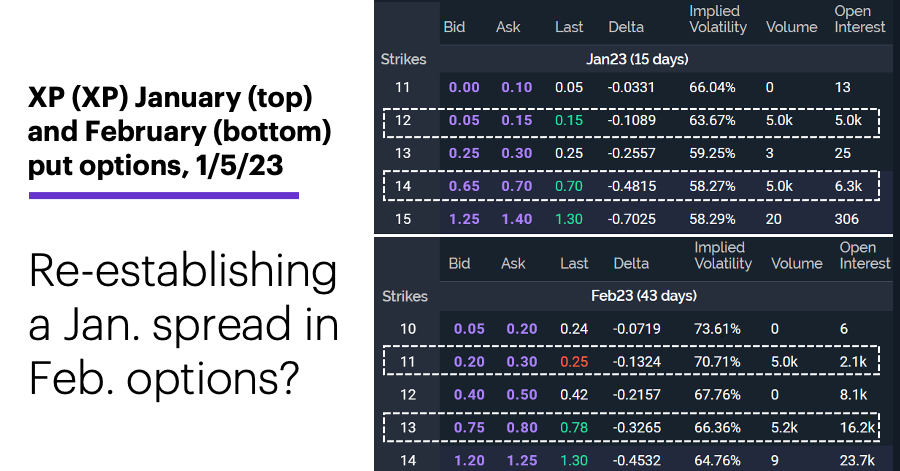
Source: Power E*TRADE. (For illustrative purposes. Not a recommendation.)
The bottom half of the chart shows volume of 5,000 and 5,200 in the February $13 and $11 puts. The OI in the $13 puts was greater than volume, so this could have been another case of liquidation. But because the OI in the February $12 puts was less than the volume, it suggests at least some new positions were being established on Thursday. While it’s entirely possible all these trades are unrelated, it’s also plausible that a large trader was rolling positions in the January options into February—or, perhaps, a single multi-leg position.
The fact that the volume occurred in contracts that are two strike prices apart in both expirations means a trader could have been adjusting a January $14–$12 bear put spread, rolling the position forward to February while also lowering the strike prices to $13 and $11.
That’s not the end of yesterday’s story, though. Trades of 6,000 and 3,000 contracts in XP’s February $17 and $14 puts were matched by trades in the May $16 and $13 puts.
More rollovers, or large traders getting out of the market? Today’s OI total may help clarify how XP traders were positioning themselves as the stock tested its record lows.
Market Mover Update: NovoCure (NVCR) jumped 70% intraday on Thursday after announcing successful trial results of its Tumor Treating Fields for treating lung cancer (see “Breakout signals and volatility realities”). Zai Lab (ZLAB), which partnered with NovoCure on the therapy, rallied as much as 47%.
Today’s numbers include (all times ET): Employment Report (8:30 a.m.), Factory Orders (10 a.m.), ISM Services Index (10 a.m.).
Today’s earnings include: Greenbrier (GBX).
Click here to log on to your account or learn more about E*TRADE's trading platforms, or follow the Company on Twitter, @ETRADE, for useful trading and investing insights.