Trading around support
- HUN put volume more than 100 times average on Tuesday
- But total volume was less than existing open interest
- Strike price has connection to important stock price
Regular visitors to this space are familiar with the importance of not accepting eye-grabbing trades at face value. What may look bullish or bearish on the surface sometimes turns out to be the opposite when you cross reference all the information at your disposal.
We’ve discussed more than a few examples of big options prints that suggested a large player was planting a flag in a certain stock, only to find out the trader was actually closing out an existing position. A 10,000-contract call trade may look like a bullish call to arms, but if the open interest (OI) was 11,000 when it happened—and dropped to 1,000 the next day—it suggests the bull in question decided it was time to head out to pasture.
The picture this week in Huntsman (HUN) was a little different, though. On Tuesday, put volume in the chemical company was more than 100 times average, with 8,800 of the August $23 puts changing hands vs. existing OI of 9,400:
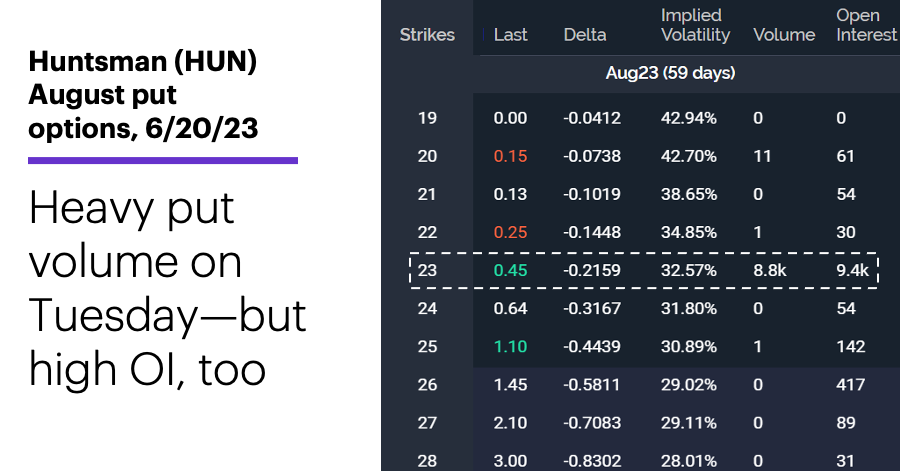
Source: Power E*TRADE. (For illustrative purposes. Not a recommendation.)
Just another case of a large position getting liquidated? On Wednesday, OI ballooned to 17,500—representing more than $40 million of HUN stock—suggesting traders (or a trader) had been adding to positions in this option:
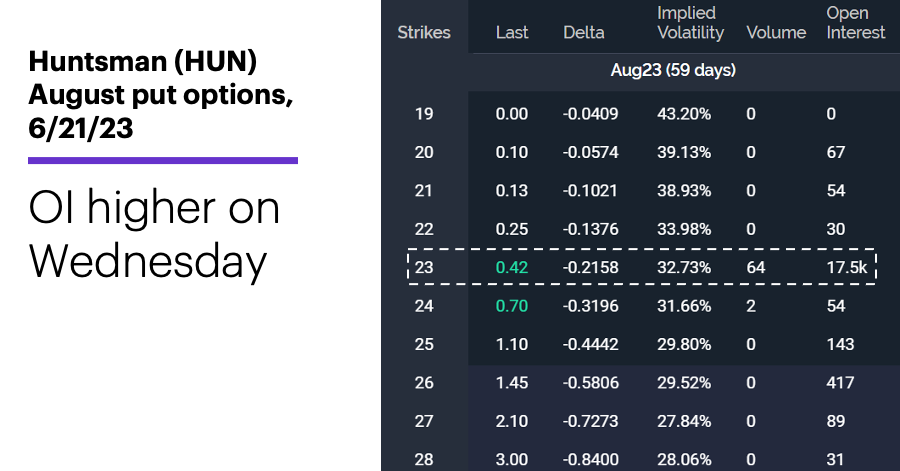
Source: Power E*TRADE. (For illustrative purposes. Not a recommendation.)
With HUN closing at $25.11 on Tuesday, that meant traders who bought the $23 puts and held them until expiration needed the stock fall more than $2.11 (8.4%) for the options to have any value. But even that wouldn’t guarantee a profit. For simplicity, let’s say Tuesday’s trades occurred at an average price of $0.43 (the midpoint of the day’s range). That means HUN would need to be trading below $22.57 (the strike price minus the option premium) before the options could begin generating a profit.
On the other side of the position, traders who sold the puts on Tuesday and held them would need the stock to be above $23 at expiration, in which case the options would expire worthless and the traders would keep the collected premium—$378,400 on 8,800 contracts (again, using $0.43 as the representative trade price).
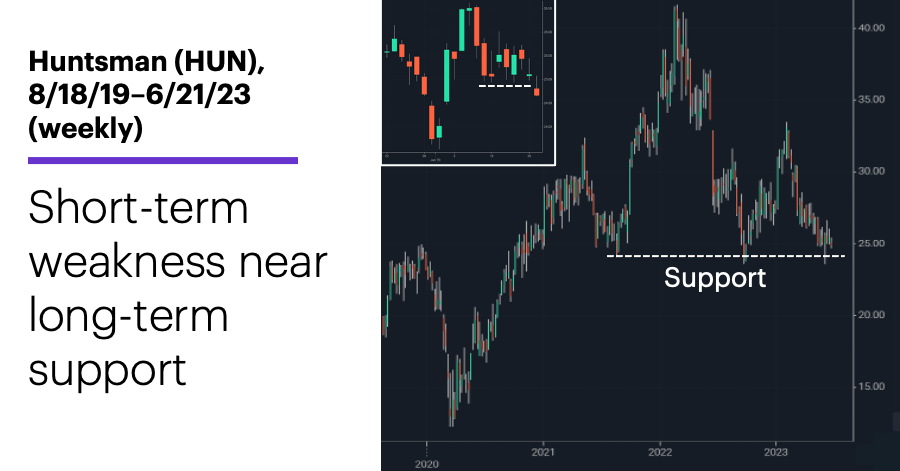
Tuesday’s put trades—especially their strike price—become even more interesting in light of HUN’s price action. The stock had more than tripled off its 2020 lows when it hit record highs above $41 in February 2022. As of Wednesday, though, it was down more than 39% from that high:
Source: Power E*TRADE. (For illustrative purposes. Not a recommendation.)
The upper left corner contains a daily chart of HUN from May 22 to Wednesday morning. It shows the stock broke below the bottom of a short-term consolidation that followed its sharp, two-day pullback earlier this month. (HUN bounced back into positive territory later in the trading session.)
The early June low of $23.52 is significant because, as the main (weekly) chart shows, not only is it a little above a strike price with 17,500 open put positions, it represents long-term support. Prices rallied off this approximate level in both 2021 and 2022.
August options expiration may be a couple of months away, but whether this support level holds once again may dictate which side of the trades in the $23 puts comes out on top.
Market Mover Update: Options traders had been pricing in a big move in uniQure (QURE), and yesterday they got it. The stock fell nearly 46% intraday to hit its lowest level since October 2017 after releasing clinical results for its Huntington’s disease therapy (see “Listening to volatility”).
Today’s numbers include (all times ET): Weekly jobless claims (8:30 a.m.), Chicago Fed National Activity Index (8:30 a.m.), Current Account (8:30 a.m.), Existing Home Sales (10 a.m.), Jerome Powell Senate testimony (10 a.m.), Loretta Mester speech (10 a.m.), Leading Economic Indicators (10 a.m.), EIA Natural Gas Report (10:30 a.m.), EIA Petroleum Status Report (11 a.m.).
Today’s earnings include: Accenture (ACN), Darden Restaurants (DRI), FactSet Research (FDS).
Click here to log on to your account or learn more about E*TRADE's trading platforms, or follow the Company on Twitter, @ETRADE, for useful trading and investing insights.