October more green than red
- October often volatile, but not necessarily negative
- Sell-offs have often reversed before month-end
- October slightly more bullish after down Septembers
Let’s not beat around the bush: Since 1985, the S&P 500’s (SPX) median October return of 2% has been the second-largest of any month of the year, and over the past 20 years October has had the highest median return.1 (Gains of 6.9% in 2021 and 8% in 2022 certainly helped pad the month’s recent stats.)
That probably doesn’t prevent some investors from biting their fingernails a bit, given many of the market’s biggest sell-offs have occurred in October, including the 1987 crash and the 2008 financial crisis meltdown:
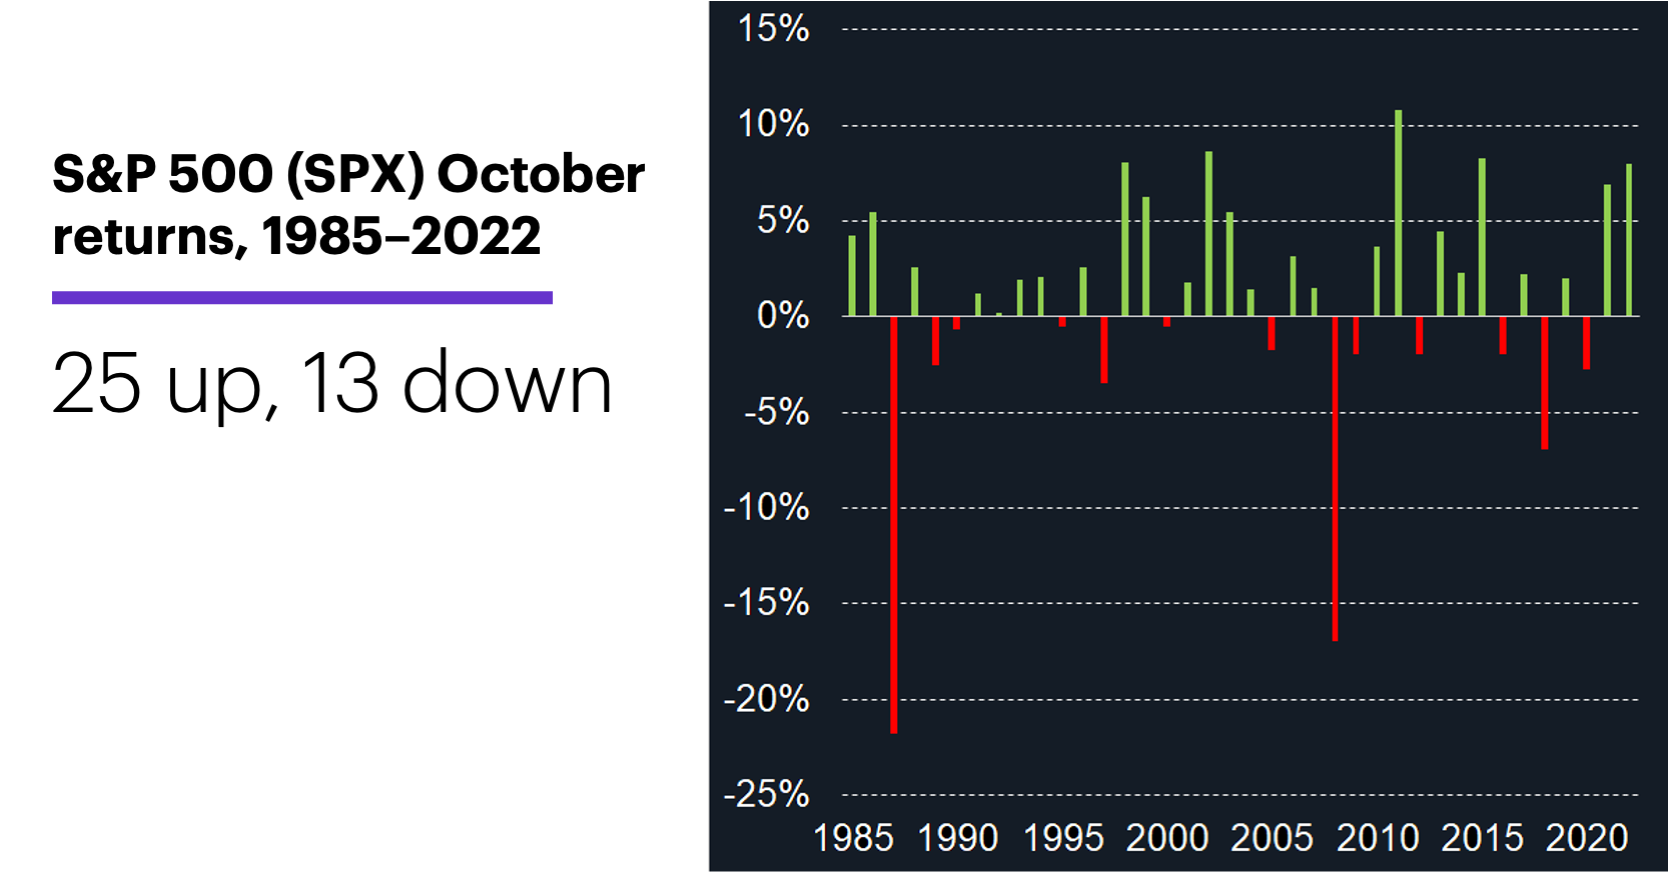
Source: Power E*TRADE. (For illustrative purposes. Not a recommendation. It is not possible to directly invest in an index.)
While those big losses—22% in 1987 and 17% in 2008—definitively stand out, the primary takeaway of this chart is that October has been an up month for the SPX in 25 of the past 38 years.
But the historical record also clearly shows October’s reputation for volatility isn’t a myth. The market has sometimes dropped sharply in October, even if in many cases it recovered by the end of the month. The SPX’s average intramonth decline (the move from the final close of the previous month to the lowest low of the current month) has typically been bigger in October (nearly -5%) than in any other month of the year:
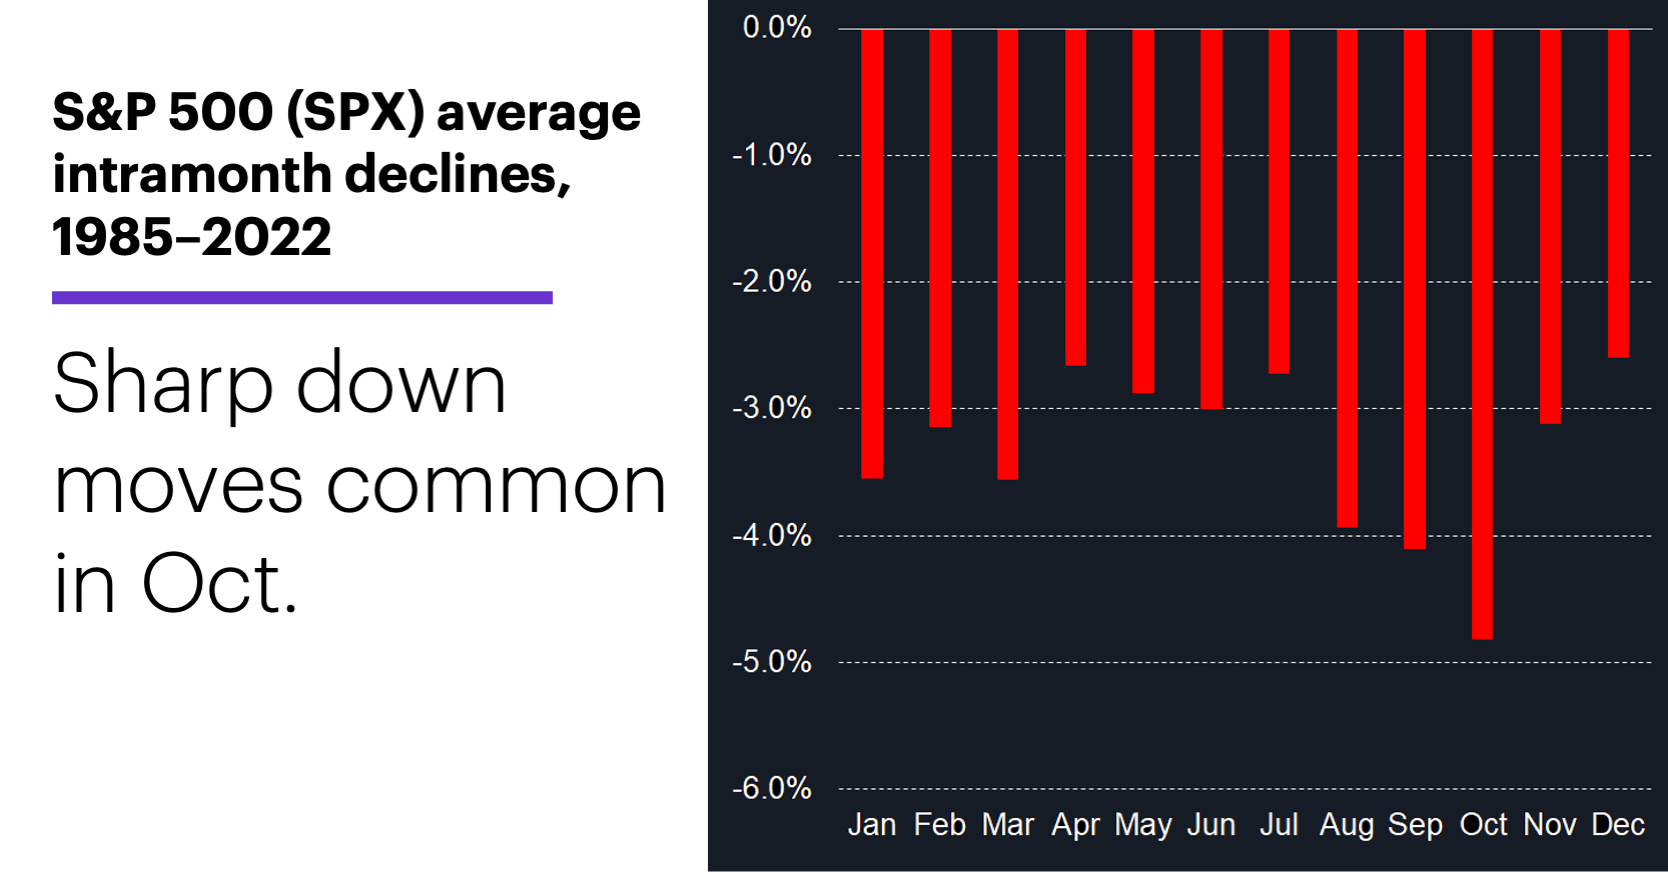
Source: Power E*TRADE. (For illustrative purposes. Not a recommendation. It is not possible to directly invest in an index.)
But here’s the flipside: The SPX also has the largest average intramonth gain of any month since 1985 (4.3%). In other words, while there’s been plenty of market volatility in October, a great deal of it has been the “good” kind—to the upside. The catch is that the good has often followed the bad—that is, the market has sometimes rebounded energetically in October after selling off sharply.
A final chart offers a different perspective on this volatility:
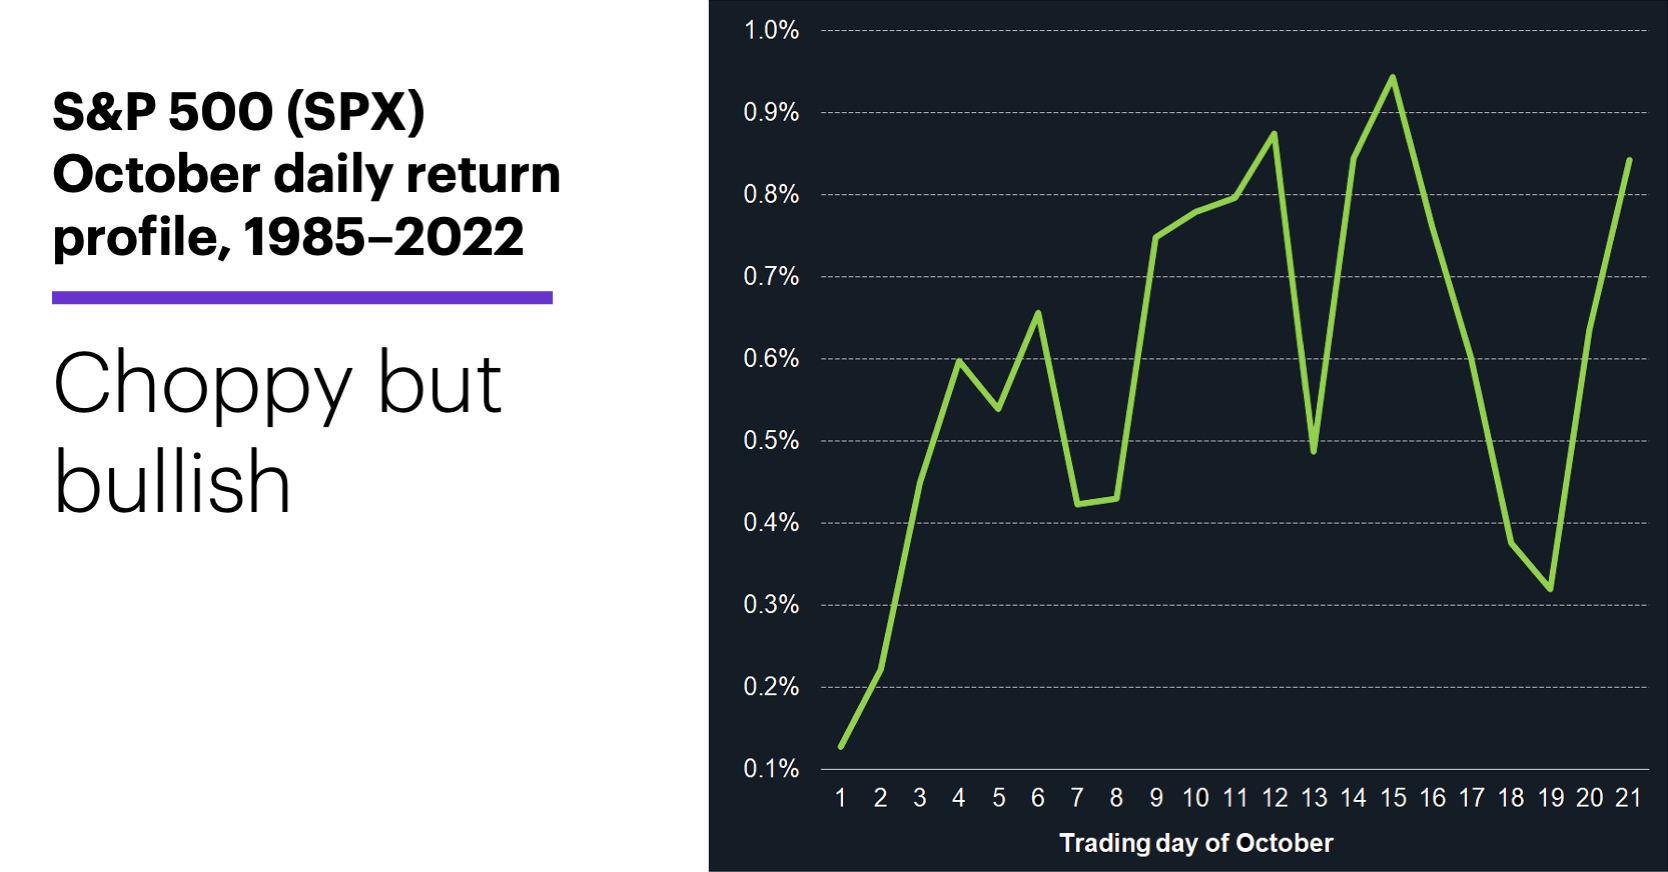
Source: Power E*TRADE. (For illustrative purposes. Not a recommendation. It is not possible to directly invest in an index.)
This intramonth profile shows the SPX’s average move from the last day of September to each trading day of October. The picture is different, but the story is the same: The road has often been rocky, but October has, more often than not, ended up at a bullish destination.
Over the years, investors who avoided getting shaken out of the market by sharp October sell-offs often saw their losses erased by the end of the month, while traders who bought on weakness had the potential to capture outsized gains: The SPX’s median return from October’s low to its final close was 4.7%—larger than in any other month.
Finally, this year will mark the 22nd time since 1985 the SPX has declined in September. The index’s median return after its previous negative Septembers was 2.1%, while its median return after positive Septembers was only 1.5%.
In any given year, of course, major events on the ground will override any potential seasonal patterns. But tendencies like the ones shown here offer useful insights into the way the market often defies expectations.
Market Mover Update: November WTI crude oil futures (CLX3) hit a new contract high of $95.03 on Thursday, but reversed to close down on the day.
Today’s numbers include (all times ET): Advance trade balance (8:30 a.m.), Personal Income and Spending (8:30 a.m.), PCE Price Index (8:30 a.m.), Advance Retail and Wholesale Inventories (8:30 a.m.), Chicago PMI (9:45 a.m.), Consumer Sentiment (10 a.m.).
Today’s earnings include: Carnival (CCL).
Click here to log on to your account or learn more about E*TRADE's trading platforms, or follow the Company on Twitter, @ETRADE, for useful trading and investing insights.
1 All figures reflect S&P 500 (SPX) monthly prices, December 1984–October 2022. Supporting document available upon request.