Friday pivot snaps streak
- Bulls snatch week from bears as jobs surprise, oil slides
- Tech rebounds, Russell 2000 negative for year
- This week: Inflation, Fed minutes, earnings season
Seasonal volatility was on full display in a choppy—but positive—first week of October that concluded with one of the bigger economic surprises of the past few months.
After Friday’s monthly employment report showed the US economy added nearly twice as many jobs as expected in September, it looked like the week’s losses could transition from modest to meaningful. The S&P 500 (SPX) fell nearly 1% in early trading, but by the closing bell it had logged its biggest up day since August 29 and snapped a four-week losing streak in the process:
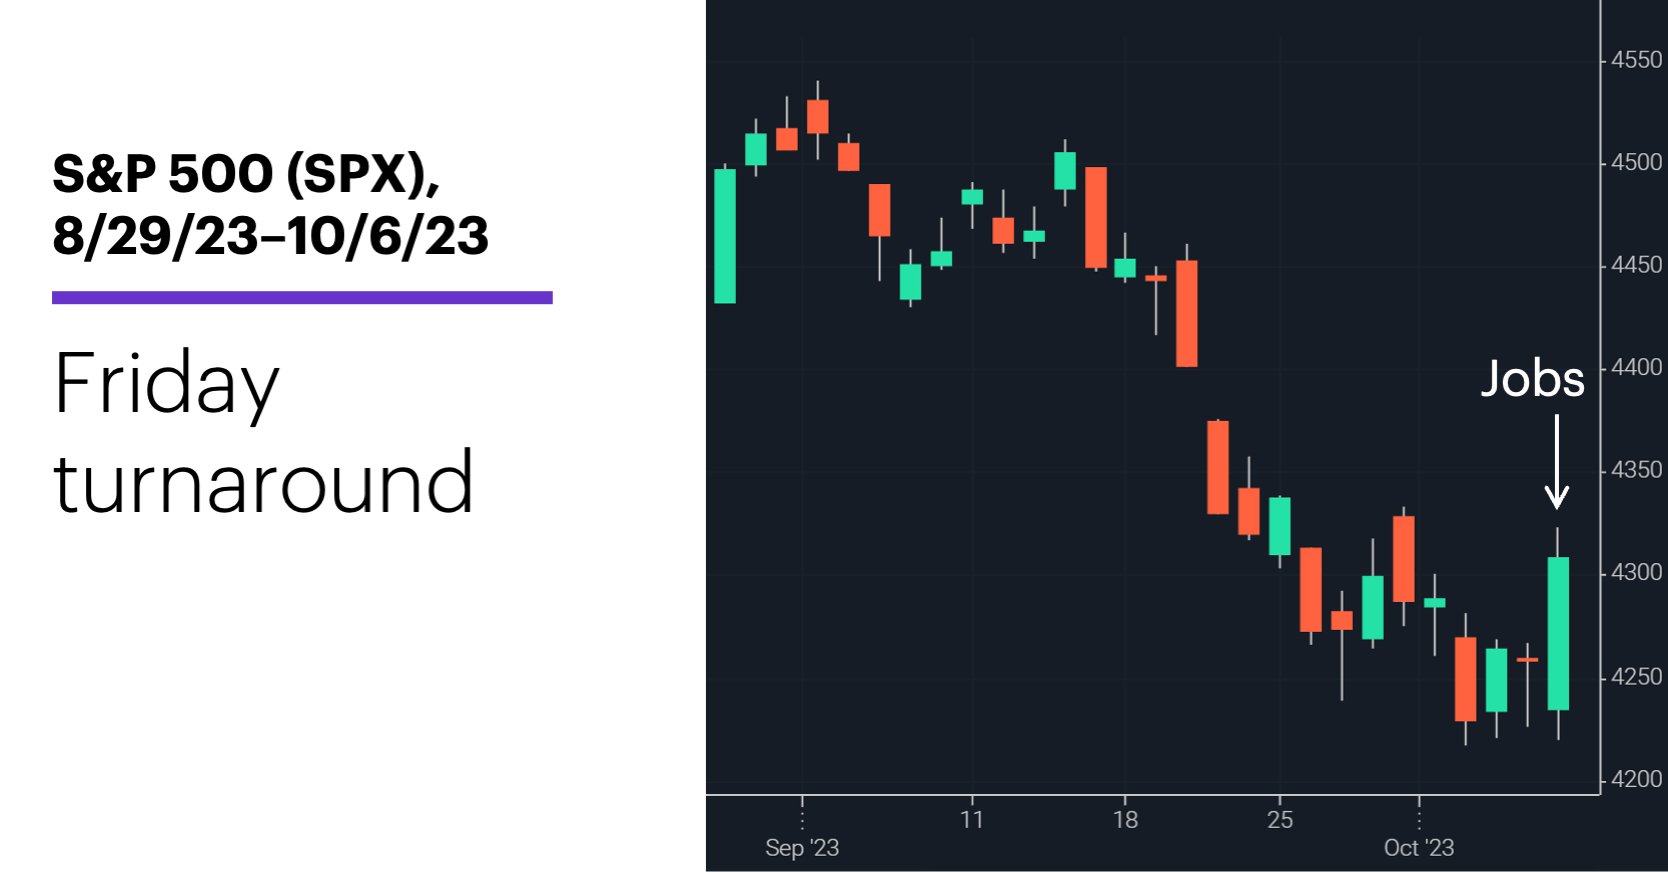
Source: Power E*TRADE. (For illustrative purposes. Not a recommendation. Note: It is not possible to invest in an index.)
The headline: Stocks swing, bonds fall to start October.
The fine print: Judging by its initial reaction to Friday’s jobs surprise, the market still appears to be confused about whether good economic news is good or bad for stocks. The Fed has made cooling the jobs market a linchpin of its inflation battle, and so far they haven’t succeeded. (One mitigating factor: Rising wages tend to fan the flames of inflation, but the report showed they were steady to lower last month.) Prognosis: Rates still look higher for longer.
The move: The benchmark 10-year T-note yield stole the spotlight again last week, hitting 4.8% for the first time since August 2007 before ending the week a little below that threshold.
The scorecard: The Nasdaq 100 (NDX) gained the most ground, while the Russell 2000 (RUT) ended the week in negative territory for the year:
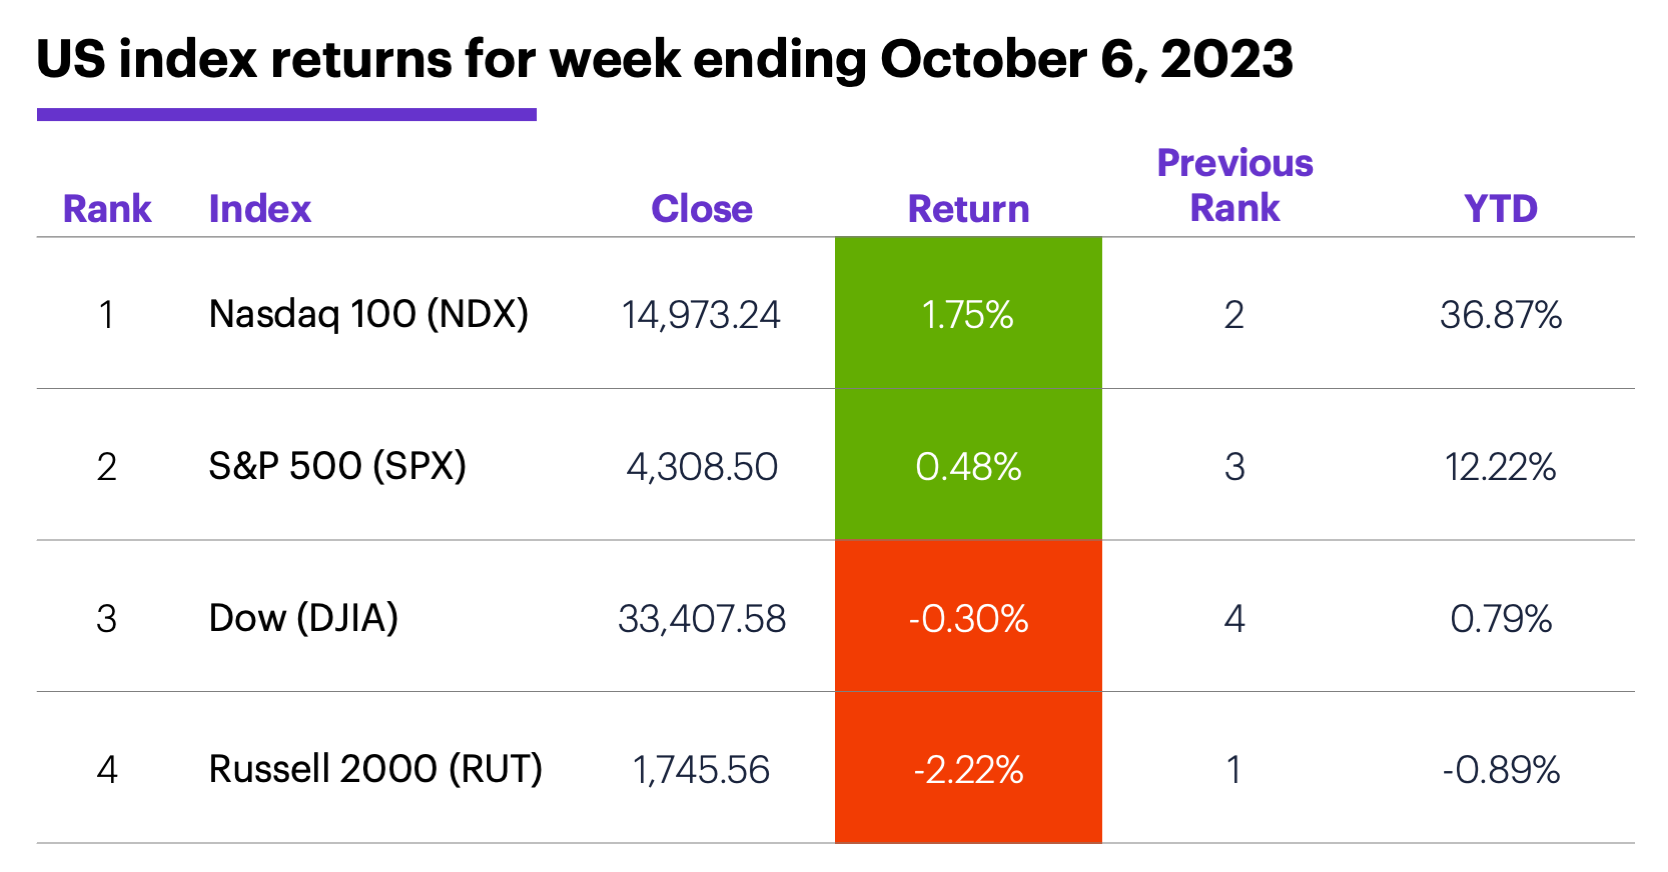
Source (data): Power E*TRADE. (For illustrative purposes. Not a recommendation.)
Sector returns: The strongest S&P 500 sectors last week were communication services (+3.3%), information technology (+3.2%), and health care (+1.1%). The weakest sectors were energy (-5.1%), consumer staples (-3.1%), and utilities (-2.7%).
Stock movers: Mirati Therapeutics (MRTX) +45% to $62.38, SP Plus (SP) +45% to $51.22, both on Thursday. On the downside, Avita Medical (RCEL) -26% to $10.80 on Monday, A10 Networks (ATEN) -27% to $11.04 on Wednesday.
Futures: November WTI crude oil (CLX3) suffered its biggest down week since March, falling nearly $8 to $82.80. December gold (GCZ3) slid for a third week, closing Friday at $1,843.70. Week’s biggest gains: November natural gas (NGX3) +13.5%, November orange juice (OJX3) +7.9%. Week’s biggest losses: November heating oil (HOX3) -11.9%, November WTI crude oil (CLX3) -8.7%.
Coming this week
Inflation and the Fed—what else?—dominate this week’s economic calendar:
●Tuesday: NFIB Business Optimism Index, Wholesale Inventories, Consumer Inflation Expectations
●Wednesday: Producer Price Index (PPI), FOMC minutes
●Thursday: Consumer Price Index (CPI)
●Friday: Import Price Index, Consumer Sentiment
A new earnings season gets underway this week:
●Monday: Saratoga Investment (SAR)
●Tuesday: Neogen (NEOG), PepsiCo (PEP), AZZ (AZZ)
●Wednesday: Karooooo (KARO)
●Thursday: Delta Air Lines (DAL), Domino’s Pizza (DPZ), Fastenal (FAST), Walgreen’s (WBA), Smart Global (SGH)
●Friday: Blackrock (BLK), Citigroup (C), JPMorgan Chase (JPM), Progressive (PGR), PNC (PNC), UnitedHealth (UNH), Wells Fargo (WFC)
Check the Active Trader Commentary each morning for an updated list of earnings announcements, IPOs, economic reports, and other market events.
Snapping the streak
Strip away the chatter currently swirling around the market—high interest rates, Fed policy, seasonal patterns, and the lingering possibility of a government shutdown—and you’re left with price action. And last week it was notable, in that the SPX came close to its fifth-straight down week before turning things around with Friday’s rally.
While the SPX has often lost additional ground in the two months after five consecutive down weeks, it’s tended to perform much better after snapping four-week losing streaks. The following chart compares the SPX’s median returns for all one-week, four-week, and eight-week periods since 1957 (blue columns) to its median returns after snapping four-week losing streaks (green columns):
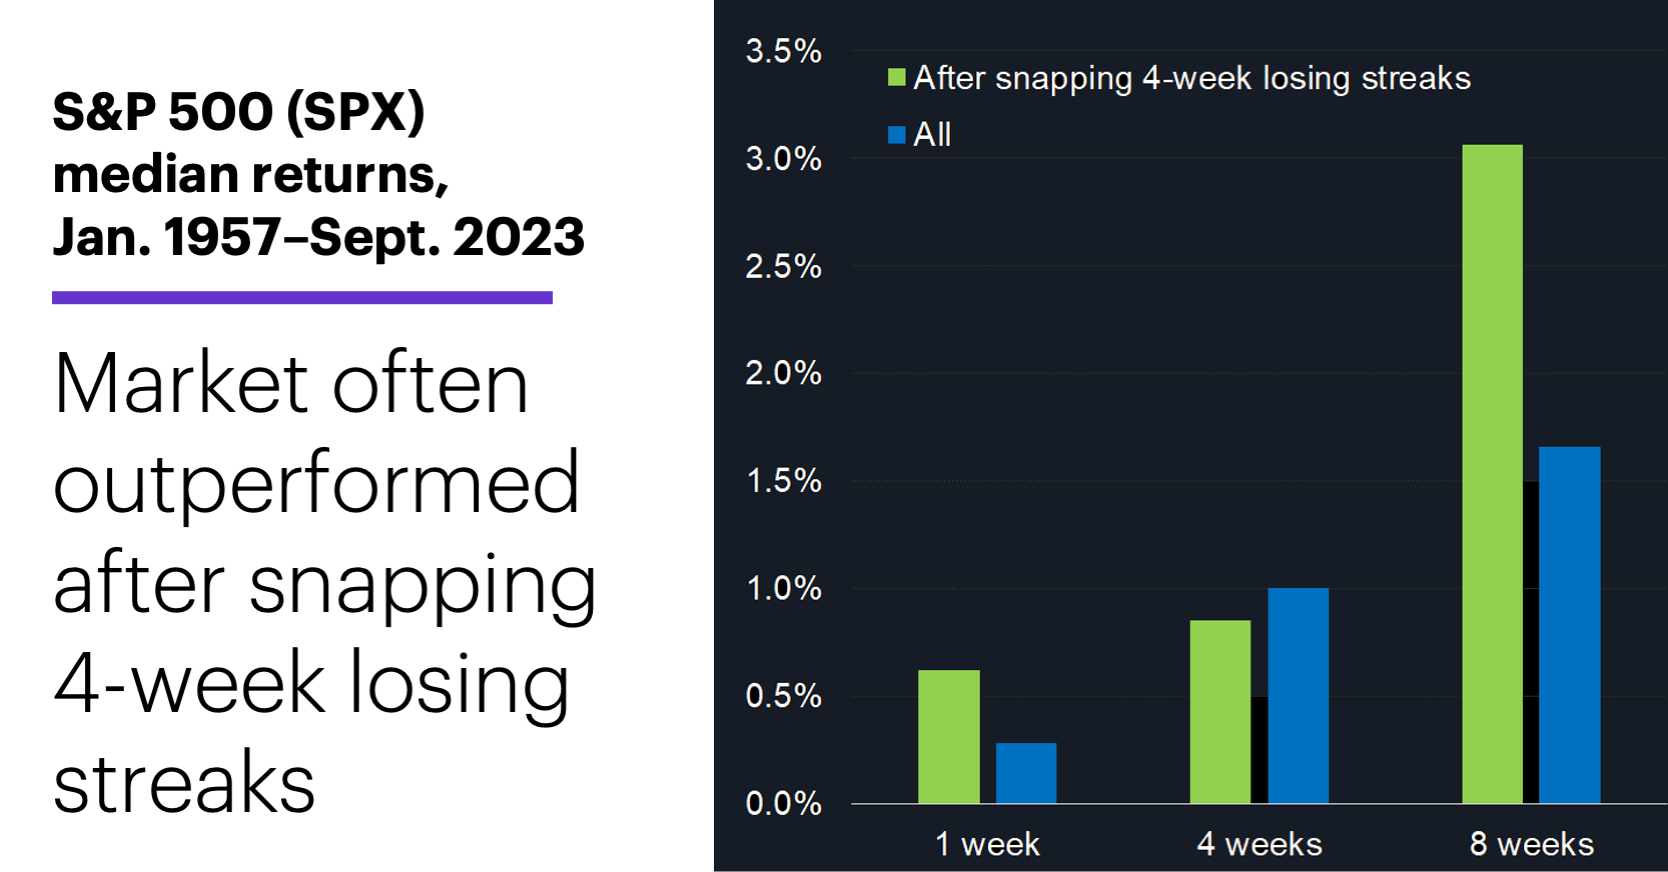
Source (data): Power E*TRADE. (For illustrative purposes. Not a recommendation.) Note: It is not possible to invest in an index.
While the SPX’s overall median eight-week return is +1.7%, its median eight-week return after snapping four-week losing streaks is +3.1%.1 By contrast, the SPX’s median eight-week return after five-week losing streaks was -0.7%.
Click here to log on to your account or learn more about E*TRADE's trading platforms, or follow the Company on Twitter, @ETRADE, for useful trading and investing insights.
1 All figures in this section reflect S&P 500 (SPX) weekly prices, 1957–2023. “Five-week losing streak” refers to five consecutive lower weekly SPX closing prices that were not preceded by a lower weekly close (27 instances since 1957). “Snapping a four-week losing streak” refers to a higher weekly close following four consecutive lower weekly closes (48 instances since 1957). Supporting document available upon request.