On to October
- Stock skid reaches 4 weeks, bond yields continue climb
- Energy sector rolls as US crude oil prices tag $95
- This week: Jobs, Construction Spending, Factory Orders
Bulls were no doubt happy to close the books on last month, as a fourth-straight down week sent the S&P 500 (SPX) to its fourth-consecutive negative September (and seventh of the past decade), and its first negative quarter in a year.
After falling to its lowest low since June 1 last Wednesday, the SPX attempted to turn the week around, but a Thursday-Friday rally lost momentum with the clock ticking on a government shutdown deadline:
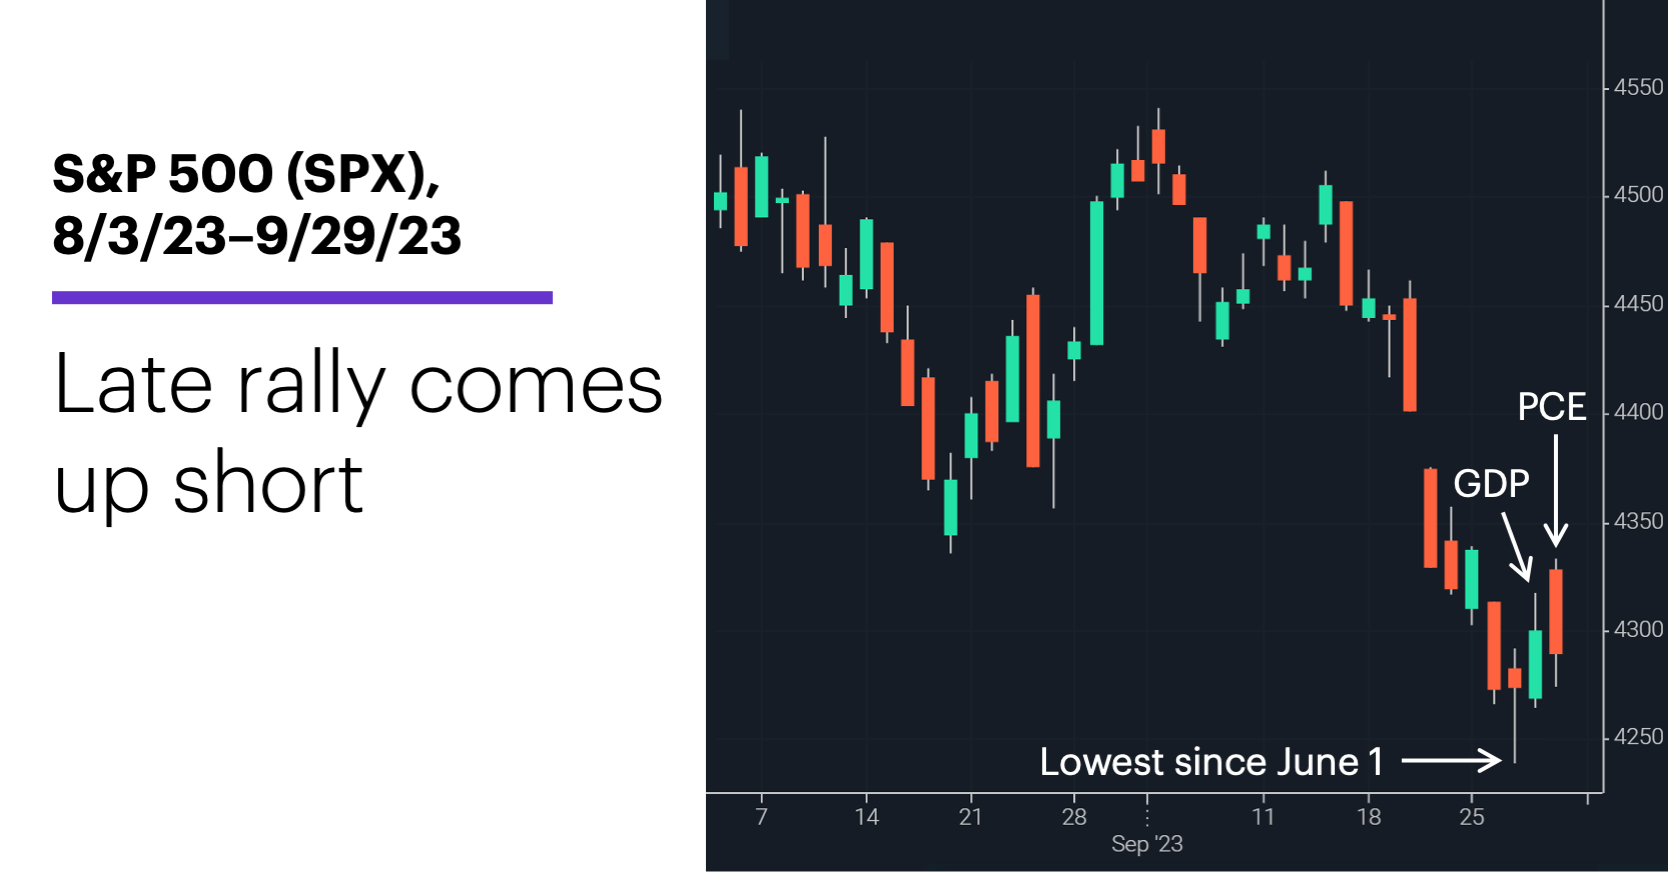
Source: Power E*TRADE. (For illustrative purposes. Not a recommendation. Note: It is not possible to invest in an index.)
The headline: Bears sweep September.
The fine print: Friday’s Core PCE Price Index (the Fed’s preferred inflation gauge) came in below expectations, a positive for investors eager for signs of an economic cooldown that could allow the Fed to back off from its hawkish interest rate stance. But an unchanged final estimate of Q2 GDP, stronger-than-expected durable goods orders, and low weekly jobless claims suggested the finish line is still a ways off.
The moves: The 10-year T-note yield continued its climb, closing at 4.64% last Wednesday. The US dollar index (DXY) hit 106.84 on the same day—the highest it’s been since last November.
The number: 51, the number of trading days since the SPX rallied to within 5% of its all-time high (see “51 and counting,” below).
The scorecard: The Russell 2000 (RUT) and Nasdaq 100 (NDX) snapped their weekly losing streaks, the SPX and Dow Jones Industrial Average (DJIA) didn’t:
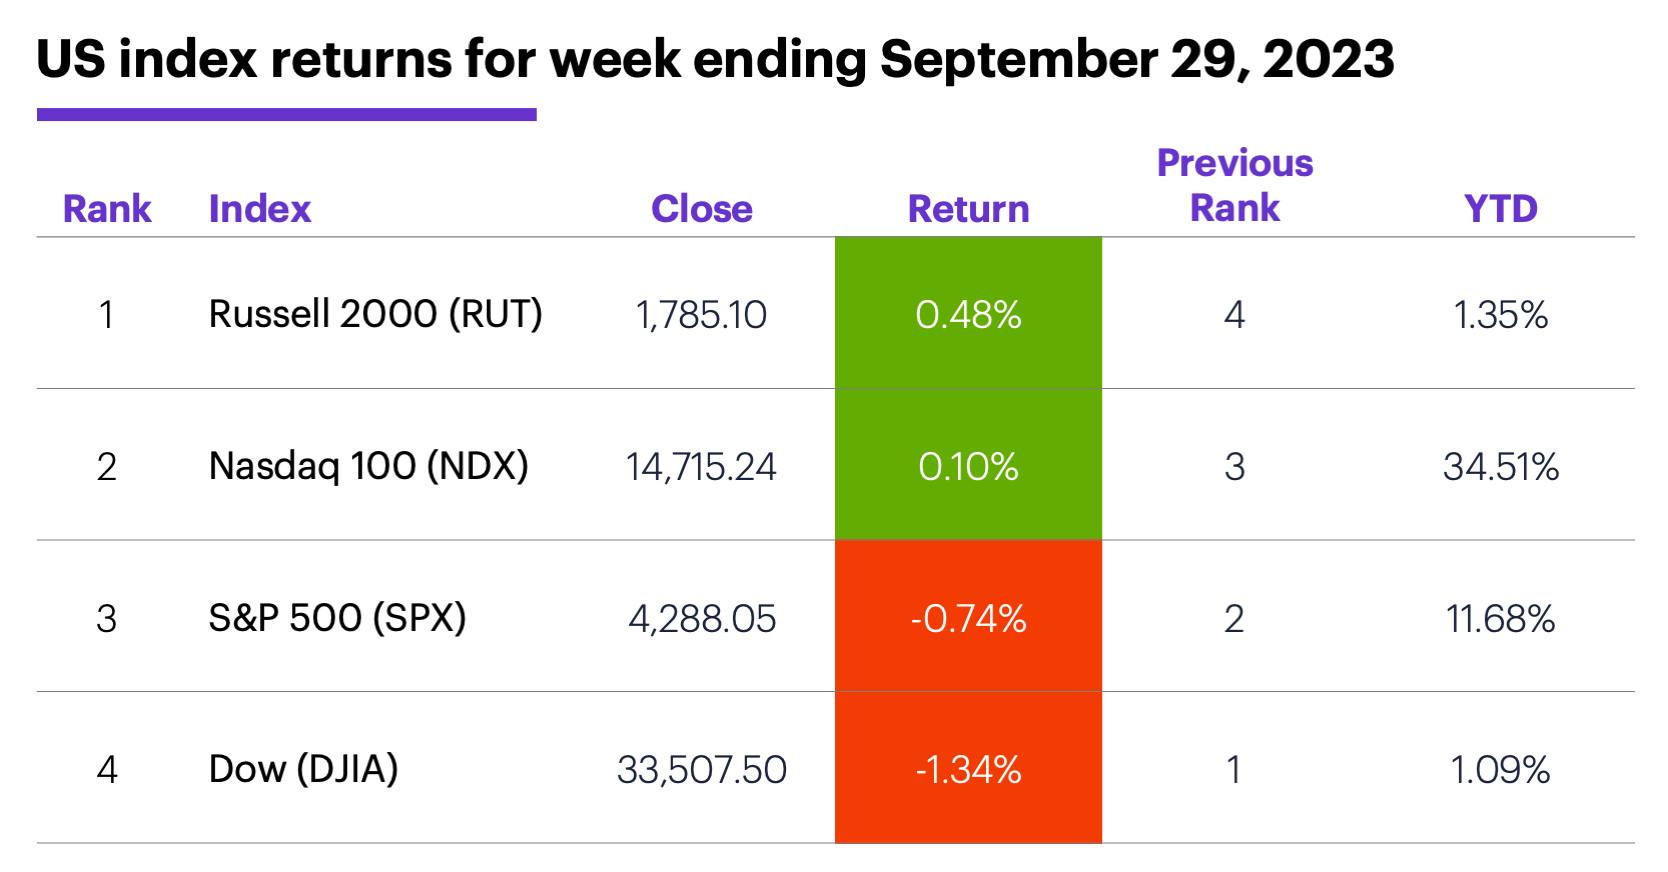
Source (data): Power E*TRADE. (For illustrative purposes. Not a recommendation.)
Sector returns: The strongest S&P 500 sectors last week were energy (+1.3%), materials (+0.2%), and communication services (unchanged). The weakest sectors were utilities (-7%), consumer staples (-2.1%), and financials (-1.6%).
Stock movers: Immunovant (IMVT) +97% to $39.96 and Intercept Pharmaceuticals (ICPT) +79% to $18.71, both on Tuesday. On the downside, Morphic (MORF) -37% to $23.14 on Monday, United Natural Foods (UNFI) -27% to $13.73 on Tuesday .
Futures: November WTI crude oil (CLX3) hit a new contract high of $95.03 last Wednesday, then pulled back to end the week at $90.79. December gold (GCZ3) closed Friday at a fresh year-to-date low of $1,866.10. Week’s biggest gains: October butter (CBV3) +5.2%, December aluminum (ALZ3) +4.9%. Week’s biggest losses: December spring wheat (MWZ3) -8%, December hard red wheat (KWZ3) -6.7%.
Coming this week
It’s all about employment this week:
●Monday: S&P Global Manufacturing PMI, ISM Manufacturing Index, Construction Spending
●Tuesday: Job Openings and Labor Turnover Survey (JOLTS)
●Wednesday: ADP Employment Change, S&P Global Services PMI, ISM Services Index, Factory Orders
●Thursday: Challenger job cuts report, trade balance
●Friday: Employment Report, Consumer Credit
This week’s earnings include:
●Tuesday: McCormick (MKC), Cal-Maine Foods (CALM), Smart Global (SGH)
●Wednesday: Acuity Brands (AYI), Helen Of Troy (HELE), RPM (RPM)
●Thursday: Conagra (CAG), Constellation Brands (STZ), Aehr Test Systems (AEHR), Levi Strauss (LEVI)
Check the Active Trader Commentary each morning for an updated list of earnings announcements, IPOs, economic reports, and other market events.
51 and counting
On July 31 we noted that since 1962, the SPX had taken anywhere from 17 to 228 trading days to hit a new record high after falling into a bear market and then rallying to within 5% of its former all-time high.
As of Friday, 51 trading days had passed since the SPX closed less than 5% below its January 2022 all-time high on July 19. That’s a little less than the median wait time (59 trading days) over the past eight bear markets. At the end of last week, the SPX was 10.6% below its former record.
“October more green than red” may provide some perspective for traders wondering whether this month is likely to push the market closer to or further away from its former high.
Finally, Morgan Stanley & Co. recently discussed how a government shutdown could unfold, and what it could mean for the economy and markets.1 “September stumble” shows how the SPX performed immediately before, during, and after the past six shutdowns.
Click here to log on to your account or learn more about E*TRADE's trading platforms, or follow the Company on Twitter, @ETRADE, for useful trading and investing insights.
1 MorganStanley.com. U.S. Policy: The Economic Impact of a Government Shutdown. 9/27/23.