Stocks step into October
- Yield spike trips up tech, market closes books on red September
- Fed inflation gauge comes in hot, oil hits three-year high
- This week: Jobs report, service-economy data, yield watch
As they get ready for the first full week of October, many investors are probably still bidding a not-so-fond farewell to September, having just wrapped up a down month with a down week that left the S&P 500 (SPX) near its two-month lows.
The SPX fell more than 2% last Tuesday amid a jump in long-term interest rates that particularly pressured tech stocks, which tend to underperform when interest rates are higher. The SPX was just 10 points away from erasing its entire Q3 gain when the curtain finally fell on September, but a big Friday rebound ended the week—and kicked off the new month—on a bullish note:
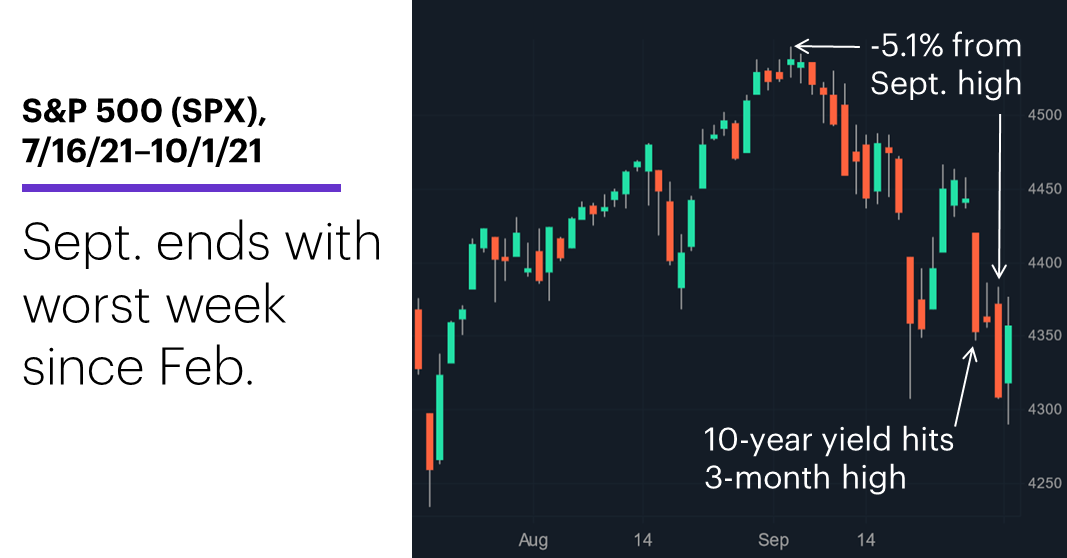
Source: Power E*TRADE. (For illustrative purposes. Not a recommendation.)
The headline: Stocks suffer third-biggest down week of 2021 amid rate spike.
The fine print: Aside from interest rates and an elevated PCE Price Index inflation reading, most of the week’s news and numbers appeared to be relatively market friendly: Congress avoided a government shutdown (but the October 18 debt-ceiling deadline still looms), the Durable Goods report was much stronger than expected, manufacturing activity topped expectations, and pending home sales surged.
The number: 1.53%, the 10-year T-note yield’s high last Tuesday—its highest level since June 17, and up 17% from six days earlier.
The scorecard: With tech bearing the brunt of last week’s selling, the Nasdaq 100 (NDX) was the weakest major US index for a third-straight week:
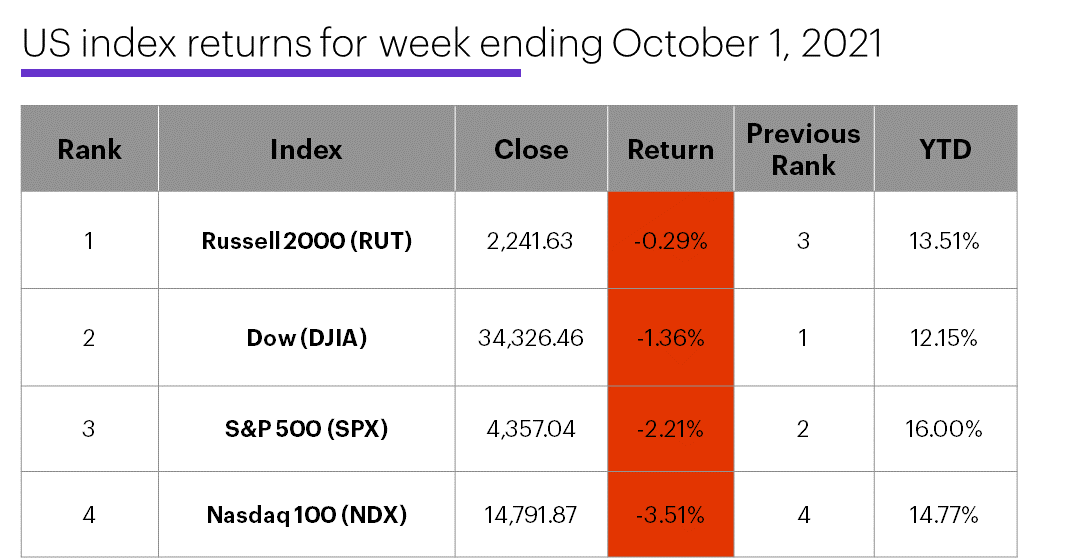
Source: Power E*TRADE. (For illustrative purposes. Not a recommendation.)
Sector roundup: The strongest S&P 500 sectors last week were energy (+5.7%), financials (-0.3%), and materials (-1%). The weakest sectors were health care (-3.6%), information technology (-3.4%), and consumer staples (-2.7%).
Highlight reel: Gogo (GOGO) +38% to $16.82 and United Natural Foods (UNFI) +24% to $46.98 on Tuesday. On the downside, eXp World Holdings (EXPI) -16% to $43.28 on Tuesday, VIR Biotechnology (VIR) -21% to $34.35 on Friday.
Futures action: Oil prices rallied to a three-year high last week before taking a breather. November WTI crude oil (CLX1) hit a new contract high of $76.67/barrel last Tuesday before closing Friday at $75.88, while international November Brent crude oil (BX1) topped $80—the approximate level our colleagues at Morgan Stanley cited as a potential “demand destruction” level.1 December gold (GCZ1) closed up for the week at $1,758.40/ounce, mostly thanks to a 2% rally to $1,757.50 last Thursday—its biggest up day in more than a month
Coming this week
Before Friday’s jobs number, traders will get a look at the latest service-sector performance data:
●Today: Factory Orders (10 a.m.), Total Vehicle Sales
●Tuesday: Trade Balance, Markit Services PMI, ISM Non-Manufacturing Index
●Wednesday: ADP Employment Change
●Thursday: Challenger Job Cuts, Consumer Credit
●Friday: Employment Report, Wholesale Inventories
This week’s earnings include:
●Today: Steris (STE), Duckhorn Portfolio (NAPA)
●Tuesday: PepsiCo (PEP), Micron (MU)
●Wednesday: Acuity Brands (AYI), Constellation Brands (STZ), Levi Strauss (LEVI), RPM (RPM)
●Thursday: Conagra (CAG), Lamb Weston (LW), Tilray (TLRY)
●Friday: Byrna Technologies (BYRN)
This week’s IPOs include: iFit Health & Fitness (IFIT), Life Time Group (LTH).
Check the Active Trader Commentary each morning for an updated list of earnings announcements, IPOs, economic reports, and other market events.
Q3 showers, Q4 flowers?
Coming off a down week, a down month—and a nearly down quarter—may not be a feel-good for bulls, but it’s a good reason to do a little number crunching and see how this performance stacks up against other years.
Since 1960, the SPX has gained ground in 66% of all quarters, and has an average quarterly return of 2.1%.2 Third-quarters have just a slightly lower win rate—64% have been positive—but the average Q3 return is just 0.4%, dragged down by occasional large sell-offs. But the third quarter of this year didn’t even manage to surpass that modest average—at 0.2%, it was the smallest positive Q3 return since 1960:
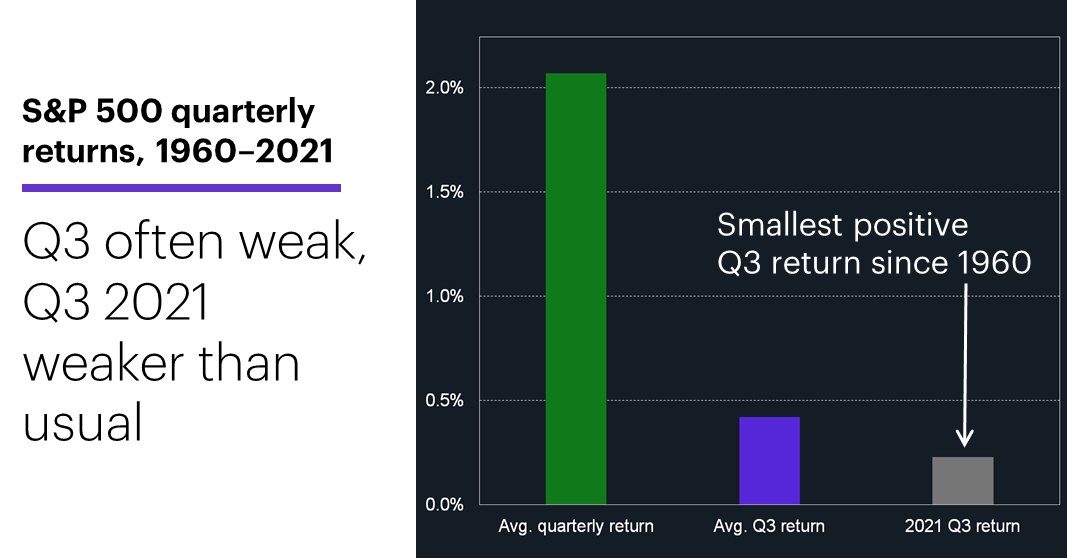
Source (data): Power E*TRADE. (For illustrative purposes. Not a recommendation.)
But even with Q3’s wobbly performance, the market’s year-to-date numbers are still fairly robust: The SPX’s return this year through Q3 was 14.7%—the 15th-biggest gain through three quarters since 1960.
And what about the rest of the year? Despite October’s track record of volatility, Q4 has historically been the strongest three months of the year, with the SPX posting a net Q4 gain 77% of the time and returning an average of 3.9%.
And if you think that bullish Q4 performance has something to do with the market rebounding from sub-par Q3s, you might be on to something. While the SPX’s average Q4 return after the 30-strongest Q3s since 1960 (those with returns above 5%) was 1.9%, its average after the 31 weakest Q3s (those with returns below 5%) was 4.7%.
Click here to log on to your account or learn more about E*TRADE's trading platforms, or follow the Company on Twitter, @ETRADE, for useful trading and investing insights.
1 CNBC.com. $80 oil is sending the market toward demand destruction, Morgan Stanley says. 9/23/21.
2 All figures derived from monthly S&P 500 (SPX) closing prices, December 1959 – September 2021. Supporting document available upon request.